Fig. 8
Download original image
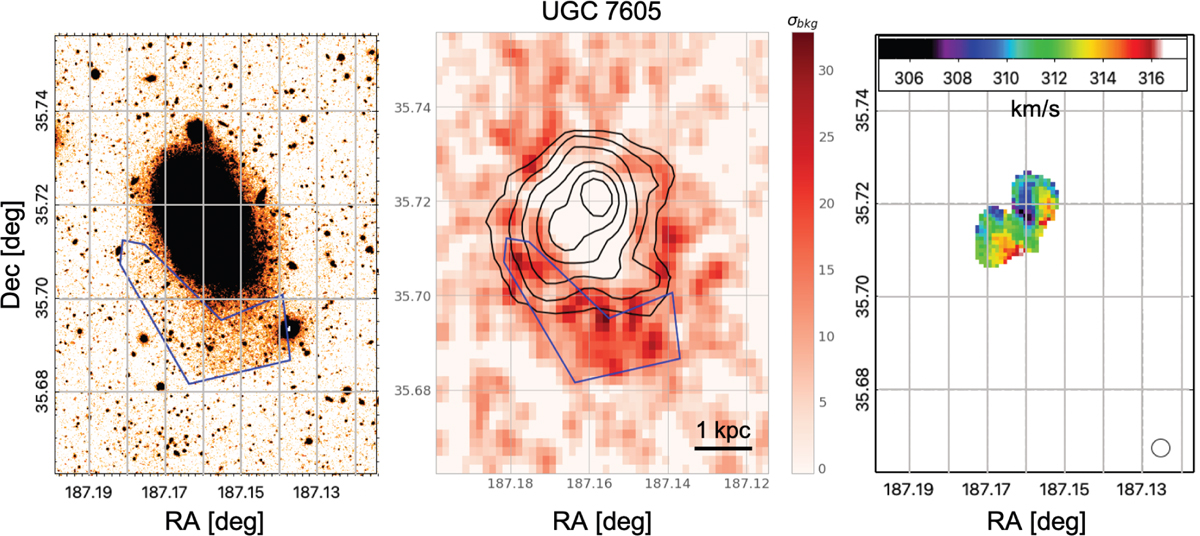
Same as Figures 5–7 for UGC 7605. The field of view here is ~4.1′ × 5.8′, or ~5.3 × 7.4 kpc2, and the HI contours correspond to [0.1, 0.5, 1, 2, 3, and 4] ×1020 atoms/cm2. The gas emission in the central and right panels has a different resolution, with a 43″ × 38″ beam for the HI contours and a higher-resolution 16″ × 12″ beam for the velocity field. The HI data are taken from the GMRT program FIGGS (Begum et al. 2008).
Current usage metrics show cumulative count of Article Views (full-text article views including HTML views, PDF and ePub downloads, according to the available data) and Abstracts Views on Vision4Press platform.
Data correspond to usage on the plateform after 2015. The current usage metrics is available 48-96 hours after online publication and is updated daily on week days.
Initial download of the metrics may take a while.