| Issue |
A&A
Volume 691, November 2024
|
|
|---|---|---|
| Article Number | A206 | |
| Number of page(s) | 8 | |
| Section | Planets and planetary systems | |
| DOI | https://doi.org/10.1051/0004-6361/202449326 | |
| Published online | 13 November 2024 | |
Venusian ion escape under extreme conditions: A dynamic pressure and temperature simulation study
1
Space and Plasma Physics Division, KTH Royal Institute of Technology,
Stockholm,
Sweden
2
Swedish Institute of Space Physics,
Uppsala,
Sweden
3
Laboratoire de Physique des Plasmas (LPP),
Paris,
France
4
IRAP, CNRS-UPS-CNES, Université de Toulouse,
Toulouse,
France
5
ISAS/JAXA,
Sagamihara,
Japan
6
LATMOS/IPSL, UVSQ Université Paris-Saclay, UPMC University Paris CNRS,
Guyancourt,
France
7
Thales,
Toulouse,
France
8
Institut Supérieur de l’Aéronautique et de l’Espace (ISAE-SUPAERO), Université de Toulouse,
Toulouse,
France
★ Corresponding author; This email address is being protected from spambots. You need JavaScript enabled to view it.
Received:
23
January
2024
Accepted:
18
September
2024
Abstract
Context. We investigated the response of the Venusian atmospheric ion escape under the effect of interplanetary coronal mass ejections (ICMEs) using the Latmos Hybrid Simulation (LatHyS).
Aims. In particular, we focused on the influence of extreme ICME dynamic pressures and temperatures, with the temperature being a parameter that has not been extensively studied in the past.
Methods. Simulations were performed for two different dynamic pressures and three different temperatures. For the case of the dynamic pressure simulations, a density and a velocity enhancement event were studied separately. The H+ and O+ ion escape was then examined and compared for different escape channels.
Results. In both dynamic pressure enhancement cases, we find that there is no clear dependence of the O+ ion escape on the dynamic pressure, which is consistent with observations. On the other hand, the temperature of the incoming solar wind positively influences the H+ and O+ ion escape. This is attributed in part to the enhanced gyroradius of the particles, which allows them to penetrate deeper into the planet’s atmosphere.
Key words: methods: numerical / planets and satellites: atmospheres / planets and satellites: terrestrial planets
© The Authors 2024
 Open Access article, published by EDP Sciences, under the terms of the Creative Commons Attribution License (https://creativecommons.org/licenses/by/4.0), which permits unrestricted use, distribution, and reproduction in any medium, provided the original work is properly cited.
This article is published in open access under the Subscribe to Open model. This email address is being protected from spambots. You need JavaScript enabled to view it. to support open access publication.
1 Introduction
The planet Venus is characterized by its hot, dense, and dry atmosphere. Despite its current state, it is believed that Venus used to have an abundance of water, as evidenced by the deuterium-hydrogen ratio measured by Pioneer Venus Orbiter (Donahue et al. 1982).
The disappearance of water on Venus can be attributed to a number of processes, from surface interactions that trap volatile species to atmospheric escape. It has been especially linked to the atmospheric erosion caused by the interaction of the solar wind with the atmosphere of the planet (Gillmann et al. 2022).
Venus does not have an intrinsic magnetic field, which influences the mechanisms governing ion escape from the planet’s atmosphere. However, an induced magnetosphere is generated through the interaction between the solar wind and Venus’s ionosphere. The atmosphere gets ionized mainly by solar extreme ultraviolet radiation and an ionosphere is formed, which acts as a conductive obstacle in the solar wind’s path. This interaction induces currents in the Venusian ionosphere, which in turn induce a magnetic field. The induced magnetic field, though much weaker than that of magnetized planets, along with the thermal pressure of the planetary ions, acts as an obstacle to the solar wind. This obstruction prevents the interplanetary magnetic field (IMF) from directly penetrating the planet, causing the solar wind’s magnetic field to drape around Venus. Due to the thin layer of the induced magnetic field, the incoming solar wind can still come in direct contact with the atmosphere of Venus. This interaction results in several processes that are primarily responsible for the escape of oxygen O+ and hydrogen H+ ions from the atmosphere (Futaana et al. 2017).
Some of the escape mechanisms that contribute the most to the present escape are sputtering, the pickup mechanism, and ion escape from the tail. Sputtering occurs when fast ions collide with atoms of the atmosphere, giving them enough kinetic energy to escape the planet. The pickup mechanism occurs when neutral atoms get ionized in the exosphere, where the convec-tive electric field of the solar wind − E = −υsw × B , with υsw the solar wind velocity and B the IMF – accelerates the newly created ions, which subsequently can escape in a ‘plume’-like structure. Ion outflow in the magnetotail occurs mainly through acceleration by electric fields, where the ions can gain enough energy to escape the planet (Gronoff et al. 2020). In this study we focus solely on the ion escape, and therefore, sputtering is not considered. Two main escape channels are identified: the plume and the tail.
Recent studies indicate that the ion escape measured today, when extrapolated backwards through time, is not enough to explain the amount of water that has historically been lost from the planet (Persson et al. 2020). This suggests that either ion escape in the young Solar System, when the Sun was more active and extreme events were more common, was more important than estimated, or that other processes are contributing to the loss. It is thus important to study the ion escape of the planet under extreme solar wind conditions. Interplanetary coronal mass ejections (ICMEs) fall under the category of extreme solar wind events, and the effect of their impact on the ion escape at Venus is still not fully understood. An ICME consists of large structures of plasma and magnetic field that are ejected from the Sun and travel into interplanetary space. The high speeds of the ICME with respect to the ambient plasma create a compression of the solar wind ahead. As a consequence of this compression, a region of increased magnetic field magnitude, plasma density, temperature, and dynamic pressure is created. This region is called the ICME sheath (Hanlon et al. 2004; Masías-Meza et al. 2016; Regnault et al. 2020). In this study we investigated the response of the ion escape at Venus when impacted by ICMEs and, thus, by extreme solar wind and magnetic field values. In previous works, the impact of extreme solar wind conditions on the heavy ion escape was investigated using observations (Luhmann et al. 2007; McEnulty et al. 2010; Edberg et al. 2011; Collinson et al. 2015) and simulations (Luhmann et al. 2008; Dimmock et al. 2018). Among them, Luhmann et al. (2007) presented evidence from Venus Express (VEX) measurements of enhancements in the O+ ion escape during disturbed solar wind, compared with nominal conditions. In a statistical study of 147 extreme solar wind events observed by VEX during solar minimum, Edberg et al. (2011) showed that the escape rate of O+ increased by a factor of two when the solar wind’s dynamic pressure rose. The authors suggested that this is an effect of the deeper penetration of the solar wind into the planet’s ionosphere during those time periods. McEnulty et al. (2010) examined the effect of 17 ICMEs during solar minimum on the Venus ion escape, and on the contrary did not observe any enhancement of the pickup ion O+ flux; however, they noted an increase in the ion energy. Luhmann et al. (2008), using VEX observations and a magnetohydrodynamic simulation of the solar wind interaction, examined four ICME cases that impacted Venus and found evidence of enhanced O+ escape in only one of them. The absence of O+ ions for the remaining events was attributed to the enhanced ICME magnetic field, which influenced the pickup ion wake geometry, and on the VEX orbital sampling. Dimmock et al. (2018) also used VEX observations and hybrid simulation runs to study an ICME that impacted Venus and produced an increase in the magnetic barrier of Venus to 250 nT. The simulations included a nominal case of a normal IMF and solar wind conditions, a second simulation that matched the measured ICME, and finally a third simulation that kept the same parameters as the second one except the density, which was increased by a factor of 1.7. They found a 24.5% enhancement in the O+ escape for the second simulation and 30.5% for the third compared to the nominal run.
Most of these previous studies focused on the effect of the enhancement of the dynamic pressure on the Venusian plasma environment and on atmospheric escape. So far, the effect of a higher solar wind temperature on the Venusian atmospheric escape has not been investigated in detail. An increased solar wind ion temperature results in an increased thermal plasma pressure. This will in turn influence the compressibility of the resulting shock between the solar wind and the induced magnetic field of the planet and will affect the position of the bow shock. Finally, it also affects the ion gyroradius, which grows with temperature. An increased gyroradius would cause the ions to penetrate deeper into the Venusian ionosphere. The solar wind temperature can vary greatly. During times of ICMEs close to 1 AU, the solar wind proton temperature has been found to range from 0.39 eV to 549.5 eV, with an average of 4.2 eV (Wilson et al. 2018). It would thus be of interest to examine the effect those changes can have on the atmospheric erosion of Venus.
Moreover, calculating ion escape using only observational data is challenging due to constraints such as the limited spatial coverage and field of view of the spacecraft, as well as the difficulties in accurately measuring low-energy ion fluxes caused by spacecraft charging (Futaana et al. 2017; Bergman et al. 2020). To bypass those limitations, simulations can be used. They also provide a global view of the processes that are occurring. In this study, we aim to contribute to a better understanding of the effect of different extreme solar wind conditions on the Venusian atmospheric escape. More specifically, we used global hybrid simulations of the Venusian plasma environment to target the ion escape during different extreme solar wind dynamic pressures and solar wind temperatures. Moreover, the ion escape was investigated with regard to the two main escape channels: the plume and the tail.
This article is organized as follows. In Sect. 2 the numerical model used in the study is introduced, and the simulations performed are explained. In Sects. 3 and 4, the results are presented and discussed. Finally, in Sect. 5 the conclusions are given.
2 Simulations
2.1 Numerical model
The simulation used in this study is a steady-state global hybrid model called the Latmos Hybrid Simulation (LatHyS). This model was first developed for Mars (Modolo et al. 2005, 2006, 2012; Modolo 2016) and adapted recently for the Venusian environment (Aizawa et al. 2022).
The simulation utilizes the hybrid formalism, using the kinetic description of the ions and the fluid one for the electrons. In the simulation, a cloud of ions with the same properties and a given density is represented as one macroparticle, while the electrons are treated as a massless, charge-neutralizing fluid. The movement of the macroparticles is controlled by Lorentz’s equation, and the magnetic fields are derived from Maxwell’s equations. The Venus Solar Orbital (VSO) coordinate system is used for the simulation, with the X direction positive towards the Venus-Sun line, the Z direction orthogonal to the orbital plane of the planet, pointing to the north, and the Y direction opposite to the orbital motion, completing the right-handed system. An open boundary condition is utilized for the X direction and periodic ones for the Y and Z directions.
The LatHyS simulation has a self-consistently calculated ionosphere, through the ionization of the simulated exosphere. The steady-state exosphere is modelled using H, O, and CO2 as its main species. For the ionization, the following processes are taken into consideration: photo-production, charge exchange, and electron impact ionization producing H+, O+,  and
and  planetary ions. To calculate the photo-production, the F10.7 solar flux index is used as a proxy for the solar activity. The simulated solar wind plasma consists of alpha particles (5%) and protons (95%). The planetary as well as the solar wind ions can be tracked separately in the simulation.
2.2 Input parameters
The observational data used in this study were taken from VEX (Svedhem et al. 2007). Magnetic field data were taken from its magnetometer, MAG (Zhang et al. 2007), while ion data were taken from the Ion Mass Analyser (IMA) of the ASPERA-4 package (Barabash et al. 2007). Solar irradiance data, used in the simulations, were taken from the LASP Interactive Solar IRradiance Datacenter (LISIRD; Leise et al. 2021). For the electron temperature, the relation Te = 2.06 Ti, with Te and Ti the electron and ion temperatures, respectively, was implemented based on statistical studies (Wilson et al. 2018). ICME catalogues compiled by Good & Forsyth (2016) and ICMECAT by Möstl et al. (2017) were used to identify suitable ICME cases for this study.
To study the effects of the temperature and dynamic pressure of ICMEs on the Venusian atmospheric escape, we selected two ICME events as reference for the simulations. The first ICME event (ICME 1) impacted Venus on 5 November 2011 and the second (ICME 2) reached Venus on 13 October 2013. The ICME parameters were taken from VEX measurements upstream of the bow shock. The selected events both took place during solar maximum. They were chosen in such a way so that their solar radio fluxes as well as their upstream IMF and solar wind densities were similar, leaving their solar wind speeds (946 km/s and 633 km/s) and ion temperatures (204 eV and 35 eV) as the only major differences. The difference in speeds consequently means a difference in their dynamic pressures ( , where ρ is the solar wind mass density and υsw the velocity). The ICME parameters are shown in the first two columns of Table 1.
Different simulation runs were performed for the investigation of the effects of the solar wind temperature and the solar wind dynamic pressure on the Venusian ion escape. Rounded values of the measured IMF and solar wind parameters were simulated. This was done in an effort to find values between the two ICMEs (for the IMF, solar wind speed, and density), as well as to have more uniform input parameters for the simulations.
Three simulation runs were used to examine the impact of the solar wind temperature on the ion escape. Two of those were rounded values of the measured ICME parameters, while a third intermediate temperature was also tested. The temperature inputs were the following: 200 eV for Simulation Sim T1, 90 eV for Sim T2, and 35 eV for Sim T3.
The impact of the dynamic pressure of the solar wind on the planet’s ion escape was also examined. The dynamic pressure was raised from 4 nPa to 8.8 nPa in two different ways, following a solar wind speed and a solar wind density increase. The inputs for the simulations were: [Pdyn = 8.8 nPa, v = 900 m/s, n = 6.5/cc] (Sim P1 − speed increase), [Pdyn = 4 nPa, v = 600 m/s, n = 6.5/cc] (Sim P2), [Pdyn = 8.8 nPa, v = 600 m/s, n = 14.6/cc] (Sim P3 − density increase). All other parameters were equal in all the simulations. All simulation runs had the same spatial resolution (150 km), time step (0.03  ) and number of grids (Nx=244, Ny=300, and Nz=300). The values of all simulations can be found in Table 1.
Simulation input parameters.
3 Results
To quantify the ion escape, the escape flux of the O+ and H+ planetary ions was calculated. This flux was defined as Φ = nυS with n the number density of the planetary ions, υ their speed, and S the surface of integration. The escape was calculated for the two different escape channels, the plume and the tail, using two defined regions where the majority of the escape was identified to occur. As the plume escape occurs in the direction of the electric field, the Venus–Sun electric (VSE) coordinate system was used for the flux calculation, instead of the VSO coordinate system. The VSE system has the Z component parallel to the convective electric field of the solar wind, the X component anti-parallel to the solar wind direction and the Y component completing the right-handed system. The plume escape region was approximated here by X = (−3, −1) RV (Venus radius, 6052 km), Y = (−2, 2) RV, and Z = (1.4,3) RV, and the tail region by X = (−2.5, −2) RV, Y = (−1,1) RV and Z = (−1.7, 1) RV. The escape flux for each channel (the plume and the tail) was calculated in the following way. The flux was integrated over the selected Y-Z surface, and this was done for each numerical cell in the selected X direction. Finally, the escape fluxes for each X cell were averaged. The combination of the tail and plume flux was called total escape flux. A point of caution was the existence of the return flows of ions, known as Venusward flows. These are observed in the magnetotail and consist of ions that are returning to the planet (Kollmann et al. 2016; Persson et al. 2018). These flows were excluded from the calculation of the magnetotail fluxes, by requiring that the VX component in the calculated flux is negative and thus directed away from the planet.
Figure 1 shows the flux of the H+ solar wind ions as well as the flux of H+ and O+ planetary ions in the XZ plane and in the VSE coordinate system, for all simulations. Arrows show the direction of the flux. The plume and tail escape can be seen in the figure for the H+ and O+ planetary ions. From the figure, initial observations about the size of the shock front in the magnetosphere as well as the ion escape were made. We examined the simulations with the varying temperatures first (Sim T1, Sim T2, and Sim T3). It should be noted that the input temperature increases from Sim 3 to Sim 1. As the temperature increases, there is a decrease in the magnetosonic Mach number and an increase in the plasma beta. As a consequence, the shock front becomes weaker with the enhancement in temperature, and the presence of solar wind ions in the magnetotail increases (Figs. 1a, d, g). When we examine the O+ planetary flux, there is a clear increase in the tail escape as the temperature becomes higher (Figs. 1c, f, i). A similar increase is observed in the plume flux, where the plume extends farther away from the planet in the Z VSE direction for increased temperatures. This difference in flux density is less obvious for the H+ planetary ions. Nonetheless, there is a slight enhancement in the flux for the simulation T2 (90 eV) and T1 (200 eV) compared to simulation T3 (35 eV; Figs. 1b, e, h).
We next examined the simulations with varying dynamic pressure (Sim P1, Sim P2, and Sim P3). We compared the sizes of the bow shock for the different simulations by looking at its width at terminator (Figs. 1g, j, m). The event with the lowest solar wind dynamic pressure (Sim P2) has the widest shock front, with a width of 5.9 RV at terminator, followed by the density enhancement event (Sim P3) with a width of 5.73 RV and finally the velocity enhancement event (Sim P1) with a shock width of 5.36 RV at terminator. Additionally, we observe that the presence of solar wind ions in the magnetotail increases in the density enhancement run (Sim P3), compared to the other simulations. Looking at the O+ flux (Figs. 1i, l, o), the simulation with the enhanced density (Sim P3 – Fig. 1o) appears to have the highest flux density in the magnetotail while no clear difference is observed between the fluxes of the other two simulations. A similar trend is observed for the H+ ions (Figs. 1h, k, n). Regarding the O+ plume escape, no big difference is noted between simulations P1 and P2, while the plume escape seems to decrease for simulation P3.
To gain a better understanding of the influence of the solar wind parameters on the ion population around Venus, we sampled the velocities of the escaping ions in the same intervals as the escaping flux. Histograms of the O+ speeds for the plume and tail regions are presented in Fig. 2. We note that the temperature variations do not have any significant effect on the ion speed distributions in the plume, but a higher temperature increases the number of low-energy ions in the magnetotail. On the other hand, an increase in the solar wind velocity significantly increases the O+ ion speed in the plume. This is in agreement with results by McEnulty et al. (2010), but has a more varying result in the magnetotail.
Finally, the results of the calculated H+ and O+ escape fluxes and their dependence on the upstream solar wind parameters are shown in Fig. 3. The results are shown for the different channels as well as for the total escape (plume and tail escape combined). The escape flux values for the different channels and the total escape can be found in Table 2. A correlation is found between the O+ and H+ ion escape fluxes and the upstream solar wind temperature (Fig. 3c). The increase in the O+ escape rate in relation to the temperature does not follow a linear trend but gets greater as the temperature increases. This phenomenon is more accentuated in the tail (Fig. 3a, purple), followed by a much smaller increase in the plume (Fig. 3b, purple). The escape from the tail represents 47% of the total (i.e. tail and plume) escape in Sim T3, 49% of the total escape in Sim T2 and 77% of the total escape in Sim T1. We observe that with higher temperatures, the escape from the plume and tail increases significantly, with the tail escape dominating, while for lower temperatures the tail and plume escape are comparable. For the simulations with the increase in the dynamic pressure, there is no noticeable correlation of the solar wind dynamic pressure on the escape of the planetary H+ and O+ ions (Fig. 3f). The escape flux of the O+ ions remains nearly constant for the enhancement of dynamic pressure (Fig. 3f, purple). The only difference is an increase in the speed of the escaping ions in the plume for the simulation with a velocity enhancement (Fig. 2c). This is expected as the convective electric field of the solar wind will also increase, thus increasing the ion acceleration. For the escape of the H+ ions, we note an enhancement of their escape for the simulation with the density increase, but a slight decrease for the simulation where the velocity was increased (Fig. 3f, blue).
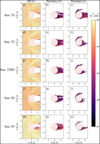 |
Fig. 1 Fluxes of the solar wind H+ ions and H+ and O+ planetary ions for the different simulations represented in the XZ plane. It should be noted that the VSE coordinate system is used. Streamlines designate the direction of the flux. |
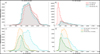 |
Fig. 2 Speed distributions of the Venusian O+ escaping ions for the plume (left column) and tail channels (right column). The top row shows the results for the simulations with varying upstream solar wind temperature. The bottom row shows the simulation results for varying upstream solar wind dynamic pressure. |
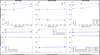 |
Fig. 3 Simulated escape fluxes of planetary H+ ions (blue squares) and O+ ions (purple circles) for the different escape channels. The escape fluxes are shown for different upstream solar wind temperatures (top) and different upstream solar wind dynamic pressures (bottom). |
Calculated planetary ion escape fluxes.
4 Discussion
The planetary O+ ion escape does not seem to be significantly affected by a general increase in the dynamic pressure. However, a slight difference is observed between the simulations, with the O+ ion escape being slightly higher in Sim P3 (density increase) than in Sim P1 (velocity increase; Fig. 3f, purple). An additional difference is an increase in the plume escape speed in the simulation with a velocity enhancement (P1; Fig. 2c), which is expected as the convective electric field of the solar wind will also increase. The enhancement of the solar wind density (Sim P3) has an additional positive influence on the H+ escape (Fig. 3f, blue), while there seems to be a decrease in escape for the enhanced solar wind velocity case (Sim P1). Two factors can contribute to these observed features. One potential mechanism responsible for the decrease in ion escape is linked to the compression of the magnetosphere of Venus due to the higher dynamic pressure. As the dynamic pressure increases, so does the magnetic pressure in the magnetosheath, balancing the ionospheric pressure. Signoles et al. (2023) reported that an increase in the dynamic pressure of the solar wind results in a small decrease in the size of the Venusian magnetosphere, while Wei et al. (2012) showed that during a case of extremely low solar wind density, the Venusian magnetosphere can expand up to four times in size, compared to nominal conditions. It has been theorized for Mars that a compression of the magnetosphere could be associated with a decrease in ion escape, as a smaller magnetosphere reduces correspondingly the area of acceleration interactions, for both the dayside magnetosphere region and the tail (Ramstad et al. 2015). A similar process could be taking place on Venus.
Nevertheless, we observe an increase in the H+ ion escape in Sim P3. A mechanism that potentially contributes to this increase could be charge exchange between the H+ with the planetary neutral H and O atoms. In our simulation, the charge exchange ionization rate is defined as follows (Modolo 2016):
 (1)
(1)
with X+ being the incident ion, M the neutral atom,  their charge exchange cross-section, n the density and v the velocity. The charge exchange cross-section for the different interactions is the following:
  cm2,
cm2,  ,
,  and stay constant through the simulation (Modolo 2016; Aizawa et al. 2022). We note that since the initial neutral atom densities, as well as the cross-sections for each reaction, are constant through the different simulations, the only parameters affecting the ionization rate for each reaction are the ion density and ion velocity. The solarwind dynamic pressure was raised in two different ways in the simulations, through a velocity and a density increase. In Sim P1, the velocity of the solar wind was increased by a factor of 1.5 (from 600 km/s to 900 km/s), while in Sim P3 the solar wind density was increased by a factor of 2.2 (from 6.5 to 14.6). It would then make sense that the charge exchange rate would be greater for Sim P3. With the creation of more ions, the ion escape correspondingly increases.
The difference between the escape rates of the H+ ions (which is increased) and O+ ions (which stay almost static), in both the P1 and P3 simulations, appears due to the interplay of different complex processes. Firstly, the charge exchange ionization rate of the planetary H and O atoms is affected by the difference in cross-section, with the proton-hydrogen cross-section  being 2.5 greater than the proton-oxygen cross-section
  . Secondly, the H+ ions require a lower amount of energy to escape the planet than the O+. In our case then, the smaller acceleration area, together with the smaller production rate and the higher energy demand required for the escaping O+ ions, creates the difference in escape for the H+ and O+ ions.
As shown in Fig. 3c, an enhancement in the solar wind temperature produces a greater escape of both O+ and H+ planetary ions. An effect that could influence this escape is the gyroradius of the solar wind ions  where ω is the ion gyrofrequency. With an enhancement in temperature, the gyroradius of the ions and electrons will also increase, allowing them to penetrate farther into the Venusian atmosphere. This will result in the creation of more planetary ions, and in turn increase the ion escape rate. Looking at Figs. 2a, b, we observe that with an increase in temperature, there is an increase in the number of low-velocity escaping ions from the tail channel, while there is a decrease in the escape of higher-velocity ions. This is consistent with amass loading effect, slowing down the escaping plasma.
For the planetary H+ ions, an increase in the total escape flux is noted for an increase in temperature from 35 eV to 90 eV, which then seems to almost plateau for a further temperature enhancement (Fig. 3c, blue). The escape velocity for Venus is approximately 10.4 km/s, meaning that the energy required for the escape of the H+ ions becomes 0.5 eV, which is low compared to the 8.7 eV required for the O+ ions. This plateau in the escape flux of the H+ planetary ions could thus indicate a source-limited case: all H+ ions available for escape have already reached escape energy, and additional energy will not significantly change the outcome. This is similar to what is discussed for the O+ escape at Mars, which has a lower escape velocity than Venus (Ramstad et al. 2017).
In order to contextualize the results of this study, the simulated O+ escape fluxes for the extreme solar wind conditions during solar maximum are plotted together with previous observational results in Fig. 4. The figure is adapted from Ramstad & Barabash (2021) and shows the observed heavy ion escape flux of different planets for normal solar wind conditions as a function of the upstream solar wind dynamic pressure at each planet. A comparison between those observations for Venus (yellow points) and our simulations can then be made. The observed ion fluxes (yellow points) show only a slight increase with the dynamic pressure of the solar wind, which is insignificant considering the large error bars (Masunaga et al. 2019). Our results also show a small change in the escape rates, although negative, with the ion escape rate staying mostly constant over the considered dynamic pressure range. We note a discrepancy in the order of magnitude between the observational and simulated escape ion fluxes. This difference can be attributed to two main reasons, the conditions investigated and the inherent differences between observations and simulations. The simulations effectuated in this work investigate exclusively extreme solar wind conditions. No such distinction was made for the observational data. An additional dissimilarity between the simulations and observations is that limitations from the instrumentation (such as spacecraft charging), or the spacecraft orbit (that would require an interpolation of the escape for the different channels) do not exist. While this could cause complications when directly comparing with observational data, in this study the focus is on the comparison between the different simulated cases.
Our results suggest that parameters that to our knowledge have not been studied in detail in the past, such as the incident ion temperature, can have an effect on the ion escape at Venus. It would be of interest then to study the effects of such parameters with in situ measurements, as well as to examine their effect on other heavy species like C+ ions, which were recently observed for the first time at high altitudes at Venus (Hadid et al. 2024). As shown in Fig. 3, the escape from the tail has a major role in the outgassing of the planet. Consequently, flybys from missions such as BepiColombo and Parker Solar Probe that cross the magnetotail of the planet, along with future Venus missions, will provide us with critical data for a better understanding of those processes.
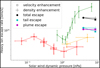 |
Fig. 4 Escape rate of heavy (O+) ions for different planets, in relation to the upstream solar wind dynamic pressure. The dotted lines represent direct observations, adapted from the review article of Ramstad & Barabash (2021). The solid lines represent the results of our ion escape simulations for Venus. In our simulations, the dynamic pressure was increased in two ways, by a velocity enhancement (squares) and by a density enhancement (crosses). The escape rates are further divided into different channels, escape from the plume (magenta) and escape from the tail (blue). Black represents the total escape. |
5 Conclusions
Using data from VEX and the LatHyS global hybrid simulations, we examined the ion escape at Venus. More specifically, we studied the dependence of the O+ and H+ ion escape on the dynamic pressure and temperature of ICMEs. The simulations were modelled after two ICME events observed by VEX, and we investigated different cases by varying the solar wind temperature and dynamic pressure. For the dynamic pressure simulations, two possible scenarios were tested, a density and a velocity enhancement event. We find that the temperature of the incoming solar wind positively affects the escape rate of the O+ ions, mainly increasing their rate of escape from the tail. This may be due to the increased gyroradius of the solar wind ions for high solar wind temperatures, which causes them to penetrate deeper into the ionosphere and thus create more planetary ions in turn. Concerning the increase in the solar wind dynamic pressure, we find that there is no noticeable difference in the O+ ion escape for the different simulated cases. Nonetheless, an increase in the escape of the H+ ions appears with an increase of the solar wind’s density. We attribute that in part to the increase in the charge exchange rate associated with the rise in density. Our results indicate that additional parameters of ICMEs at Venus that had previously not been extensively taken into consideration, such as the ion temperature, can have larger effects on the plasma environment and the Venusian ion escape than previously believed. It would thus be of interest to examine such parameters in future studies of ICME impacts on the planet.
Data availability
The data that support the findings of this study are available at https://doi.org/10.5281/zenodo.10556495.
Acknowledgements
Part of the work carried out by SA is supported by Japan Society for the Promotion of Science (JSPS) KAKENHI number: 22J01606 as a JSPS post-doctoral fellow. French co-authors acknowledge the support of CNES for the Venus Express mission. Part of this work has been done when M.P. was funded by the Sun Planet Interactions Digital Environment Runs on request (SPI-DER) Virtual Activity of the European Union’s Horizon 2020 programme under grant agreement No 871149 for Europlanet 2024 RI.
References
- Aizawa, S., Persson, M., Menez, T., et al. 2022, Planet. Space Sci., 218, 105499 [NASA ADS] [CrossRef] [Google Scholar]
- Barabash, S., Sauvaud, J.-A., Gunell, H., et al. 2007, Planet. Space Sci., 55, 1772 [NASA ADS] [CrossRef] [Google Scholar]
- Bergman, S., Stenberg Wieser, G., Wieser, M., Johansson, F. L., & Eriksson, A. 2020, J. Geophys. Res.: Space Phys., 125, e2019JA027478 [Google Scholar]
- Collinson, G. A., Grebowsky, J., Sibeck, D. G., et al. 2015, J. Geophys. Res.: Space Phys., 120, 3489 [NASA ADS] [CrossRef] [Google Scholar]
- Dimmock, A. P., Alho, M., Kallio, E., et al. 2018, J. Geophys. Res.: Space Phys., 123, 3580 [NASA ADS] [CrossRef] [Google Scholar]
- Donahue, T. M., Hoffman, J. H., Hodges, R. R., & Watson, A. J. 1982, Science, 216, 630 [NASA ADS] [CrossRef] [Google Scholar]
- Edberg, N. J. T., Nilsson, H., Futaana, Y., et al. 2011, J. Geophys. Res.: Space Phys., 116 [Google Scholar]
- Futaana, Y., Stenberg Wieser, G., Barabash, S., & Luhmann, J. G. 2017, Space Sci. Rev., 212, 1453 [NASA ADS] [CrossRef] [Google Scholar]
- Gillmann, C., Way, M. J., Avice, G., et al. 2022, Space Sci. Rev., 218, 56 [NASA ADS] [CrossRef] [Google Scholar]
- Good, S., & Forsyth, R. 2016, Solar Phys., 291, 239 [NASA ADS] [CrossRef] [Google Scholar]
- Gronoff, G., Arras, P., Baraka, S., et al. 2020, J. Geophys. Res.: Space Phys., 125, e2019JA027639 [Google Scholar]
- Hadid, L. Z., Delcourt, D., Saito, Y., et al. 2024, Nat. Astron., 8, 716 [CrossRef] [Google Scholar]
- Hanlon, P. G., Dougherty, M. K., Forsyth, R. J., et al. 2004, J. Geophys. Res.: Space Phys., 109 [Google Scholar]
- Kollmann, P., Brandt, P., Collinson, G., et al. 2016, Icarus, 274, 73 [CrossRef] [Google Scholar]
- Leise, H., Lindholm, D., Lindholm, C., et al. 2021, AGU Fall Meeting 2021 [Google Scholar]
- Luhmann, J. G., Kasprzak, W. T., & Russell, C. T. 2007, J. Geophys. Res.: Planets, 112 [Google Scholar]
- Luhmann, J. G., Fedorov, A., Barabash, S., et al. 2008, J. Geophys. Res.: Planets, 113 [CrossRef] [Google Scholar]
- Masunaga, K., Futaana, Y., Persson, M., et al. 2019, Icarus, 321, 379 [NASA ADS] [CrossRef] [Google Scholar]
- Masías-Meza, J. J., Dasso, S., Démoulin, P., Rodriguez, L., & Janvier, M. 2016, A&A, 592, A118 [NASA ADS] [CrossRef] [EDP Sciences] [Google Scholar]
- McEnulty, T., Luhmann, J., de Pater, I., et al. 2010, Planet. Space Sci., 58, 1784 [NASA ADS] [CrossRef] [Google Scholar]
- Modolo, R. 2016, J. Geophys. Res.: Space Phys., 121, 6378 [NASA ADS] [CrossRef] [Google Scholar]
- Modolo, R., Chanteur, G. M., Dubinin, E., & Matthews, A. P. 2005, Ann. Geophys., 23, 433 [NASA ADS] [CrossRef] [Google Scholar]
- Modolo, R., Chanteur, G. M., Dubinin, E., & Matthews, A. P. 2006, Ann. Geophys., 24, 3403 [NASA ADS] [CrossRef] [Google Scholar]
- Modolo, R., Chanteur, G. M., & Dubinin, E. 2012, Geophys. Res. Lett., 39 [CrossRef] [Google Scholar]
- Möstl, C., Isavnin, A., Boakes, P. D., et al. 2017, Space Weather, 15, 955 [CrossRef] [Google Scholar]
- Persson, M., Futaana, Y., Fedorov, A., et al. 2018, Geophys. Res. Lett., 45, 10805 [NASA ADS] [CrossRef] [Google Scholar]
- Persson, M., Futaana, Y., Ramstad, R., et al. 2020, J. Geophys. Res.: Planets, 125, e2019JE006336 [NASA ADS] [CrossRef] [Google Scholar]
- Ramstad, R., & Barabash, S. 2021, Space Sci. Rev. [Google Scholar]
- Ramstad, R., Barabash, S., Futaana, Y., et al. 2015, J. Geophys. Res.: Planets, 120, 1298 [NASA ADS] [CrossRef] [Google Scholar]
- Ramstad, R., Barabash, S., Futaana, Y., Nilsson, H., & Holmström, M. 2017, J. Geophys. Res.: Space Phys., 122, 8051 [NASA ADS] [CrossRef] [Google Scholar]
- Regnault, F., Janvier, M., Démoulin, P., et al. 2020, J. Geophys. Res.: Space Phys., 125, e2020JA028150 [CrossRef] [Google Scholar]
- Signoles, C., Persson, M., Futaana, Y., et al. 2023, ApJ, 954, 95 [NASA ADS] [CrossRef] [Google Scholar]
- Svedhem, H., Titov, D., McCoy, D., et al. 2007, Planet. Space Sci., 55, 1636 [NASA ADS] [CrossRef] [Google Scholar]
- Wei, Y., Fraenz, M., Dubinin, E., et al. 2012, Planet. Space Sci., 73, 254 [NASA ADS] [CrossRef] [Google Scholar]
- Wilson, L. B. III, Stevens, M. L., Kasper, J. C., et al. 2018, ApJS, 236, 41 [NASA ADS] [CrossRef] [Google Scholar]
- Zhang, T., Berghofer, G., Magnes, W., et al. 2007, ESA Spec. Publ., SP 1295, 1 [Google Scholar]
All Tables
All Figures
|
Fig. 1 Fluxes of the solar wind H+ ions and H+ and O+ planetary ions for the different simulations represented in the XZ plane. It should be noted that the VSE coordinate system is used. Streamlines designate the direction of the flux. |
| In the text | |
|
Fig. 2 Speed distributions of the Venusian O+ escaping ions for the plume (left column) and tail channels (right column). The top row shows the results for the simulations with varying upstream solar wind temperature. The bottom row shows the simulation results for varying upstream solar wind dynamic pressure. |
| In the text | |
|
Fig. 3 Simulated escape fluxes of planetary H+ ions (blue squares) and O+ ions (purple circles) for the different escape channels. The escape fluxes are shown for different upstream solar wind temperatures (top) and different upstream solar wind dynamic pressures (bottom). |
| In the text | |
|
Fig. 4 Escape rate of heavy (O+) ions for different planets, in relation to the upstream solar wind dynamic pressure. The dotted lines represent direct observations, adapted from the review article of Ramstad & Barabash (2021). The solid lines represent the results of our ion escape simulations for Venus. In our simulations, the dynamic pressure was increased in two ways, by a velocity enhancement (squares) and by a density enhancement (crosses). The escape rates are further divided into different channels, escape from the plume (magenta) and escape from the tail (blue). Black represents the total escape. |
| In the text | |
Current usage metrics show cumulative count of Article Views (full-text article views including HTML views, PDF and ePub downloads, according to the available data) and Abstracts Views on Vision4Press platform.
Data correspond to usage on the plateform after 2015. The current usage metrics is available 48-96 hours after online publication and is updated daily on week days.
Initial download of the metrics may take a while.