Open Access
Fig. 2
Download original image
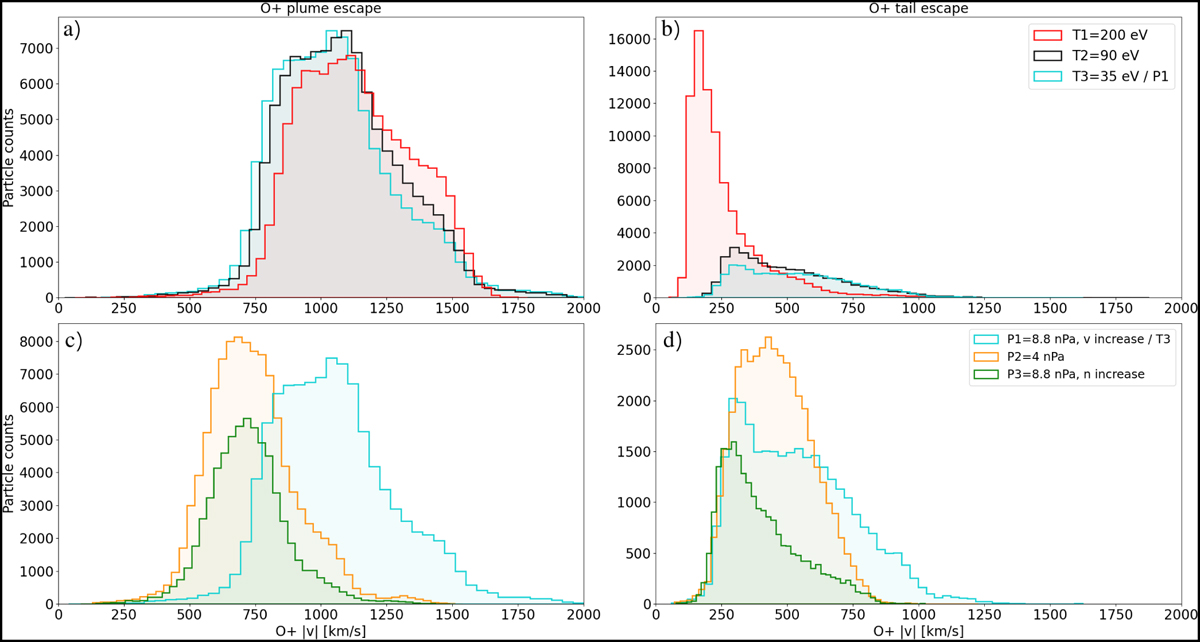
Speed distributions of the Venusian O+ escaping ions for the plume (left column) and tail channels (right column). The top row shows the results for the simulations with varying upstream solar wind temperature. The bottom row shows the simulation results for varying upstream solar wind dynamic pressure.
Current usage metrics show cumulative count of Article Views (full-text article views including HTML views, PDF and ePub downloads, according to the available data) and Abstracts Views on Vision4Press platform.
Data correspond to usage on the plateform after 2015. The current usage metrics is available 48-96 hours after online publication and is updated daily on week days.
Initial download of the metrics may take a while.