| Issue |
A&A
Volume 691, November 2024
|
|
|---|---|---|
| Article Number | A305 | |
| Number of page(s) | 7 | |
| Section | Extragalactic astronomy | |
| DOI | https://doi.org/10.1051/0004-6361/202347119 | |
| Published online | 20 November 2024 | |
JADES: Balmer decrement measurements at redshifts 4 < z < 7
1
Kavli Institute for Cosmology, University of Cambridge, Madingley Road, Cambridge CB3 0HA, UK
2
Cavendish Laboratory, University of Cambridge, 19 JJ Thomson Avenue, Cambridge CB3 0HE, UK
3
Department of Physics and Astronomy, University College London, Gower Street, London WC1E 6BT, UK
4
Centro de Astrobiología (CAB), CSIC–INTA, Cra. de Ajalvir Km. 4, 28850 Torrejón de Ardoz, Madrid, Spain
5
Cosmic Dawn Center (DAWN), Copenhagen, Denmark
6
Niels Bohr Institute, University of Copenhagen, Jagtvej 128, DK-2200 Copenhagen, Denmark
7
Steward Observatory, University of Arizona, 933 N. Cherry Avenue, Tucson, AZ 85721, USA
8
Department of Physics, University of Oxford, Denys Wilkinson Building, Keble Road, Oxford OX1 3RH, UK
9
Scuola Normale Superiore, Piazza dei Cavalieri 7, I-56126 Pisa, Italy
10
Sorbonne Université, CNRS, UMR 7095, Institut d’Astrophysique de Paris, 98 bis bd Arago, 75014 Paris, France
11
European Southern Observatory, Karl-Schwarzschild-Strasse 2, 85748 Garching, Germany
12
Centre for Astrophysics Research, Department of Physics, Astronomy and Mathematics, University of Hertfordshire, Hatfield AL10 9AB, UK
13
Max-Planck-Institut für Astronomie, Königstuhl 17, D-69117 Heidelberg, Germany
14
Center for Astrophysics | Harvard & Smithsonian, 60 Garden St., Cambridge, MA 02138, USA
15
AURA for European Space Agency, Space Telescope Science Institute, 3700 San Martin Drive, Baltimore, MD 21210, USA
16
Department for Astrophysical and Planetary Science, University of Colorado, Boulder, CO 80309, USA
17
European Space Agency (ESA), European Space Astronomy Centre (ESAC), Camino Bajo del Castillo s/n, 28692 Villafranca del Castillo, Madrid, Spain
18
Department of Astronomy and Astrophysics University of California, Santa Cruz, 1156 High Street, Santa Cruz, CA 96054, USA
19
Astrophysics Research Institute, Liverpool John Moores University, 146 Brownlow Hill, Liverpool L3 5RF, UK
20
NSF’s National Optical-Infrared Astronomy Research Laboratory, 950 North Cherry Avenue, Tucson, AZ 85719, USA
21
NRC Herzberg, 5071 West Saanich Rd, Victoria, BC V9E 2E7, Canada
⋆ Corresponding authors; This email address is being protected from spambots. You need JavaScript enabled to view it.
, This email address is being protected from spambots. You need JavaScript enabled to view it.
Received:
7
June
2023
Accepted:
23
August
2024
Abstract
We present Balmer decrement, Hα/Hβ, measurements for a sample of 51 galaxies at redshifts z = 4 − 7 observed with the JWST/NIRSpec micro-shutter assembly (MSA), as part of the JWST Advanced Deep Extragalactic Survey (JADES). Leveraging 28-hour long exposures and the efficiency of the prism/clear configuration (but also using information from the medium-resolution gratings), we were able to directly probe the low-mass end of the galaxy population, reaching stellar masses, M⋆, as low as 107 M⊙. We find that the correlation between the Balmer decrement and M⋆ is already established at these high redshifts, indicating a rapid buildup of dust in moderately massive galaxies at such early epochs. The lowest-mass galaxies in our sample (M⋆ = 1 − 3 × 10⁷ M⊙) display a remarkably low Balmer decrement of 2.88 ± 0.08, consistent with Case B, suggesting very little dust content. However, we warn that such a low observed Balmer decrement may also partly be a consequence of an intrinsically lower Hα/Hβ resulting from the extreme conditions of the ionised gas in these primeval and unevolved systems. We further compare the Balmer decrement to continuum-derived star formation rates (SFRs), finding tentative evidence of a correlation, which likely traces the underlying connection between the SFR and the mass of cold gas. However, we note that larger samples are required to distinguish between direct and primary correlations from indirect and secondary dependences at such high redshifts.
Key words: dust / extinction / Galaxy: evolution / galaxies: high-redshift / galaxies: ISM
© The Authors 2024
 Open Access article, published by EDP Sciences, under the terms of the Creative Commons Attribution License (https://creativecommons.org/licenses/by/4.0), which permits unrestricted use, distribution, and reproduction in any medium, provided the original work is properly cited.
This article is published in open access under the Subscribe to Open model. This email address is being protected from spambots. You need JavaScript enabled to view it. to support open access publication.
1. Introduction
Balmer recombination lines are an efficient probe of star-forming regions. They are the brightest non-resonant series (enabling efficient escape, unlike the intrinsically brighter Lyman series), and they are less affected by dust attenuation compared to probes at shorter wavelengths. The Balmer series is therefore the brightest measure of the flux of hydrogen-ionising continuum emitted by massive, short-lived stars (< 10 Myr). These lines therefore provide the most direct measure of the current rate of star formation, on timescales of 3–10 Myr (Flores Velázquez et al. 2021; Tacchella et al. 2022).
Because of the wavelength-dependent attenuation from dust, the observed flux ratio between the Balmer lines (the Balmer decrement) provides a direct measure of the optical depth towards star-forming regions. This measurement is essential to complement alternative probes such as the attenuation of the optical and ultraviolet (UV) stellar continuum (e.g. Galliano et al. 2018; Salim & Narayanan 2020), which probe different optical depths (e.g. Calzetti et al. 1994).
This measurement requires knowledge of the intrinsic ratio, which is known from atomic physics and is relatively insensitive to a broad range of different physical conditions commonly found in star-forming regions (Osterbrock & Ferland 2006; Smith et al. 2022). In particular, variations in the gas temperature between 5000 and 20 000 K and in the density between 100 and 10 000 cm−3 can change the Balmer decrement by less than 10%.
Leveraging these advantages, the ratio of the two brightest lines – Hα/Hβ – has been used to estimate the dust and gas content of star-forming regions (Reddy et al. 2015; Nelson et al. 2016; Matharu et al. 2023; Piotrowska et al. 2020) and their relations with other galaxy properties (e.g. Groves et al. 2012). Maheson et al. (2023) show that the Balmer decrement correlates with the stellar mass, M⋆, with secondary dependences on gas metallicity and velocity dispersion. One should, however, also take into account that the geometry of the dust distribution also plays a role in the observed Balmer decrement. Specifically, very dusty and optically thick systems can potentially result in a low Balmer decrement, as the Balmer lines may trace only the outer, optically thin regions of the galaxy.
However, as we strive to observe more distant galaxies, at earlier cosmic times, the Balmer series is redshifted towards near-infrared (NIR) wavelengths, where atmospheric absorption, as well as thermal and telluric emission from the atmosphere, make ground-based observations difficult. Despite that, in recent years, ground-based NIR surveys have revealed how the Balmer decrement evolves up to cosmic noon, at redshifts z = 2 − 3 (Kriek et al. 2015; Reddy et al. 2015; Curti et al. 2020; Lorenz et al. 2023). Yet, at z > 3, Hα is redshifted beyond 2.6 μm, where ground-based observations of faint distant galaxies are prohibitively expensive. This meant that, at these high redshifts, dust could only be probed using sub-millimetre observations (Watson et al. 2015; Laporte et al. 2017; Witstok et al. 2022), which is feasible only for relatively high stellar masses.
The start of the James Webb Space Telescope (JWST) science operations in July 2022 gave us, for the first time, a view into Hα at redshifts z > 3 (Gardner et al. 2023). Early results using data from the Cosmic Evolution Early Release Science Survey (CEERS; Finkelstein et al. 2023) show that the correlation between the Balmer decrement and stellar mass is already established at z = 4 − 6 (Shapley et al. 2023). In particular, low-mass galaxies are confirmed to have a low Balmer decrement – suggesting a low dust content. At the same time, studies of collisionally excited lines show that the star-forming regions of early galaxies were hotter than in the local Universe, with electron temperatures of ≈20 000 K (e.g. Schaerer et al. 2022; Curti et al. 2023, 2024), and possibly denser, with electron densities ne ≈ 500 cm−3 (Reddy et al. 2023). These differences mean that the intrinsic Balmer decrement should also be slightly different, requiring a correction to our methods for estimating dust attenuation.
In this work we leveraged the unprecedented depth of the JWST Advanced Deep Extragalactic Survey (JADES; Eisenstein et al. 2023) to probe dust attenuation in the star-forming regions of galaxies at redshifts z = 4 − 7. In Sect. 2 we introduce the data and sample and describe the measurements we used. Our results are presented in Sect. 3, and we conclude the article with a discussion of the implications (Sect. 4) and a summary (Sect. 5).
Throughout this work, we assume a flat Λ cold dark matter cosmology with H0 = 70 km s−1 Mpc−1, ΩM = 0.3, and ΩΛ = 0.7. For the initial mass function, we assume the functional shape of Chabrier (2003).
2. Data and sample selection
2.1. Data
We used data from JADES (Bunker et al. 2024; Eisenstein et al. 2023) obtained as part of programme ID 1210 (PI: N. Lützgendorf). The targets were selected from the GOODS-South field (Great Observatories Origins Deep Survey; Giavalisco et al. 2004), as described in Bunker et al. (2024). JWST/NIRSpec was configured to use the micro-shutter assembly (MSA; Jakobsen et al. 2022), with the prism/clear disperser/filter combination to obtain low-resolution spectroscopy (nominal R = 30 − 100) for 253 targets between 0.6 < λ < 5.3 μm. An example spectrum (JADES-GS+53.16904–27.77884) is shown in Fig. 1.
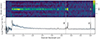 |
Fig. 1. NIRSpec low-resolution spectrum of JADES-GS+53.16904–27.77884 with a redshift of z = 6.6. Top: 2D spectrum colour-coded by the S/N. Bottom: Extracted 1D flux density versus observed wavelength. |
Each target was assigned to an array of 3 × 1 micro-shutters, forming an effective slit of 0.2 arcsec width and ≈1.3 arcsec length. We used three dither positions and three nods, for a total integration time of up to 28 hours. The data reduction was performed using the pipeline developed by the ESA NIRSpec Science Operations Team and the NIRSpec GTO Team. We used the publicly available data products v3.0, which include a wavelength-dependent slit-loss correction, assuming all sources are unresolved. We refer to Carniani et al. (in prep.) and to Cameron et al. (2023), Curti et al. (2024), Curtis-Lake et al. (2023) for more information on the data reduction process.
In addition to prism spectroscopy, JADES also provides medium-resolution (nominal R = 1000) spectroscopy covering the full 0.6–5.3 μm range, combining the three disperser/filter configurations: g140m/f070lp, g235m/f170lp and g395m/f290lp. This dataset is less deep than the prism observations, owing to shorter exposure times (≈7 hours). Moreover, medium-resolution observations do not cover the entire sample.
2.2. Target selection and redshift determination
The target selection was based on the photometric Lyman-break technique, as described in Bunker et al. (2024). With the sensitivity of our observations (reaching a 10σ emission-line sensitivity of 3 × 10⁻¹⁹ erg s−1 cm−2 in the prism; Eisenstein et al. 2023, their Fig. 9), we probe stellar masses down to 106 M⊙. However, in this work we are limited to 107 M⊙ due to additional requirements in the emission-line signal-to-noise ratio (S/N).
Galaxy redshifts were obtained with an iterative procedure. We used BAGPIPES (Carnall et al. 2018) to infer the spectroscopic redshift from the prism observations. This redshift was subsequently refined via a visual inspection of the medium- and high-resolution spectra (if available) and by fitting the emission lines with a Gaussian. In this work, we always require the detection of at least two emission lines (Hβ and Hα); therefore, the redshifts are always well determined, within the accuracy of the spectroscopic data (Bunker et al. 2024; Jakobsen et al., in prep.).
At redshifts z < 4 the spectral resolution of the prism is unable to resolve the 0.1 μm gap between Hβ and [O III]λ4959. Noting that Hα is redshifted beyond 5.3 μm at redshift z = 7, we applied a redshift cut of 4 < z < 7, reducing our sample size to 58 (out of 253) objects.
2.3. Emission-line measurements
Emission-line fluxes were measured using simultaneous fitting of the stellar continuum and nebular emission with the software PPXF (Cappellari 2017, 2022).
The stellar continuum was modelled as a non-negative linear superposition of single stellar population (SSP) templates. The SSP spectra use C3K synthetic model atmospheres (Conroy et al. 2019) and MIST isochrones (Choi et al. 2016; Dotter 2016), which we convolved with a wavelength-dependent Gaussian kernel corresponding to 0.5 times the nominal spectral resolution of the NIRSpec prism. This is to provide a first-order correction to the increased spectral resolution for sources that are smaller than the micro-shutter width. Any flux bluewards of Lyα is set to zero because we do not model foreground absorption due to neutral-gas. In addition to the SSP spectra, the continuum also includes a fifth-order multiplicative Legendre polynomial, to model the effect of dust and the possible damping wing at rest-frame 0.12 μm. In this work we focused on rest-frame 0.4–0.7 μm, where the effect of these modelling choices is negligible. To evaluate the detection of the continuum, we focused on three spectral bands on the rest-frame prism spectra, each with a width of 150 Å on either side of 1500 Å, Hβ, and Hα. After masking emission lines, we estimated a median S/N per spectral pixel of 28, 9, and 4 in each of the three bands. The 5th (95th) percentiles are 5 (73), 1, (27), and 0 (21). These numbers imply that, in most cases, the continuum is detected both bluewards and redwards of the Balmer limit, which enables us to constrain the presence or absence of a Balmer break and, as a consequence, the strength of potential stellar absorption.
Emission lines were modelled as Gaussians, with a reduced set of parameters to maximise S/N; in particular, for this study, we tied together the velocity and velocity dispersion of the Hβ–[O III]λλ4959, 5007 complex and of the Hα–[N II]λλ6548, 6583 complex (hereafter, we always refer to the [O III]λλ4959, 5007 and [N II]λλ6548, 6583 doublets as [O III] and [N II]). When fixed by atomic physics, the ratio of emission-line doublets is constrained, which in this paper is relevant for both the [O III] and [N II] doublets. A critical aspect of these emission-line measurements is that – by simultaneously modelling the stellar continuum – our algorithm includes a correction for stellar-atmospheric absorption.
To evaluate the impact of absorption, we measured the absorbed flux from the best-fit continuum models and took the relevant ratio to the Balmer lines. The median ratio between the absorbed and emitted flux is 2 ± 4% for Hβ and 0.3 ± 0.7% for Hα (1σ uncertainties). Considering the final sample size of 51 galaxies (see below), and estimating the uncertainty on the median absorption as the standard deviation divided by  , we obtain a detection of the absorption of 3.5 and 3σ for Hβ and Hα, respectively.
Using low-resolution instead of medium-resolution spectroscopy presents advantages and disadvantages. In medium resolution, we always resolve the Hβ–[O III] and the Hα–[N II] complexes, giving more accurate measurements. However, medium-resolution observations are less deep and cover a smaller sample than the low-resolution observations. This means using low-resolution increases the precision at the expense of accuracy.
Within this context, we note that the Hα and [N II] lines are blended in the prism. Therefore, in order to measure Hα, we first measured the total Hα + [N II] flux from the prism. For five objects in our sample, we detect [N II] in the corresponding medium-resolution spectra (S/N > 3). For these objects we multiplied the total low-resolution Hα + [N II] flux by the medium-resolution corrective factor: Hα/(Hα + [N II]). For the remaining objects, we used a constant correction of Hα/(Hα + [N II]) = 0.96 determined from the stack of all z > 4 medium-resolution spectra.
From our sample of 58 galaxies (4 < z < 7), we removed seven objects with Hβ S/N < 3. Of these seven, three also have an Hα S/N < 3; one has a ‘blocky’, asymmetric Hα profile (probably resulting from a noise spike not reflected in the noise array); and for the remaining three, we are able to calculate 3σ lower limits to Hα/Hβ. Our final sample then consists of 51 galaxies, for which the Balmer decrement is measured as the ratio between Hα and Hβ. Of these targets, 43 also have medium-resolution spectroscopy from the gratings.
2.4. Stellar mass and star formation rate measurements
Stellar masses (M⋆) and star formation rates (SFRs) were obtained again from PPXF, but using a separate, continuum-focused pipeline. The procedure is described in detail in Looser et al. (2023); here we report only a brief summary. As input we used the same C3K/MIST SSP library, with a logarithmic grid of ages spanning between 106 yr and the age of the Universe at the redshift of the target. The effect of dust was modelled using the Calzetti law (Calzetti et al. 2000). The star formation history (SFH) was reconstructed using a combination of low regularisation and wild bootstrapping, following the approach of Looser et al. (2023). Stellar masses are defined as the total mass formed, by integrating the SFH. The SFR is measured as the time-averaged SFH over the last 10 Myr. This value is derived purely from the rest-frame UV stellar continuum (i.e. nebular emission is marginalised over), but Looser et al. (2023) show these measurements trace the SFR derived combining Hα and the Balmer decrement from medium-resolution spectroscopy (Curti et al. 2024), with a scatter of 0.4 dex and an offset of −0.1 dex. Assuming measurement uncertainties are equal between the Hα- and continuum-based SFRs, we obtain a median uncertainty of 0.3 dex on the SFR (Looser et al. 2023, their Fig. 7). The overall agreement is not surprising, given that SFRs estimated from nebular emission and from the UV continuum also tend to agree (e.g. Davies et al. 2016). Interestingly, the scatter with respect to the Hα-inferred SFRs decreases when moving from PPXF-inferred SFRs estimated over 100 Myr to the estimates over 10 Myr (Looser et al. 2023, their Fig. 7). This fact suggests that – in the particular conditions of low M⋆ and low nebular attenuation found in our sample – PPXF is able to use information from the rest-frame UV spectrum to infer the fraction of stars with ages ≲10 Myr.
To assess the quality of our M⋆ measurements, we compared the PPXF-inferred estimates to the values obtained using BEAGLE (Chevallard & Charlot 2016; Chevallard et al., in prep.). Looser et al. (2023) find good agreement, with a median uncertainty on M⋆ of 0.2 dex (Looser et al. 2023, their Fig. B.1). Crucially, the PPXF-derived SFRs are not directly coupled with the Balmer decrement (even though we cannot rule out a small correlation due to stellar absorption); therefore, we can study the relation between these two galaxy observables with negligible correlated noise, compared to the Hα-derived SFR.
3. Results
In Fig. 2 we show the Balmer decrement as a function of redshift. Circles represent individual galaxies, colour-coded by the S/N of the Hα emission line. The error bars combine the random measurement uncertainties on the line fluxes as well as a systematic uncertainty of 10% due to flux calibration; grey triangles are 3σ upper limits. The horizontal dashed line traces the intrinsic (unattenuated) Hα/Hβ ratio of 2.86, appropriate for Case B recombination, temperature Te = 10 000 K and density ne = 100 cm−3 (e.g. Osterbrock & Ferland 2006). Changing these assumptions within the range typical for star-forming regions (5000 < Te < 30 000 K and 10 < ne < 500 cm−3) changes the Balmer decrement by 5−6%.
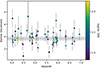 |
Fig. 2. Balmer decrement, Hα/Hβ, plotted against redshift for our sample of 51 galaxies. The points are colour-coded by their corresponding Hα S/N. The error bars combine the random measurement uncertainties on the line fluxes with a systematic uncertainty of 10%. Three lower limits are shown as grey triangles. The horizontal dashed grey line corresponds to a Balmer decrement of 2.86, appropriate for local star-forming regions. The grey shaded region represents the 6% range of Hα/Hβ, corresponding to 5000 < Te < 30 000 K and 10 < ne < 500 cm−3. The horizontal dotted grey line corresponds to a Balmer decrement of 2.75. |
The distribution of measured Balmer decrements is highly scattered, also reaching values below the Case B limit of 2.86. However, within the uncertainties, almost all galaxies below the dashed horizontal line are consistent with a Balmer decrement of 2.86 or higher. The exception are the two galaxies with the lowest Balmer decrements, which have values clearly deviating from the common assumptions valid in local star-forming regions (≳2σ below the unattenuated value of 2.86). We note, however, that these two galaxies are also the ones with the lowest Hα S/N (as highlighted by the colour coding in Fig. 2), suggesting that the low ratio is due to contamination of Hβ and their uncertainties may be underestimated. Alternatively, these galaxies could be ‘anomalous Balmer emitters’ (i.e. galaxies with density-bounded photoionisation regions), which results in intrinsic Balmer ratios different from the Case B assumption above (McClymont et al. 2024).
We do not find a clear correlation with redshift, suggesting that the dust content of galaxies does not evolve significantly between the end of reionisation at z = 7 − 6 and the epoch immediately before cosmic noon (z = 4). The dust properties likely do not evolve either (which is consistent with recent findings based on the far-IR/sub-millimetre properties of galaxies in this redshift range; Witstok et al. 2023a). However, the sample selection criteria prevent us from drawing general conclusions about evolution.
In the left panel of Fig. 3 we study the Balmer decrement as a function of M⋆. We detect a statistically significant Spearman’s rank correlation (r = 0.32, p < 0.05; traced by the moving mean, horizontal red lines in Fig. 3), as already found at lower redshifts (e.g. Groves et al. 2012; Shivaei et al. 2015, 2020; Maheson et al. 2023). We note, however, that the average Balmer decrement is very low – particularly so at the low-mass end. For stellar masses M⋆ < 3 × 10⁷ M⊙ we find a median decrement of 2.88 ± 0.08, very close to the unattenuated value of 2.86 and therefore leaving little room for any dust attenuation. The three lower limits are not constraining (i.e. they are consistent with any amount of dust). This underscores that – with the depth of JADES – we do not miss significant numbers of highly obscured objects due to quality selection cuts.
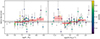 |
Fig. 3. Balmer decrement, Hα/Hβ, as a function of M⋆ (left panel) and SFR (right panel), both derived from the stellar continuum. Circles represent individual galaxies, colour-coded by their spectroscopic redshift. Three lower limits are shown on each panel as grey triangles. The median uncertainties on the M⋆ and SFR are 0.2 and 0.3 dex, respectively. The horizontal dashed grey line corresponds to a Balmer decrement of 2.86, appropriate for local star-forming regions. The grey shaded region represents the 6% range of Hα/Hβ, corresponding to 5000 < Te < 30 000 K and 10 < ne < 500 cm−3. The horizontal dotted grey line corresponds to a Balmer decrement of 2.75. The horizontal red lines and shaded regions represent the running mean and error on the mean. The Balmer decrement shows a statistically significant correlation with M⋆. For the SFR, we find an increasing trend from log(SFR/M⋆ yr−1) > − 0.5 dex. Because we measure both the M⋆ and SFR from PPXF (Sect. 2.4), the Hα and Hβ emission lines do not enter these two measurements, meaning the observed correlations with the Balmer decrement are not due to correlated noise. |
In the right panel of Fig. 3 we study the Balmer decrement as a function of the continuum-inferred SFR, averaged over the last 10 Myr. The symbols and colours are the same as in the left panel. In this case, we do not find a statistically significant Spearman’s rank correlation (r = 0.18, p > 0.05). However, we do find a correlation for galaxies with log(SFR/M⋆ yr−1) > − 0.5 dex (r = 0.48 and p = 0.001). We note that this result is not driven by the high-SFR outliers: removing also galaxies with log(SFR/M⋆ yr−1) > 1 dex we obtain r = 0.44 and p = 0.004.
At this stage, we cannot say whether the Balmer decrement correlates more tightly with the M⋆ or with the SFR. A comparison of the PPXF-derived stellar masses to their BEAGLE-inferred equivalents suggests a mean uncertainty of 0.2 dex (accounting for both random noise and systematics due to different SFH assumptions; e.g. Carnall et al. 2019; Leja et al. 2019; Sandles et al. 2022). For the SFR, a comparison between PPXF and the Hα derived values suggests a scatter of 0.4 dex. If we assume that the SFR from PPXF accurately traces the SFR on 10 Myr timescales, then the measurement uncertainties on the SFR are larger than on M⋆. This would make the intrinsic correlation between the Balmer decrement and SFR stronger (i.e. higher correlation coefficient) and more significant than the correlation between the Balmer decrement and M⋆. More data and a better characterisation of the systematic uncertainties could help address which of these two correlations is stronger.
4. Discussion
Empowered by the combination of the exquisite sensitivity of JWST/NIRSpec with the unprecedented depth of JADES, we can probe for the first time the low-mass end of the galaxy distribution beyond cosmic noon, with tens of galaxies in the range 107 − 108 M⊙. In this mass regime, we find no evidence of high-attenuation galaxies, consistent with the overall trend of an increasing Balmer decrement with increasing M⋆, already reported by numerous authors for the local Universe (Groves et al. 2012), cosmic noon (Domínguez et al. 2013; Reddy et al. 2015; Nelson et al. 2016; Lorenz et al. 2023; Matharu et al. 2023), and redshifts 3 − 6 (Shapley et al. 2023). The lack of objects with significant nebular attenuation is also confirmed by the lack of constraining lower limits. Part of the reason we find no galaxies with a high Balmer decrement could be due to sample bias, because our primary targets were selected to be UV-bright objects with strong Lyα drops Bunker et al. (2024). However, secondary targets are not selected to be as UV bright; therefore, selection criteria alone may be insufficient to explain the observed dearth of galaxies with a high Balmer decrement. Indeed, our results are consistent with the shallower measurements from CEERS. In the sample of Shapley et al. (2023), there are six galaxies with 5 < z < 6 and M⋆ < 108 M⊙; of these, two imply Balmer decrements larger than 3. The only measurement with a Balmer decrement uncertainty smaller than 1 is fully consistent with our median Balmer decrement in the same mass range.
These findings suggest that, similar to the low-redshift Universe, even in the young Universe before cosmic noon, more massive galaxies produced more dust and/or could retain more dust. As discussed in Maheson et al. (2023), this might be partly due to the mass-metallicity relation (and the fact that dust content scales with metallicity). Retention of dust due to the gravitational potential seems to also play a role in the mass dependence. However, in addition to these two secondary correlations, dust attenuation is also found to have an intrinsic dependence on stellar mass. This is likely a consequence of the direct correlation between stellar mass and gas mass (Lin et al. 2019; Baker et al. 2023). At the high redshifts of our sample, disentangling the dependences on these individual parameters requires more statistics than currently available (the multi-parameter dependences found in local galaxies by Maheson et al. 2023 required a sample of thousands of galaxies).
Interestingly, we find evidence of extremely low Balmer decrements at the low-mass end (2.88 ± 0.08 for M⋆ < 3 × 10⁷ M⊙). With the physical conditions of local star-forming regions (i.e. Te = 10 000 K and ne = 100 cm−3), the intrinsic Balmer decrement is 2.86. This means our measurement leaves little or no room for any interstellar medium (ISM) dust towards the H II regions (although dust might be present inside H II regions, while absorbing UV photons; Charlot et al. 2002). For example, assuming the Milky Way extinction law with RV = 3.1 (Cardelli et al. 1989, hereafter, CCM89) and an intrinsic Hα/Hβ ratio of 2.86, the observed Balmer decrement yields AV = 0.02 mag, meaning very little dust is present. This is a finding that was also inferred by the blue slopes of the spectra of galaxies at such high redshifts (Fiore et al. 2023) and is in agreement with current theoretical models (which predict a drop of the dust-to-stellar mass ratio by a factor of 2 between z = 0 and z = 4 − 7; Popping et al. 2017).
However, other studies have found evidence for some dust attenuation at such high redshifts in low-mass galaxies, for example through the detection of the UV carbonaceous dust absorption dip (Markov et al. 2023; Witstok et al. 2023b) and through spectral energy distribution modelling (e.g. Tacchella et al. 2023, although these authors explore a mass at least 2 − 3 times larger than here).
An interesting possibility is that the low Balmer decrement might be associated with ‘non-standard’ physical conditions in the ISM. In fact, our findings would be consistent with the hypothesis that at z = 4 − 7, star-forming gas in low-mass galaxies had higher Te (Schaerer et al. 2022; Curti et al. 2023) and/or higher ne (Reddy et al. 2023). Qualitatively, this is consistent with lower metallicity stars being the primary source of photoionisation, and with the prediction of higher gas densities from numerical simulations (e.g. Ceverino et al. 2018; Lovell et al. 2022). For example, assuming Te = 20 000 K and ne = 300 cm−3, the intrinsic Hα/Hβ ratio drops to 2.75. However, comparing this value to the observed decrement of 2.88, the CCM89 law gives AV = 0.14 mag – still indicating the presence of only a modest amount of dust.
In any case – at the low-mass end – there seems to be very little room for interstellar dust, even taking into account the possible effect of the extreme gas conditions, which might lower the intrinsic Balmer decrement. Part of the difference compared to higher-mass galaxies is the lower metallicity. Several authors (Curti et al. 2024; Nakajima et al. 2023) report the mass-metallicity relation is already in place at z > 4 – albeit with a large intrinsic scatter. A lower ISM metallicity implies lower dust content in the ISM (especially taking into account that the dust-to-gas ratio drops more than linearly at low metallicities; De Cia 2018). In addition, low-mass galaxies could also be more efficient at removing dust. Numerical simulations (Ceverino et al. 2018; Ma et al. 2018; Lovell et al. 2022; Dome et al. 2023) predict that galaxies with stellar masses M⋆ ≲ 0.5 − 5 × 10⁸ M⊙ have ‘burstier’ SFHs; their SFR varies rapidly on timescales of 10 Myr, modulated by rapid gas accretion and efficient star formation. This phase is accompanied by gas depletion and strong, efficient feedback that removes any leftover gas (see also the discussion in Fiore et al. 2023). Burstier SFHs at low mass and high redshifts seem confirmed by a comparison between the SFRs averaged over 0–10 and 10–90 Myr (Looser et al. 2023, but see Rezaee et al. 2022 for a different view); our work presents a consistent picture from the point of view of the ISM attenuation. Finally, in terms of dust production timescales, the low dust content may also reflect the fact that low-mass galaxies are younger (Looser et al. 2023) and hence have had less time to produce dust through the asymptotic giant branch channel (whereas dust production from supernovae acts on very short timescales).
Regarding the possible correlation of the Balmer decrement with the SFR, we note that the lower metallicity and the burstiness of the SFH require a different calibration of the Hα-based SFR indicator, as already recognised by several authors (e.g. Hao et al. 2011; Reddy et al. 2018; Shivaei et al. 2022; Tacchella et al. 2022; Curti et al. 2024; Shapley et al. 2023). Metallicity enters the SFR calibrators through the production rate of hydrogen-ionising photons. Using a solar-metallicity calibrator in a low-metallicity galaxy leads to an overestimate of the SFR by a factor of 2–3. The burstiness of the SFH implies that the often adopted standard linear relation between the Hα luminosity and the SFR, which assumes a constant SFR, cannot be really applied. Additionally, the SFR inferred from Hα cannot be used for exploring the relation with the Balmer decrement because the Hα flux would enter in both quantities and introduce spurious correlations.
Therefore, we made use of the continuum-based SFR from PPXF to quantify the correlation between the Balmer decrement and the SFR (right panel of Fig. 3) and compared it to the well-known correlation with M⋆ (left panel Fig. 3). The correlation with M⋆ is statistically significant, while for the SFR we find a correlation only for SFR > 0.3 M⊙ yr−1. We are unable to determine if, for these distant galaxies, any of the two is a secondary correlation, as inferred for local galaxies (Maheson et al. 2023). In fact, because of the star-forming main sequence (i.e. the empirical correlation between the M⋆ and SFR), it is unclear if and to what extent the correlation between the Balmer decrement and the SFR reflects the combination of the known correlation between the Balmer decrement and M⋆ (e.g. Groves et al. 2012; Maheson et al. 2023), and the star-forming main sequence. A larger sample would enable a comparative analysis using partial correlation coefficients (e.g. Bait et al. 2017; Bluck et al. 2019) or even a machine-learning analysis (e.g. Bluck et al. 2022; Piotrowska et al. 2022).
Intriguingly, the relation between the Balmer decrement and the SFR may be tighter than the relation with M⋆ (except the set of outliers with high Balmer decrements and very low SFRs, 0.1–0.3 M⊙ yr−1). A primary correlation with the SFR would also be consistent – at least in a qualitative sense – with the picture of bursty SFHs from numerical simulations. Starbursts in low-mass galaxies are fuelled by short-lived reservoirs of dense gas. The burst phase ends as a consequence of the gas being exhausted and/or expelled; therefore, low-SFR galaxies would correspond to gas-poor systems observed in a ‘lull’ of their star formation.
The Balmer decrement intrinsically scaling with the SFR would also be consistent with other scaling relations observed in the local Universe. Specifically, the dust content scales with the amount of cold gas, via the dust-to-gas ratio. On the other hand, the SFR correlates with the amount of cold gas via the Kennicutt-Schmidt relation. Therefore, a correlation between the Balmer decrement and the SFR is not unexpected. In fact, in local galaxies the Balmer decrement correlates with the surface density of molecular gas (Barrera-Ballesteros et al. 2018; Piotrowska et al. 2020).
Other works (Maheson et al. 2023) have argued that – after controlling for inclination – the correlation between the SFR and the Balmer decrement is less important than the correlation of the Balmer decrement with M⋆ and other physical quantities (ISM metallicity and gas velocity dispersion). However, they are unable to compare the Balmer decrement to the SFR on timescales of 10 Myr – simply because the classic Hα-based estimator uses the Balmer decrement itself in its definition. Instead, they used the 4000-Å break as a proxy for the current SFR. However, the 4000-Å break is sensitive to the SFR on longer timescales of 100 Myr, so their different results could also be due to different timescales being probed. In any case, their much more detailed analysis is impossible with our sample size of only 51 galaxies, but requires samples 10–100 times larger that do not exist yet for the redshift range we are interested in.
A possible caveat is represented by the effect of different morphologies and inclination. We did not make any morphology cut and assumed that our sample probes all morphologies and inclinations equally. Larger samples may help clarify the role of morphology and inclination in our findings.
5. Summary and conclusions
In this work we have presented a comparative analysis of the Balmer decrement for galaxies with M⋆ = 107 − 109 M⊙ between cosmic noon and the end of reionisation (4 < z < 7). We used deep (28 hours), low-spectral-resolution observations of JWST/NIRSpec MSA, obtained as part of JADES. We used medium-resolution observations to apply a correction for [N II] contamination of Hα. We further explored the dependence on the SFR, averaged over the last 10 Myr, as measured from the stellar continuum – without using information from the emission lines.
We confirm earlier findings of a correlation between the Balmer decrement (i.e. dust attenuation) and M⋆ already in place at such early epochs.
At the low-mass end (M⋆ < 3 × 10⁷ M⊙), there is little evidence of any dust attenuation, in agreement with theoretical expectations (Popping et al. 2017). This result is consistent with the expectation inferred from the fact that these systems are metal poor, young (hence with less time for dust formation), and with bursty SFHs (which may be more effective in depleting and expelling dust). In this mass range, the median Balmer decrement is only 2.88 ± 0.08, extremely close to 2.86 (the Case B value commonly assumed for star-forming regions at lower redshifts). This suggests that low-mass galaxies at these redshifts might have higher Te and/or ne compared to their local counterparts, which would result in a slightly lower intrinsic Balmer decrement.
We find tentative evidence of a correlation between the Balmer decrement and the SFR. If confirmed, this may trace the underlying correlation between the SFR and the cold gas mass, via the dust-to-gas ratio.
Future studies based on larger samples may clarify which of these correlations are intrinsic and direct, and which ones are an indirect byproduct of secondary correlations. Larger samples will also allow us to uncover correlations with other galaxy parameters, such as metallicity and velocity dispersion (Maheson et al. 2023).
Acknowledgments
LS, FDE, RM, TJL, WMB, MC, JS and JW acknowledge support by the Science and Technology Facilities Council (STFC) and ERC Advanced Grant 695671 “QUENCH” and by the UKRI Frontier Research grant RISEandFALL. RM also acknowledges funding from a research professorship from the Royal Society. SA and BRP acknowledge support from the research project PID2021-127718NB-I00 of the Spanish Ministry of Science and Innovation/State Agency of Research (MICIN/AEI/10.13039/501100011033). NB, DJE, BDJ, FS, and CNAW are supported by JWST/NIRCam contract to the University of Arizona NAS5-02015. SC acknowledges support by European Union’s HE ERC Starting Grant No. 101040227 – WINGS. AJB, AJC, JC & GCJ acknowledge funding from the “FirstGalaxies” Advanced Grant from the European Research Council (ERC) under the European Union’s Horizon 2020 research and innovation programme (Grant agreement No. 789056). ECL acknowledges support of an STFC Webb Fellowship (ST/W001438/1). DJE is also supported as a Simons Investigator. BER acknowledges support from the NIRCam Science Team contract to the University of Arizona, NAS5-02015, and JWST Program 3215. RS acknowledges support from a STFC Ernest Rutherford Fellowship (ST/S004831/1). ST acknowledges support by the Royal Society Research Grant G125142. HÜ gratefully acknowledges support by the Isaac Newton Trust and by the Kavli Foundation through a Newton-Kavli Junior Fellowship. The research of CCW is supported by NOIRLab, which is managed by the Association of Universities for Research in Astronomy (AURA) under a cooperative agreement with the National Science Foundation.
References
- Bait, O., Barway, S., & Wadadekar, Y. 2017, MNRAS, 471, 2687 [NASA ADS] [CrossRef] [Google Scholar]
- Baker, W. M., Maiolino, R., Belfiore, F., et al. 2023, MNRAS, 518, 4767 [Google Scholar]
- Barrera-Ballesteros, J. K., Heckman, T., Sánchez, S. F., et al. 2018, ApJ, 852, 74 [Google Scholar]
- Bluck, A. F. L., Bottrell, C., Teimoorinia, H., et al. 2019, MNRAS, 485, 666 [Google Scholar]
- Bluck, A. F. L., Maiolino, R., Brownson, S., et al. 2022, A&A, 659, A160 [NASA ADS] [CrossRef] [EDP Sciences] [Google Scholar]
- Bunker, A. J., Cameron, A. J., Curtis-Lake, E., et al. 2024, A&A, 690, A288 [NASA ADS] [CrossRef] [EDP Sciences] [Google Scholar]
- Calzetti, D., Kinney, A. L., & Storchi-Bergmann, T. 1994, ApJ, 429, 582 [Google Scholar]
- Calzetti, D., Armus, L., Bohlin, R. C., et al. 2000, ApJ, 533, 682 [NASA ADS] [CrossRef] [Google Scholar]
- Cameron, A. J., Saxena, A., Bunker, A. J., et al. 2023, A&A, 677, A115 [NASA ADS] [CrossRef] [EDP Sciences] [Google Scholar]
- Cappellari, M. 2017, MNRAS, 466, 798 [Google Scholar]
- Cappellari, M. 2022, ArXiv e-prints [arXiv:2208.14974] [Google Scholar]
- Cardelli, J. A., Clayton, G. C., & Mathis, J. S. 1989, ApJ, 345, 245 [Google Scholar]
- Carnall, A. C., McLure, R. J., Dunlop, J. S., & Davé, R. 2018, MNRAS, 480, 4379 [Google Scholar]
- Carnall, A. C., Leja, J., Johnson, B. D., et al. 2019, ApJ, 873, 44 [Google Scholar]
- Ceverino, D., Klessen, R. S., & Glover, S. C. O. 2018, MNRAS, 480, 4842 [NASA ADS] [Google Scholar]
- Chabrier, G. 2003, PASP, 115, 763 [Google Scholar]
- Charlot, S., Kauffmann, G., Longhetti, M., et al. 2002, MNRAS, 330, 876 [NASA ADS] [CrossRef] [Google Scholar]
- Chevallard, J., & Charlot, S. 2016, MNRAS, 462, 1415 [NASA ADS] [CrossRef] [Google Scholar]
- Choi, J., Dotter, A., Conroy, C., et al. 2016, ApJ, 823, 102 [Google Scholar]
- Conroy, C., Naidu, R. P., Zaritsky, D., et al. 2019, ApJ, 887, 237 [NASA ADS] [CrossRef] [Google Scholar]
- Curti, M., Maiolino, R., Cirasuolo, M., et al. 2020, MNRAS, 492, 821 [CrossRef] [Google Scholar]
- Curti, M., D’Eugenio, F., Carniani, S., et al. 2023, MNRAS, 518, 425 [Google Scholar]
- Curti, M., Maiolino, R., Curtis-Lake, E., et al. 2024, A&A, 684, A75 [NASA ADS] [CrossRef] [EDP Sciences] [Google Scholar]
- Curtis-Lake, E., Carniani, S., Cameron, A., et al. 2023, Nat. Astron., 7, 622 [NASA ADS] [CrossRef] [Google Scholar]
- Davies, L. J. M., Driver, S. P., Robotham, A. S. G., et al. 2016, MNRAS, 461, 458 [NASA ADS] [CrossRef] [Google Scholar]
- De Cia, A. 2018, A&A, 613, L2 [NASA ADS] [CrossRef] [EDP Sciences] [Google Scholar]
- Dome, T., Tacchella, S., Fialkov, A., et al. 2023, ArXiv e-prints [arXiv:2305.07066] [Google Scholar]
- Domínguez, A., Siana, B., Henry, A. L., et al. 2013, ApJ, 763, 145 [CrossRef] [Google Scholar]
- Dotter, A. 2016, ApJS, 222, 8 [Google Scholar]
- Eisenstein, D. J., Willott, C., Alberts, S., et al. 2023, ArXiv e-prints [arXiv:2306.02465] [Google Scholar]
- Finkelstein, S. L., Bagley, M. B., Ferguson, H. C., et al. 2023, ApJ, 946, L13 [NASA ADS] [CrossRef] [Google Scholar]
- Fiore, F., Ferrara, A., Bischetti, M., Feruglio, C., & Travascio, A. 2023, ApJ, 943, L27 [NASA ADS] [CrossRef] [Google Scholar]
- Flores Velázquez, J. A., Gurvich, A. B., Faucher-Giguère, C.-A., et al. 2021, MNRAS, 501, 4812 [CrossRef] [Google Scholar]
- Galliano, F., Galametz, M., & Jones, A. P. 2018, ARA&A, 56, 673 [Google Scholar]
- Gardner, J. P., Mather, J. C., Abbott, R., et al. 2023, ArXiv e-prints [arXiv:2304.04869] [Google Scholar]
- Giavalisco, M., Ferguson, H. C., Koekemoer, A. M., et al. 2004, ApJ, 600, L93 [NASA ADS] [CrossRef] [Google Scholar]
- Groves, B., Brinchmann, J., & Walcher, C. J. 2012, MNRAS, 419, 1402 [NASA ADS] [CrossRef] [Google Scholar]
- Hao, C.-N., Kennicutt, R. C., Johnson, B. D., et al. 2011, ApJ, 741, 124 [Google Scholar]
- Jakobsen, P., Ferruit, P., Alves de Oliveira, C., et al. 2022, A&A, 661, A80 [NASA ADS] [CrossRef] [EDP Sciences] [Google Scholar]
- Kriek, M., Shapley, A. E., Reddy, N. A., et al. 2015, ApJS, 218, 15 [NASA ADS] [CrossRef] [Google Scholar]
- Laporte, N., Ellis, R. S., Boone, F., et al. 2017, ApJ, 837, L21 [CrossRef] [Google Scholar]
- Leja, J., Carnall, A. C., Johnson, B. D., Conroy, C., & Speagle, J. S. 2019, ApJ, 876, 3 [Google Scholar]
- Lin, L., Pan, H.-A., Ellison, S. L., et al. 2019, ApJ, 884, L33 [NASA ADS] [CrossRef] [Google Scholar]
- Looser, T. J., D’Eugenio, F., Maiolino, R., et al. 2023, A&A, submitted [arXiv:2306.02470] [Google Scholar]
- Lorenz, B., Kriek, M., Shapley, A. E., et al. 2023, ArXiv e-prints [arXiv:2304.08521] [Google Scholar]
- Lovell, C. C., Roper, W., Vijayan, A. P., et al. 2022, ArXiv e-prints [arXiv:2211.07540] [Google Scholar]
- Ma, X., Hopkins, P. F., Garrison-Kimmel, S., et al. 2018, MNRAS, 478, 1694 [NASA ADS] [CrossRef] [Google Scholar]
- Maheson, G., Maiolino, R., Curti, M., et al. 2023, ArXiv e-prints [arXiv:2306.00069] [Google Scholar]
- Markov, V., Gallerani, S., Pallottini, A., et al. 2023, ArXiv e-prints [arXiv:2304.11178] [Google Scholar]
- Matharu, J., Muzzin, A., Sarrouh, G. T. E., et al. 2023, ApJ, 949, L11 [NASA ADS] [CrossRef] [Google Scholar]
- McClymont, W., Tacchella, S., D’Eugenio, F., et al. 2024, ArXiv e-prints [arXiv:2405.15859] [Google Scholar]
- Nakajima, K., Ouchi, M., Isobe, Y., et al. 2023, ArXiv e-prints [arXiv:2301.12825] [Google Scholar]
- Nelson, E. J., van Dokkum, P. G., Momcheva, I. G., et al. 2016, ApJ, 817, L9 [CrossRef] [Google Scholar]
- Osterbrock, D. E., & Ferland, G. J. 2006, Astrophysics of Gaseous Nebulae and Active Galactic Nuclei (Sausalito: University Science Books) [Google Scholar]
- Piotrowska, J. M., Bluck, A. F. L., Maiolino, R., Concas, A., & Peng, Y. 2020, MNRAS, 492, L6 [Google Scholar]
- Piotrowska, J. M., Bluck, A. F. L., Maiolino, R., & Peng, Y. 2022, MNRAS, 512, 1052 [NASA ADS] [CrossRef] [Google Scholar]
- Popping, G., Somerville, R. S., & Galametz, M. 2017, MNRAS, 471, 3152 [NASA ADS] [CrossRef] [Google Scholar]
- Reddy, N. A., Kriek, M., Shapley, A. E., et al. 2015, ApJ, 806, 259 [NASA ADS] [CrossRef] [Google Scholar]
- Reddy, N. A., Oesch, P. A., Bouwens, R. J., et al. 2018, ApJ, 853, 56 [NASA ADS] [CrossRef] [Google Scholar]
- Reddy, N. A., Topping, M. W., Sanders, R. L., Shapley, A. E., & Brammer, G. 2023, ArXiv e-prints [arXiv:2303.11397] [Google Scholar]
- Rezaee, S., Reddy, N. A., Topping, M. W., et al. 2022, ArXiv e-prints [arXiv:2208.12371] [Google Scholar]
- Salim, S., & Narayanan, D. 2020, ARA&A, 58, 529 [NASA ADS] [CrossRef] [Google Scholar]
- Sandles, L., Curtis-Lake, E., Charlot, S., Chevallard, J., & Maiolino, R. 2022, MNRAS, 515, 2951 [NASA ADS] [CrossRef] [Google Scholar]
- Schaerer, D., Marques-Chaves, R., Barrufet, L., et al. 2022, A&A, 665, L4 [NASA ADS] [CrossRef] [EDP Sciences] [Google Scholar]
- Shapley, A. E., Sanders, R. L., Reddy, N. A., Topping, M. W., & Brammer, G. B. 2023, ArXiv e-prints [arXiv:2301.03241] [Google Scholar]
- Shivaei, I., Reddy, N. A., Shapley, A. E., et al. 2015, ApJ, 815, 98 [NASA ADS] [CrossRef] [Google Scholar]
- Shivaei, I., Reddy, N., Rieke, G., et al. 2020, ApJ, 899, 117 [NASA ADS] [CrossRef] [Google Scholar]
- Shivaei, I., Popping, G., Rieke, G., et al. 2022, ApJ, 928, 68 [NASA ADS] [CrossRef] [Google Scholar]
- Smith, A., Kannan, R., Tacchella, S., et al. 2022, MNRAS, 517, 1 [NASA ADS] [CrossRef] [Google Scholar]
- Tacchella, S., Smith, A., Kannan, R., et al. 2022, MNRAS, 513, 2904 [NASA ADS] [CrossRef] [Google Scholar]
- Tacchella, S., Johnson, B. D., Robertson, B. E., et al. 2023, MNRAS, 522, 6236 [NASA ADS] [CrossRef] [Google Scholar]
- Watson, D., Christensen, L., Knudsen, K. K., et al. 2015, Nature, 519, 327 [Google Scholar]
- Witstok, J., Smit, R., Maiolino, R., et al. 2022, MNRAS, 515, 1751 [Google Scholar]
- Witstok, J., Jones, G. C., Maiolino, R., Smit, R., & Schneider, R. 2023a, MNRAS, 523, 3119 [NASA ADS] [CrossRef] [Google Scholar]
- Witstok, J., Shivaei, I., Smit, R., et al. 2023b, ArXiv e-prints [arXiv:2302.05468] [Google Scholar]
All Figures
|
Fig. 1. NIRSpec low-resolution spectrum of JADES-GS+53.16904–27.77884 with a redshift of z = 6.6. Top: 2D spectrum colour-coded by the S/N. Bottom: Extracted 1D flux density versus observed wavelength. |
| In the text | |
|
Fig. 2. Balmer decrement, Hα/Hβ, plotted against redshift for our sample of 51 galaxies. The points are colour-coded by their corresponding Hα S/N. The error bars combine the random measurement uncertainties on the line fluxes with a systematic uncertainty of 10%. Three lower limits are shown as grey triangles. The horizontal dashed grey line corresponds to a Balmer decrement of 2.86, appropriate for local star-forming regions. The grey shaded region represents the 6% range of Hα/Hβ, corresponding to 5000 < Te < 30 000 K and 10 < ne < 500 cm−3. The horizontal dotted grey line corresponds to a Balmer decrement of 2.75. |
| In the text | |
|
Fig. 3. Balmer decrement, Hα/Hβ, as a function of M⋆ (left panel) and SFR (right panel), both derived from the stellar continuum. Circles represent individual galaxies, colour-coded by their spectroscopic redshift. Three lower limits are shown on each panel as grey triangles. The median uncertainties on the M⋆ and SFR are 0.2 and 0.3 dex, respectively. The horizontal dashed grey line corresponds to a Balmer decrement of 2.86, appropriate for local star-forming regions. The grey shaded region represents the 6% range of Hα/Hβ, corresponding to 5000 < Te < 30 000 K and 10 < ne < 500 cm−3. The horizontal dotted grey line corresponds to a Balmer decrement of 2.75. The horizontal red lines and shaded regions represent the running mean and error on the mean. The Balmer decrement shows a statistically significant correlation with M⋆. For the SFR, we find an increasing trend from log(SFR/M⋆ yr−1) > − 0.5 dex. Because we measure both the M⋆ and SFR from PPXF (Sect. 2.4), the Hα and Hβ emission lines do not enter these two measurements, meaning the observed correlations with the Balmer decrement are not due to correlated noise. |
| In the text | |
Current usage metrics show cumulative count of Article Views (full-text article views including HTML views, PDF and ePub downloads, according to the available data) and Abstracts Views on Vision4Press platform.
Data correspond to usage on the plateform after 2015. The current usage metrics is available 48-96 hours after online publication and is updated daily on week days.
Initial download of the metrics may take a while.