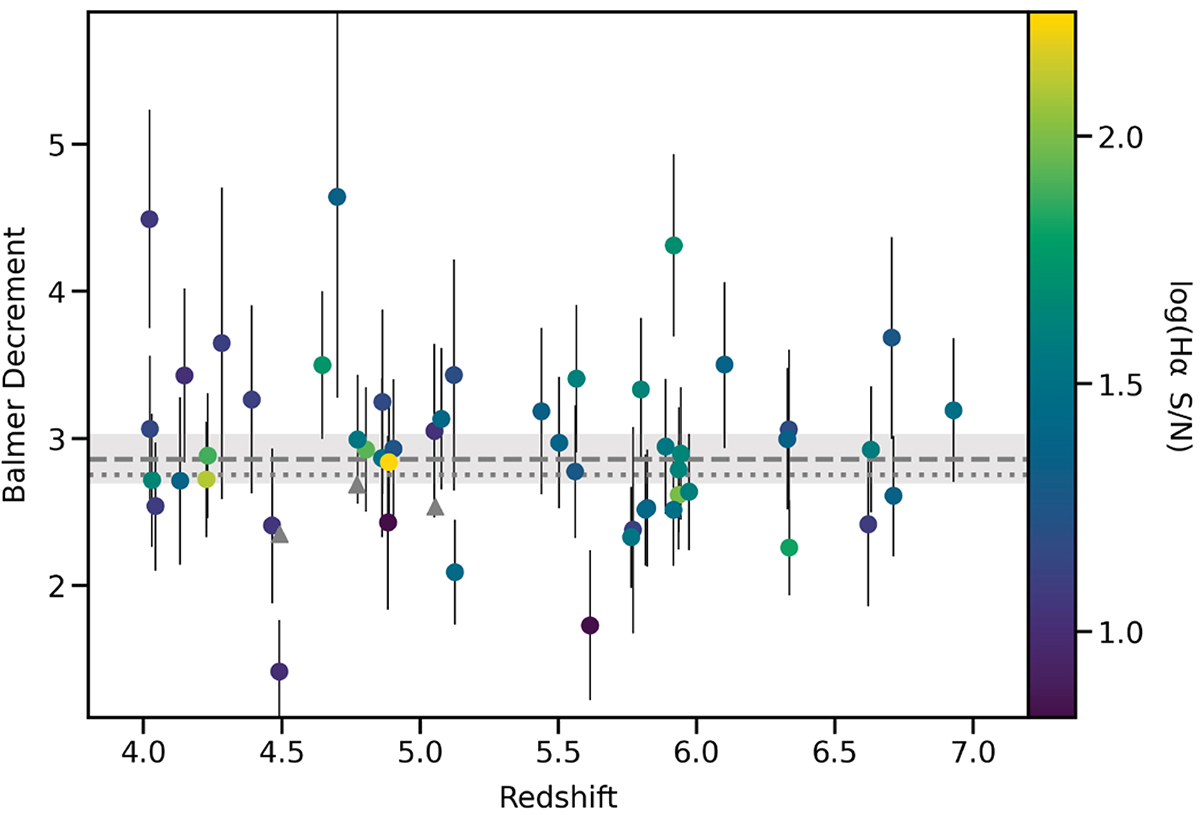
Fig. 2.
Download original image
Balmer decrement, Hα/Hβ, plotted against redshift for our sample of 51 galaxies. The points are colour-coded by their corresponding Hα S/N. The error bars combine the random measurement uncertainties on the line fluxes with a systematic uncertainty of 10%. Three lower limits are shown as grey triangles. The horizontal dashed grey line corresponds to a Balmer decrement of 2.86, appropriate for local star-forming regions. The grey shaded region represents the 6% range of Hα/Hβ, corresponding to 5000 < Te < 30 000 K and 10 < ne < 500 cm−3. The horizontal dotted grey line corresponds to a Balmer decrement of 2.75.
Current usage metrics show cumulative count of Article Views (full-text article views including HTML views, PDF and ePub downloads, according to the available data) and Abstracts Views on Vision4Press platform.
Data correspond to usage on the plateform after 2015. The current usage metrics is available 48-96 hours after online publication and is updated daily on week days.
Initial download of the metrics may take a while.