Fig. 3.
Download original image
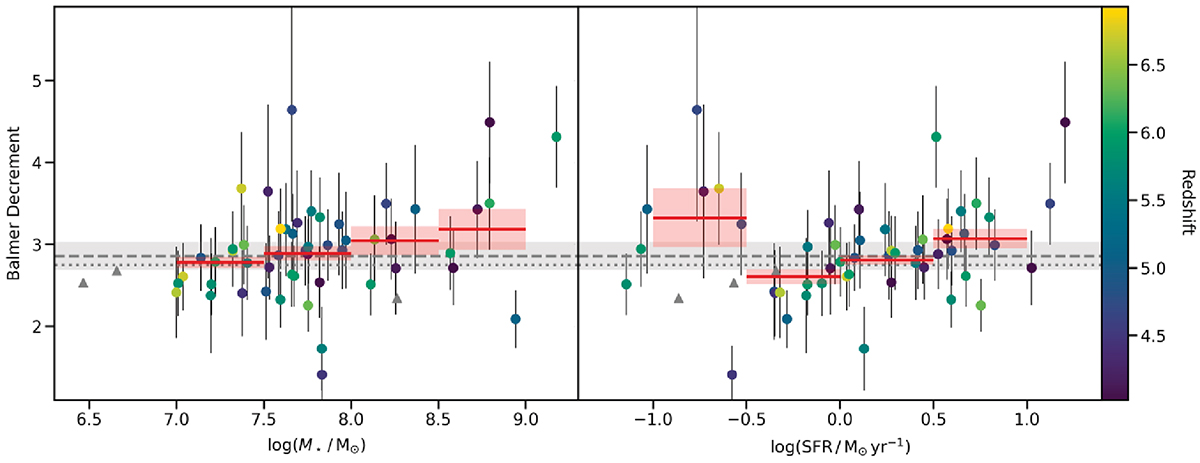
Balmer decrement, Hα/Hβ, as a function of M⋆ (left panel) and SFR (right panel), both derived from the stellar continuum. Circles represent individual galaxies, colour-coded by their spectroscopic redshift. Three lower limits are shown on each panel as grey triangles. The median uncertainties on the M⋆ and SFR are 0.2 and 0.3 dex, respectively. The horizontal dashed grey line corresponds to a Balmer decrement of 2.86, appropriate for local star-forming regions. The grey shaded region represents the 6% range of Hα/Hβ, corresponding to 5000 < Te < 30 000 K and 10 < ne < 500 cm−3. The horizontal dotted grey line corresponds to a Balmer decrement of 2.75. The horizontal red lines and shaded regions represent the running mean and error on the mean. The Balmer decrement shows a statistically significant correlation with M⋆. For the SFR, we find an increasing trend from log(SFR/M⋆ yr−1) > − 0.5 dex. Because we measure both the M⋆ and SFR from PPXF (Sect. 2.4), the Hα and Hβ emission lines do not enter these two measurements, meaning the observed correlations with the Balmer decrement are not due to correlated noise.
Current usage metrics show cumulative count of Article Views (full-text article views including HTML views, PDF and ePub downloads, according to the available data) and Abstracts Views on Vision4Press platform.
Data correspond to usage on the plateform after 2015. The current usage metrics is available 48-96 hours after online publication and is updated daily on week days.
Initial download of the metrics may take a while.