| Issue |
A&A
Volume 690, October 2024
|
|
|---|---|---|
| Article Number | A269 | |
| Number of page(s) | 8 | |
| Section | Extragalactic astronomy | |
| DOI | https://doi.org/10.1051/0004-6361/202450359 | |
| Published online | 16 October 2024 | |
The Sunburst Arc with JWST
I. Detection of Wolf-Rayet stars injecting nitrogen into a low-metallicity, z = 2.37 proto-globular cluster leaking ionizing photons
1
The Oskar Klein Centre, Department of Astronomy, Stockholm University, AlbaNova, 10691 Stockholm, Sweden
2
Department of Astronomy, University of Texas at Austin, 2515 Speedway, Austin, Texas 78712, USA
3
Department of Astronomy, University of Maryland, College Park, MD 20742, USA
4
Observational Cosmology Lab, Code 665, NASA Goddard Space Flight Center, 8800 Greenbelt Rd., Greenbelt, MD 20771, USA
5
Center for Research and Exploration in Space Science and Technology, NASA/GSFC, Greenbelt, MD 20771, USA
6
Steward Observatory, University of Arizona, 933 North Cherry Avenue, Tucson, AZ 85721, USA
7
Department of Astronomy, University of Michigan, 1085 S. University Ave, Ann Arbor, MI 48109, USA
8
Institute of Theoretical Astrophysics, University of Oslo, P.O. Box 1029 Blindern, NO-0315 Oslo, Norway
9
Department of Physics, University of Cincinnati, Cincinnati, OH 45221, USA
10
Department of Physics and Astronomy and PITT PACC, University of Pittsburgh, Pittsburgh, PA 15260, USA
11
Department of Astronomy and Astrophysics, University of Chicago, 5640 South Ellis Avenue, Chicago, IL 60637, USA
12
Kavli Institute for Cosmological Physics, University of Chicago, Chicago, IL 60637, USA
13
IPAC, California Institute of Technology, 1200 E. California Blvd., Pasadena, CA 91125, USA
⋆
Corresponding author; This email address is being protected from spambots. You need JavaScript enabled to view it.
Received:
13
April
2024
Accepted:
5
August
2024
Abstract
We report the detection of a population of Wolf-Rayet (WR) stars in the Sunburst Arc, a strongly gravitationally lensed galaxy at redshift z = 2.37. As the brightest known lensed galaxy, the Sunburst Arc has become an important cosmic laboratory for studying star and cluster formation, Lyman α (Lyα) radiative transfer, and Lyman continuum (LyC) escape. Here, we present the first results of JWST/NIRSpec IFU observations of the Sunburst Arc, focusing on a stacked spectrum of the 12-fold imaged Sunburst LyC-emitting (LCE) cluster. In agreement with previous studies, we find that the Sunburst LCE cluster is a very massive, compact star cluster with Mdyn = (9 ± 1)×106 M⊙. Our age estimate of 4.2–4.5 Myr is much larger than the crossing time of tcross = 183 ± 9 kyr, indicating that the cluster is dynamically evolved and consistent with it being gravitationally bound. We find a significant nitrogen enhancement of the low ionization state interstellar medium (ISM), with log(N/O) = − 0.74 ± 0.09, which is ≈0.8 dex above typical values for H II regions of a similar metallicity in the local Universe. We find broad stellar emission complexes around He IIλ4686 and C IVλ5808 with associated nitrogen emission; this is the first time WR signatures have been directly observed at redshifts above ∼0.5. The strength of the WR signatures cannot be reproduced by stellar population models that only include single-star evolution. While models with binary evolution better match the WR features, they still struggle to reproduce the nitrogen-enhanced WR features. JWST reveals the Sunburst LCE cluster to be a highly ionized proto-globular cluster with low oxygen abundance and extreme nitrogen enhancement that hosts a population of WR stars, likely including a previously suggested population of very massive stars (VMSs), which together are rapidly enriching the surrounding medium.
Key words: stars: Wolf-Rayet / galaxies: evolution / galaxies: ISM / galaxies: starburst / galaxies: star clusters: general
Publisher note: The last name of first author is Rivera-Thorsen. It has been corrected on 1st November 2024.
© The Authors 2024
 Open Access article, published by EDP Sciences, under the terms of the Creative Commons Attribution License (https://creativecommons.org/licenses/by/4.0), which permits unrestricted use, distribution, and reproduction in any medium, provided the original work is properly cited.
This article is published in open access under the Subscribe to Open model. This email address is being protected from spambots. You need JavaScript enabled to view it. to support open access publication.
1. Introduction
Massive stars dominate the mechanical feedback, ionizing photon production, and chemical enrichment of young stellar populations. Such stars spend ∼10% of their lives in an evolutionary phase where they are classified as Wolf-Rayet (WR) stars (Meynet & Maeder 2005). Classical WR stars are massive, evolved, very hot stars that have lost their hydrogen envelopes (e.g., Crowther 2007). Typically, there are two formation channels by which the outer hydrogen layers of WR stars are shed: through extreme stellar wind mass loss (Meynet & Maeder 2005) or through close binary interactions. Metal-line absorption drives gas off the surface of massive stars; the mass-loss rate is extremely sensitive to the metallicity of the star. Thus, although the WR phase is a fleeting part of the short life of a massive star, collectively, WR stars can significantly contribute to or even dominate the winds, ionizing photons, and nucleosynthetic production of star-forming populations.
Individual WR stars have been identified out to distances of ≲5 Mpc (e.g., Schootemeijer & Langer 2018; Della Bruna et al. 2021, 2022). WR signatures have been identified in the spectra of nearby galaxies (e.g., Vacca & Conti 1992; Gómez-González et al. 2021), and as far out as redshift z = 0.45 (e.g., Menacho et al. 2021; Yuan et al. 2022). WR stars are most common at higher metallicities, but WR signatures have been observed in low-metallicity galaxies (e.g., Amorín et al. 2012; Kehrig et al. 2013) and even in I Zwicky 18, the most metal-poor galaxy known (Guseva et al. 2000), demonstrating that such stripped stars are readily produced, despite the dependence of line-driven mass loss on metallicity. Binary stellar evolution paths may be particularly important at low metallicity.
Stacked rest-frame ultraviolet (UV) spectra of z ∼ 3 galaxies have revealed broad stellar wind features that may be due to classical WR stars (Shapley et al. 2003; Rigby et al. 2018), but could also be explained by the presence of very massive stars (VMSs), conventionally defined as main-sequence stars with M ≥ 100 M⊙ (e.g., Wofford et al. 2014; Crowther et al. 2016; Smith et al. 2023; Upadhyaya et al. 2024). Unlike lower-mass main-sequence stars, VMSs have strong stellar winds which make them appear spectroscopically similar to WR stars. They have not yet shed their hydrogen envelopes, so while they do display strong wind features similar to classical WR stars, they do not share the lacking hydrogen lines and richness in metal emission features of the latter. While the broad wind features in the rest-frame UV are almost identical for VMSs and WR stars, similar wind features exist in the rest-frame optical, which can help discriminate between the two star types (Martins et al. 2023). However, while Martins et al. (2023) present a classification scheme to distinguish between the two types of stars, Vink (2023) argues that VMSs are the same objects as the WNh type WR stars, and later evolve into classical nitrogen rich WR stars of type WN. What has been missing, until now, is rest-frame optical spectra of the distant universe with sufficient sensitivity and dynamic range to reveal the faint, subtle signs of WR stars within their stellar populations.
In this paper, we present rest-frame optical James Webb Space Telescope (JWST)/NIRSpec Integral Field Unit (IFU) spectra of a bright, massive star cluster and surrounding H II region within the Sunburst Arc (Dahle et al. 2016), a strongly star-forming galaxy at z = 2.37 which is gravitationally lensed by a foreground (z = 0.44) galaxy cluster (Sharon et al. 2022; Pignataro et al. 2021; Diego et al. 2022). The region targeted is known to be leaking ionizing photons (Rivera-Thorsen et al. 2019). By stacking the spectrum of multiple lensed images of this region, we obtain a spectrum that is directly comparable, in signal-to-noise ratio (S/N), wavelength range, and spectral resolution, to the spectra of H II regions in the best–studied nearby galaxies. The galaxy morphology is dominated by a number of emission clumps, of which especially one is very bright (Rivera-Thorsen et al. 2019; Vanzella et al. 2022; Pignataro et al. 2021). Due to the large shear magnification, this bright clump is resolved down to parsec scales, revealing a compact star cluster with a stellar population age of ∼3.6 Myr (Chisholm et al. 2019) and steep stellar UV slope β ≈ −3 (Kim et al. 2023). Chisholm et al. (2019) find broad C IVλ 1548 and H IIλ 1640 stellar wind lines in rest-frame UV Magellan/MagE spectra, but it is very challenging to discriminate between the two kinds of stars from these lines alone. Pascale et al. (2023), Meštrić et al. (2023) attribute the rest-UV stellar features in the Sunburst Lyman continuum-emitting (LCE) cluster to VMSs. Pascale et al. (2023) find very strong nitrogen enhancement in hot, high-density gas condensations that they argue must be located outside, but in near proximity to, the cluster. Since the launch of JWST, such very strong and highly localized nitrogen enrichment has also been observed at high redshifts, and is often but not always considered consistent with being injected by VMSs and WR stars (e.g., Kobayashi & Ferrara 2024; Ji et al. 2024)
2. Observations and data reduction
The target was observed with JWST/NIRCam imaging and JWST/NIRSpec integral field spectroscopy in JWST Cycle 1, as part of program GO-2555 (PI: Rivera-Thorsen) over the time period from April 4, 2023, to April 10, 2023. The entire field was observed in each of the NIRCam filters F115W, F150W, F200W, F277W, F356W, and F444W. Four pointings were observed with NIRSpec: three on-target covering different sections of the Sunburst Arc, and one off-target for background correction (Figure 1). The target was observed in each of the settings F100L/G140H and F170L/G235H, covering a combined rest-frame wavelength range of 2900 Å ≤ λ0 ≤ 9700 Å; however, for the sake of this analysis, only the wavelength range 3500 Å ≲λ0≲ 8000 Å was used. The spectral resolving power within this wavelength interval ranges from R ≈ 2250 (Δv ≈ 133km s−1) to R ≈ 3820 (Δv ≈ 78 km s−1) for g140h, and from R ≈ 1690 (Δv ≈ 160 km s−1) to R ≈ 3140 (Δv ≈ 80 km s−1) for g235h. The point spread function (PSF) of NIRSpec is not yet well characterized, but recent treatment by (D’Eugenio et al. 2023, see their Fig. 7) suggests that the PSF is stable in size up to λ ≈ 3 μm, with a minor-axis full width half maximum (FWHM)  , and a major-axis
  . For comparison, the native spaxel size of the IFU is
  .
.
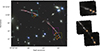 |
Fig. 1. Overview of the arc. Left: NIRCam RGB composite of the N and NW arc segments, with R, G, B being F444W, F200W, and F115W, respectively, together covering the rest-frame wavelength range 3400–13 000 Å. Dashed cyan, magenta, and yellow overlays show the approximate footprints of the three NIRSpec pointings 1, 2, and 3, respectively. Orange arrows show the images of the gravitationally lensed LCE cluster that were included in the stacked spectrum. Right: NIRSpec IFU continuum images of pointings 1 (top right) and combined pointings 2+3 (bottom right), created from a median stacking along the spectral axis of the F100L/G140H cubes. Orange circles mark the images of the LCE cluster included in the stacked spectrum. |
We refer the reader to the main companion paper (Rivera-Thorsen et al., in prep.) for a thorough explanation of the data reduction and calibration steps, but outline the most important steps here. We reduced the NIRSpec IFU observations following the methods described in Rigby et al. (2023), using the TEMPLATES NIRSpec data reduction notebooks (Rigby et al. 2024). For the reduction, we used version 1.11.4 of the JWST pipeline (Bushouse et al. 2023) and the calibration reference files from context pmap_1105. After completing the pipeline reduction, we removed remaining outliers from the data cubes using the baryon-sweep software (Hutchison et al. 2024b,a).
3. Emission line modeling
We extracted a stacked spectrum from five of the six lensed images of the LCE cluster covered by the IFU (Figure 1). In the nomenclature of Rivera-Thorsen et al. (2019), Sharon et al. (2022), they are images 4, 5, 8, 9, and 10. Image 6 was partially covered by the IFU, but since the data quality was negatively affected by its position right at the edge of the detector, we omitted this image from our analysis. We extracted a spectrum from an area of 5 × 5 spaxels covering each image of the LCE cluster. For each spectrum, the aperture spaxels were continuum-weighted using the median value along the spectral axis before extraction. Each extracted spectrum was then normalized by the median flux value in the wavelength bins in the wavelength overlap interval between the two disperser settings. Since the spectra are magnified differently, we made no attempt to preserve absolute fluxes, and all results in this work are based on flux ratios. The extracted spectrum displays an extremely high S/N and sensitivity. We detect stellar continuum at a comfortable S/N across the entire wavelength range, and have identified 59 emission lines in this spectrum, including Balmer and Paschen lines from up to level 20, as well as auroral emission lines from multiple species and ionization levels. A full analysis of abundances and ionization zones based on direct Te methods are presented in a companion paper (Welch et al. 2024).
All subsequent line ratio-based computations are based on the full flux of each line; however, to account for all of the flux in each line as accurately as possible, we modeled the line emission by three kinematic components, each modeled with a shared FWHM and redshift, with the flux in different lines left as a free parameter, such that for N emission lines with M kinematic components each included in the fit, we have a number of free parameters npars = M(N + 2). In some faint lines, the broadest components fell below the noise level and thus only added noise to the fit, in which case they were removed. We originally included only two components, one narrow and one broad, but it proved necessary to add a third, broad component in order to get a reasonable fit for the brightest lines, as especially Hα contains a non-negligible broad component of FWHM ≈ 800 km s−1, which likely originates from outflows driven by stellar winds from massive evolved stars in the cluster. We corrected the inferred line widths for instrument broadening using the official JWST/NIRSpec calibration files available for download at J-Docs1 (these are the versions delivered in June 2016 and at the time of writing are the most current). We interpolated the tabulated values of R, and obtained the value corresponding to the observed wavelength of each line. We assumed Gaussianity and corrected for instrument broadening by adding in quadrature the velocity dispersion and the instrument broadening in the model of each line to obtain the intrinsic line width.
Figure 2 shows a comparison of the observed data and the best-fit model for a few selected lines, [O III] 5008 and Hα, which are among the lines dominating the kinematics of the fit, and the two ne-sensitive doublets [O II] 3727,3729 and [S II] 6717,6731. We note that in particular in the case of the [O II] doublet, which is blended at the resolving power of NIRSpec, its inferred flux ratio could be sensitive to an ill-fitting kinematic model. However, as clearly apparent in the figure, the kinematics of the strongest lines fits well with both doublets, and we adopted the line ratios derived from these fits with good confidence.
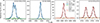 |
Fig. 2. Best-fit model of selected emission lines, shifted to rest-frame wavelengths. Here are shown the two strongest lines dominating the kinematics, as well as the two ne-sensitive doublets, [O II] 3727,3729 and [S II] 6716,6731. |
To resolve the narrow emission to the best possible extent, we also performed a fit to the [O III] λλ4960,5008 in F100L/G140H, where the resolving power is highest at R ≈ 3300. This fit yielded FWHM = 83 km s−1, or σLOS ≃ 35.3 ± 2.1 km s−1, fully consistent with the value obtained by Vanzella et al. (2022) using VLT/X-shooter.
Tables 1 and 2 show the results of the modeling; the former shows the centroid and line widths of the three kinematic components, while the latter shows the total measured flux of the measured lines relative to the measured flux in Hβ.
Best-fit kinematic properties of the three components.
Measured line fluxes relative to Hβ.
4. LCE cluster properties
4.1. Detection of Wolf-Rayet stars
Previous ground-based, rest-frame UV spectroscopic observations with Magellan and the VLT have shown broad stellar emission in He IIλ 1640 and C IVλ 1548 (Chisholm et al. 2019; Meštrić et al. 2023). These lines are typically attributed to WR stars, but can also be attributed to VMSs, usually defined as main sequence stars of M⋆ ≥ 100 M⊙. The emission has been attributed to VMSs by, for instance, Meštrić et al. (2023) and Pascale et al. (2023) from secondary evidence, but it is very difficult to distinguish these two scenarios from the rest-frame UV emission alone. This degeneracy can, however, be broken with rest-frame optical spectral features. The classical WR “bumps” at ∼4686 Å (the “blue bump”) and ∼5808 Å (the “orange bump,” elsewhere sometimes described as “yellow” or “red”) consist of complexes of metal lines centered around He IIλ 4686 (blue) and C IVλ 5808 (orange), which are present at varying strengths depending on the metal abundances, ionization, temperature, and other properties of the stars from which they originate. This allows for a distinction between VMSs and WR stars, as outlined in the classification scheme by Martins et al. (2023). According to this scheme, VMSs give rise to a blue bump dominated by stellar He II, and the orange bump, if present at all, is weak and consists of a simple C IV doublet; the dense complex of surrounding metal lines is largely absent.
Figure 3 shows the stacked spectrum of the Sunburst LCE cluster in the relevant wavelength intervals. The spectrum shows a clear, broad blue bump and a somewhat weaker broad orange bump. The two features are shown in close-up in the lower panels. Two forbidden, nebular Argon lines, [Ar IV]λλ 4711,4740, coincide with the red side of the blue bump, but they are not part of this line complex and neither is the narrow, nebular He Iλ 5875 line.
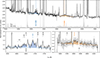 |
Fig. 3. Extracted and stacked spectrum of the Sunburst LCE cluster, zoomed into the continuum to clearly show the blue and orange WR bumps. Blueward of 5500 Å, only the G140H spectrum is shown; redward, only the G235H spectrum is shown. Almost all the spikes are emission lines. The best-fit continuum at each bump is shown in its corresponding color. Lower left: Detailed view of the blue WR bump. The gray shading shows the ±1σ errors. A number of emission line centroids are marked. Lower right: Similar detailed view of the orange WR bump, centered on the C IVλλ 5801,5812 Å feature. On its red side is a He IIλ 5875 emission line; on its blue side is an instrument artifact. The blue and orange shading of the bumps is mainly to guide the eye. |
To measure line width and flux of the WR He II 4686 feature, we fit it to a single Gaussian profile. We enforced the continuum level shown in the upper panel and included the wavelength interval only between [Fe III] and [Ar IV]. The fit yields a velocity FWHM = 1370 ± 250 km s−1 and rest-frame equivalent width (EW) = 4.1 ± 0.4 Å. Following the methodology of Martins et al. (2023), the widths and relative strengths of the bumps, and in particular the prevalence of the permitted N III features at λλ 4620,4640, all place these features firmly in the WR category. However, since what separates the two stellar types in this scheme is mainly the absence of certain features in VMSs compared to WR stars, having found strong spectroscopic evidence for WR stars does not rule out a–potentially significant–contribution from VMSs (see Sect. 4.6).
4.2. Dust attenuation
To model dust attenuation, we adopted a standard starburst attenuation law (Calzetti et al. 2000) with a standard value of RV ≡ AV/E(B − V) = 4.05. We computed E(B − V) following Calzetti et al. (2000). Adopting a standard intrinsic Hα/Hβ = 2.86 yields a value of E(B − V) = 0.11 ± 0.19, which we applied to deredden line fluxes.
4.3. Dynamical mass
Following Rhoads et al. (2014), Vanzella et al. (2022), we found the dynamical mass using the approximation  , with Reff being the effective radius of the LCE cluster. Since we do not have a measurement for the stellar velocity dispersion, we adopted the line width of the narrow component of the strong emission lines, Hα, Hβ, and the [O III] doublet at 4960,5008 Å as a proxy for
  . Adopting the value Reff = 7.8 pc (Meštrić et al. 2023), we found Mdyn = (9.0 ± 1.1)×106 M⊙.
4.4. Oxygen abundance
We estimated the oxygen abundance in the gas based on the direct Te method, following the recipe of Pérez-Montero (2017), using the O+ and O++ based abundances together. We did not observe any nebular He II and thus believe the contribution of higher ionization stages is negligible.
We first found the electron temperature and density using PYNEB (Luridiana et al. 2015) and its getCrossTemDen method, which yields  and
and  . Using [S II]λλ 6716, 6731 as an ne diagnostic yields an identical value of Te, and an electron density of
  .
.
Following equations 38 and 40 set out in Pérez-Montero (2017), we found

and from the approximation O/H =(O+ + O2+)/H+ (Izotov et al. 2006; Pérez-Montero 2017), we obtained  .
.
Adopting the solar value of 12 + log(O/H) = 8.69 from Asplund et al. (2009), this yields an oxygen abundance for the gas of the Sunburst LCE cluster of about  . Chisholm et al. (2019) found a stellar metallicity of Z⋆ ≈ 0.3 Z⊙ and Pascale et al. (2023) found a nebular metallicity of Zneb ≈ 0.26 Z⊙–both higher than the nebular abundance found in this work, but fully consistent within the error bars. From the derived temperature and density, we also derived the pressure, finding
  . This is consistent with values in the centers of local Universe starburst galaxies (Della Bruna et al. 2021, 2022).
4.5. Nitrogen enhancement
Despite having a low metallicity, the Sunburst LCE cluster is highly nitrogen enriched. Pascale et al. (2023) report  based on the rest-frame UV [N III] emission from VLT/X-shooter spectroscopy.
For this work, we computed log(N/O) from [O II]λλ 3727,3729 and [N II]λ 6584, following Pérez-Montero (2017). This ion abundance ratio is expected to follow the true element abundance closely because of the strong similarity in ionization potentials between the two species. Still following Pérez-Montero (2017), we computed
![Mathematical equation: $$ t([{\text{ N}}\,{\small{\text{II} }}]) \equiv 10^{-4} T_{e}(\text{ N}^{+ }) = \frac{1.85}{[t(\text{[O } {\small{\text{III} }}]) - 0.72]} $$](/articles/aa/full_html/2024/10/aa50359-24/aa50359-24-eq14.gif)
and adopted this as the low-excitation temperature, in line with the nomenclature used by those authors2. We derived an [N II] -based nitrogen abundance for the Sunburst LCE cluster of log(N/O) = − 0.74 ± 0.09. Despite having a low metallicity, the Sunburst LCE cluster is highly nitrogen enriched. Pascale et al. (2023) report  based on the rest-frame UV [N III] emission from VLT/X-shooter spectroscopy. This value is ∼0.7 (Berg et al. 2012) to 0.8 (Topping et al. 2024) dex above the typical value for local Universe H II regions with the same oxygen abundance, 12+log(O/H) ≈ 7.95, but is still half a dex below the even higher [N III]-based value found by Pascale et al. (2023). We find that this corroborates the hypothesis put forward by Pascale et al. (2023), that the majority of the nitrogen enhancement in the Sunburst LCE is found in dense, highly ionized clouds in close vicinity to the LCE cluster, the most massive members of which are currently the main drivers of this nitrogen enhancement. A similar scenario has also been suggested recently for high-redshift galaxies in general by Ji et al. (2024), who also suggest that the surrounding, low-density gas has a more normal chemical evolution.
Recent observations of galaxies at z > 10 have found extreme N/O enhancements only a few hundred million years after the Big Bang that have been compared to the Sunburst Arc (Cameron et al. 2023; Senchyna et al. 2024; Marques-Chaves et al. 2024; Castellano et al. 2024). Nitrogen is often thought to be produced by long-lived evolved lower-mass stars, and these extreme N/O observations in the early Universe have called into question the origin of early nitrogen production. The observations of WR stars within the Sunburst Arc point to a plausible causal origin of the nitrogen: extreme nitrogen production from classical WR and WNh stars (Berg et al. 2012; Kobayashi & Ferrara 2024). This suggests that short-lived evolved massive stars may play a crucial role in the build-up of metals within the first few hundred million years of cosmic history and might hold a key to inferring the properties of the first galaxies that formed in the Universe. In this study, we find that while the nitrogen enhancement in the low-density medium is far lower than in the denser medium, it is still quite strongly enhanced.
This also challenges one part of the scenario proposed by Pascale et al. (2023): that the dense, ionized medium is located outside and at a distance from the LCE cluster. Such a scenario would see a higher Nitrogen abundance in the neutral, low-density medium relative to the dense medium than we observe here. Rather, this gas might reside in dense condensations within the LCE cluster itself, in close proximity to the most massive stars.
4.6. Wolf-Rayet population properties
To investigate the properties of the WR population, we compared the WR bumps to synthetic spectra produced by the BPASS code (Eldridge et al. 2017; Stanway & Eldridge 2018; Stevance et al. 2020), see Figure 4. These spectra were taken from the “fiducial” suite of models, produced using a Kroupa IMF with a slope of −2.35, minimum and maximum stellar masses of 0.5 and 300 M⊙, and a metallicity of Z = 0.04 ≈ 20% Z⊙ (Stevance et al. 2020). For each time step, we show the synthetic spectrum with the binary evolution tracks enabled (leftmost panels) and disabled (rightmost panels).
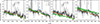 |
Fig. 4. Comparison of BPASS models to the observed WR bumps. The panels show the blue (a, c) and orange (b, d) WR bumps in the Sunburst LCE, this time shown in normalized fλ units. Shown here along with the observed data is a selection of the fiducial BPASS (Eldridge et al. 2017; Stanway & Eldridge 2018; Stevance et al. 2020) synthetic spectra corresponding to a metallicity of 19% Z⊙ as found using the direct method, and the range of ages at which a considerable WR population can be present. Binary evolution is enabled in the models in panels a and b, and disabled in panels c and d. |
Following the method outlined by del Valle-Espinosa et al. (2023), we visually compared BPASS age steps in the 6.3 ≤ log(age [yr])≤6.8 range during which WR stars are prevalent, to the observed spectrum. In particular, we looked for the age step at which the relative strengths of the two emission features are best emulated by the model spectra. Using the relative heights of the bumps as a proxy for their relative fluxes, we found that the observed spectra had a peak ratio between the bumps of I(4686)/I(5808)obs ≈ 2.35. The model spectrum yielded I(4686)/I(5808)≈1.79 at 4 Myr burst age, and I(4686)/I(5808)≈8.24 at 5 Myr burst age. The observed spectrum is between these two ages, but is closer to 4 Myr than 5 Myr of age. By way of comparison, Chisholm et al. (2019) found a light-weighted cluster age of 3.6 Myr when fitting a similar class of BPASS models to stacked, rest-frame UV slit spectra of the Sunburst LCE. The difference of ∼0.5 Myr is not significant, as on these short timescales the assumption of an instantaneous starburst likely breaks down.
The best fitting BPASS model population corresponding to 19% solar metallicity and a population age of 4 Myr contains (adjusted for mass) ∼900 WR stars, with the fractions of WNh, WN, and WC stars being 68%, 19%, and 13%, respectively. Assuming that VMSs are indeed WNh stars later evolving into classical WN stars as suggested by Vink (2023), we may be looking at a snapshot of just such an evolutionary sequence.
We tested BPASS models of other metallicities within the confidence interval of the computed values. We found that the WR models favor lower metallicities, around 10% Z⊙, in which case a slightly larger age, ∼5 Myr, is favored; and that the WR peaks are inconsistent with anything higher than 25% Z⊙. We note that the observed WR bumps are brighter relative to the underlying continuum than the BPASS model spectrum. In theory, this could be due to stronger winds in the WR stars, but these winds are line-driven and are weak at low metallicity. As can be seen in Figure 4, a binary population is needed to account for the observed WR emission strength, to compensate for the weaker wind stripping. Adamo et al. (2024) show (in their figure 2 an overview of inferred surface density and effective radius for a population of star clusters, including the Sunburst LCE. These authors find that the cluster is consistent with being a very massive proto-globular cluster with a high stellar density. This could statistically lead to an enhanced fraction of binary systems and in turn an enhanced VMS and/or WR population. Alternatively, a top-heavier IMF than adopted in the fiducial BPASS models could also give rise to a larger population of WR stars.
We also note that the WR bumps of the Sunburst LCE are much broader than those of the model spectra. While the model spectra at these metallicities are clearly dominated by He II and C IV, the observed bumps also show rich emission in the adjacent metal line complexes, in particular in N III around 4650 Å. This shows significant nitrogen enhancement in the evolved massive stars of the cluster, consistent with the suggestion by Kobayashi & Ferrara (2024) that evolved massive stars drive rapid nitrogen enhancement in the early phases of cluster evolution.
4.7. The relative contributions from VMSs and classical WR stars
As previously stated, other authors have attributed the rest-frame UV stellar wind features to VMSs, based on the observation from low-redshift galaxies that the fraction of WR stars at low stellar metallicity is very small (e.g., Crowther & Hadfield 2006; Crowther et al. 2023). Mayya et al. (2023) have studied the star-forming ring of the Cartwheel galaxy, which has a metallicity similar to that of the Sunburst LCE cluster. In this study, they calculated that the He II bump would have an EW > 2 Å only when a contingent of VMSs was present. Our own comparison to the fiducial BPASS models in Sect. 4.6 suggests that a fraction of ∼70% WNh stars/VMSs best simultaneously reproduces both the combined blue bump EW and the bump intensity ratio, supporting the idea that a large population of VMSs is present. In apparent contradiction to this stands the morphology of the bumps, and especially the strength of the surrounding metal lines, primarily [N III], which suggest a large fraction of classical WR stars. The BPASS models fail to reproduce the bump morphology and the metal line strength at this metallicity, as is evident in Figure 4. Moreover, the Martins et al. (2023) bump morphological classification scheme firmly classifies the blue and orange bumps as stemming from classical WR stars. The Martins et al. (2023) scheme is demonstrated and developed in the context of a galaxy of somewhat higher metallicity than the Sunburst LCE; however, the spectral features of the individual classes of VMSs and WR stars are not expected to change with metallicity, only the overall and relative numbers of these star types. Given that the stellar wind features of VMSs/WNh stars are a subset of those of classical WR stars, the Martins et al. (2023) scheme cannot rule out a contribution from VMSs but can only suggest that this contribution is considerably less dominant than in the BPASS models.
Additionally, regardless of the relative contributions from VMSs and classical WR stars, it is clear that the fiducial BPASS model cannot reproduce the strength of the blue and orange bumps. This makes it necessary to invoke some mechanism(s) that would give rise to a larger number of classical, hydrogen-stripped WR stars than the BPASS model, and in the previous section we suggested a higher binary fraction among the massive stars, due to the dense environment in this cluster. Such a boost to binary evolution could considerably boost the population of classical WR stars, and it could then lead one to ask whether invoking a VMS contribution would still be necessary to explain the bumps.
Clearly, closer analysis and higher S/N data are needed to properly settle this question. However, based on our findings here we can say that a surprisingly strong classical WR population is necessary to account for the observed bump morphologies, that a considerable contribution from VMSs seems plausible but more difficult to ascertain, and that it seems likely that the 70% VMSs of the total WR star count predicted by the fiducial BPASS model is an overestimate due to its failure to reproduce the broad metal emission features observed.
4.8. Age from EW(Hα)
These NIRSpec IFU spectra, covering the rest-frame optical in the Sunburst Arc, are the first detection of a rest-frame optical continuum in this galaxy, allowing the first spectroscopic measurement of the EW of Hα, EW0(Hα) = 1040 ± 31 Å. Given that the Sunburst LCE cluster is leaking ionizing radiation, this value should be corrected for the amount of ionizing photons that have not been reabsorbed in the ISM, giving rise to recombination lines. However, although the line-of-sight ionizing escape fraction is high, (Rivera-Thorsen et al. 2019); Rivera-Thorsen et al. (2017) have argued based on the properties of Lyα that the global escape fraction is much lower than that, perhaps as low as  (Table 3).
Derived physical properties of the Sunburst LCE cluster.
Comparing EW(Hα) to STARBURST 99 models for the relevant metallicity3 shows that the uncorrected EW(Hα) is consistent with a cluster age of log(age [yrs])∼6.6 or just under 4 Myr, within the same logarithmic age step best matching the WR emission. A more in-depth comparison of the age constraints imposed by Hα and WR emission could potentially help constrain the global LyC escape fraction, and test the Lyα radiative transfer and ISM geometry scenario put forward by Rivera-Thorsen et al. (2017).
5. Summary and conclusion
-
The Sunburst LCE cluster has a dynamical mass of (9.0 ± 1.1)×106 M⊙. Accounting for typical mass loss over the age of local GCs (e.g., Adamo et al. 2024), this brings the mass of the Sunburst LCE cluster very close to e.g., ω Cen.
-
The Sunburst LCE cluster has a moderately low oxygen abundance of
 , or just under 20% Z⊙, but an N/O ratio in the low-ionized medium slightly above solar.
 -
The LCE cluster contains a population of massive WR stars. To our knowledge, this is the first time these stars have been directly and unambiguously identified using the rest-frame optical WR features at z ≳ 0.5. The relative strengths of the blue and the orange WR bumps, compared to BPASS synthetic spectra, sets the LCE cluster age to slightly above 4 Myr. Adopting the numbers from the BPASS model and scaling for cluster mass, assuming that the dynamical mass is entirely stellar, yields a total of ∼700 WR stars in the LCE cluster.
-
The BPASS model best fitting the blue-to-orange bump ratio predicts as many as ∼70% of the total WR stars to be WNh stars, which are generally accepted to be a spectroscopic designation of VMSs. However, while these models can reproduce the relative bump strength well, they fail to reproduce the broad metal emission features surrounding the main He II and C III features. It is unclear whether the rapid nitrogen enrichment modeled by Vink (2023), Kobayashi & Ferrara (2024) can account for this discrepancy, but we tentatively suggest that the VMS/WR star ratio predicted by the best BPASS model may be too high.
-
The BPASS models not including binary evolution produce a much poorer approximation to the observed spectra than those with binary evolution enabled. In particular, they all fail to produce a blue/orange ratio larger than 1.
-
The observed WR bump strength relative to the underlying continuum is stronger than in any of the model spectra, indicating that the Sunburst LCE cluster contains more, or more luminous, WR stars than assumed in the models. A number of possible explanations could conceivably account for this, such as a top-heavier IMF, enhanced binary fraction, or stronger winds driven by rapid nitrogen enrichment. These data provide key observational constraints on stellar population models such as BPASS.
-
The LCE cluster is markedly nitrogen enriched for its low metallicity, with log(N/O) = − 0.74 ± 0.09, that is, about 0.8 dex higher than typical values for known H II regions of similar metallicity at low redshifts. The even higher log(N/O) = − 0.2 in the dense, ionized condensations reported by Pascale et al. (2023) suggests that the majority of the nitrogen sits in compact, highly ionized gas close to the most massive stars. This in turn lends credence to the hypothesis that we are observing a rapid, ongoing nitrogen enrichment of the cluster, driven mainly by very massive and bright stars, and the hypothesis by Ji et al. (2024) that most of the rapid nitrogen enrichment seen in galaxies such as gn-z11 is concentrated in high density and high-ionization regions around evolved high-mass stars, while the low-pressure and low-ionization evolves more moderately.
Together, these hints show a picture of a proto-globular cluster at roughly 20% the current age of the Universe with a bright population of WR stars, likely along with a significant contingent of VMSs, rapidly injecting nitrogen and other heavier elements into its ISM. The large WR star and VMS populations indicate a generally large population of massive stars, possibly combined with a high binarity fraction, leading to a stronger and perhaps more protracted production of ionizing photons than accounted for by the fiducial BPASS models.
Adopting the [O III]λ 4363 -based value of Te only changed the end result marginally.
Acknowledgments
The authors want to thank A. Bik, A. Saldana-Lopez, and M. del Valle-Espinosa for helpful comments and suggestions. This work is based on observations made with the NASA/ESA/CSA James Webb Space Telescope. The data were obtained from the Mikulski Archive for Space Telescopes at the Space Telescope Science Institute, which is operated by the Association of Universities for Research in Astronomy, Inc., under NASA contract NAS 5-03127 for JWST. These observations are associated with program GO 2555. Support for program #2555 was provided by NASA through a grant from the Space Telescope Science Institute, which is operated by the Association of Universities for Research in Astronomy, Inc., under NASA contract NAS 5-03127. ER-T is supported by the Swedish Research Council grant No. 2022-04805_VR.
References
- Adamo, A., Bradley, L. D., Vanzella, E., et al. 2024, Nature, 632, 513 [NASA ADS] [CrossRef] [Google Scholar]
- Amorín, R. O., Vílchez, J. M., & Pérez-Montero, E. 2012, in Unveiling the Nature of the “Green Pea” Galaxies, eds. P. Papaderos, S. Recchi, & G. Hensler, 243 [Google Scholar]
- Asplund, M., Grevesse, N., Sauval, A. J., & Scott, P. 2009, ARA&A, 47, 481 [NASA ADS] [CrossRef] [Google Scholar]
- Berg, D. A., Skillman, E. D., Marble, A. R., et al. 2012, ApJ, 754, 98 [NASA ADS] [CrossRef] [Google Scholar]
- Bushouse, H., Eisenhamer, J., Dencheva, N., et al. 2023, https://doi.org/10.5281/zenodo.10022973 [Google Scholar]
- Calzetti, D., Armus, L., Bohlin, R. C., et al. 2000, ApJ, 533, 682 [NASA ADS] [CrossRef] [Google Scholar]
- Cameron, A. J., Katz, H., Rey, M. P., & Saxena, A. 2023, MNRAS, 523, 3516 [NASA ADS] [CrossRef] [Google Scholar]
- Castellano, M., Napolitano, L., Fontana, A., et al. 2024, ApJ, 972, 143 [Google Scholar]
- Chisholm, J., Rigby, J. R., Bayliss, M., et al. 2019, ApJ, 882, 182 [Google Scholar]
- Crowther, P. A. 2007, ARA&A, 45, 177 [Google Scholar]
- Crowther, P. A., & Hadfield, L. J. 2006, A&A, 449, 711 [NASA ADS] [CrossRef] [EDP Sciences] [Google Scholar]
- Crowther, P. A., Caballero-Nieves, S. M., Bostroem, K. A., et al. 2016, MNRAS, 458, 624 [Google Scholar]
- Crowther, P. A., Rate, G., & Bestenlehner, J. M. 2023, MNRAS, 521, 585 [NASA ADS] [CrossRef] [Google Scholar]
- Dahle, H., Aghanim, N., Guennou, L., et al. 2016, A&A, 590, L4 [NASA ADS] [CrossRef] [EDP Sciences] [Google Scholar]
- del Valle-Espinosa, M. G., Sánchez-Janssen, R., Amorín, R., et al. 2023, MNRAS, 522, 2089 [NASA ADS] [CrossRef] [Google Scholar]
- Della Bruna, L., Adamo, A., Lee, J. C., et al. 2021, A&A, 650, A103 [NASA ADS] [CrossRef] [EDP Sciences] [Google Scholar]
- Della Bruna, L., Adamo, A., McLeod, A. F., et al. 2022, A&A, 666, A29 [NASA ADS] [CrossRef] [EDP Sciences] [Google Scholar]
- D’Eugenio, F., Perez-Gonzalez, P., Maiolino, R., et al. 2023, ArXiv e-prints [arXiv:2308.06317] [Google Scholar]
- Diego, J. M., Pascale, M., Kavanagh, B. J., et al. 2022, A&A, 665, A134 [NASA ADS] [CrossRef] [EDP Sciences] [Google Scholar]
- Eldridge, J. J., Stanway, E. R., Xiao, L., et al. 2017, PASA, 34, e058 [Google Scholar]
- Gómez-González, V. M. A., Mayya, Y. D., Toalá, J. A., et al. 2021, MNRAS, 500, 2076 [Google Scholar]
- Guseva, N. G., Izotov, Y. I., & Thuan, T. X. 2000, ApJ, 531, 776 [NASA ADS] [CrossRef] [Google Scholar]
- Hutchison, T. A., Welch, B. D., Rigby, J. R., et al. 2024a, Baryon-sweep: Outlier rejection algorithm for JWST/NIRSpec IFS data, Astrophysics Source Code Library [record ascl:2401.012] [Google Scholar]
- Hutchison, T. A., Welch, B. D., Rigby, J. R., et al. 2024b, PASP, 136, 044503 [NASA ADS] [CrossRef] [Google Scholar]
- Izotov, Y. I., Stasińska, G., Meynet, G., Guseva, N. G., & Thuan, T. X. 2006, A&A, 448, 955 [CrossRef] [EDP Sciences] [Google Scholar]
- Ji, X., Übler, H., Maiolino, R., et al. 2024, ArXiv e-prints [arXiv:2404.04148] [Google Scholar]
- Kehrig, C., Pérez-Montero, E., Vílchez, J. M., et al. 2013, MNRAS, 432, 2731 [NASA ADS] [CrossRef] [Google Scholar]
- Kim, K. J., Bayliss, M. B., Rigby, J. R., et al. 2023, ApJ, 955, L17 [NASA ADS] [CrossRef] [Google Scholar]
- Kobayashi, C., & Ferrara, A. 2024, ApJ, 962, L6 [NASA ADS] [CrossRef] [Google Scholar]
- Luridiana, V., Morisset, C., & Shaw, R. A. 2015, A&A, 573, A42 [NASA ADS] [CrossRef] [EDP Sciences] [Google Scholar]
- Marques-Chaves, R., Schaerer, D., Kuruvanthodi, A., et al. 2024, A&A, 681, A30 [NASA ADS] [CrossRef] [EDP Sciences] [Google Scholar]
- Martins, F., Schaerer, D., Marques-Chaves, R., & Upadhyaya, A. 2023, A&A, 678, A159 [NASA ADS] [CrossRef] [EDP Sciences] [Google Scholar]
- Mayya, Y. D., Plat, A., Gómez-González, V. M. A., et al. 2023, MNRAS, 519, 5492 [NASA ADS] [CrossRef] [Google Scholar]
- Menacho, V., Östlin, G., Bik, A., et al. 2021, MNRAS, 506, 1777 [NASA ADS] [CrossRef] [Google Scholar]
- Meštrić, U., Vanzella, E., Upadhyaya, A., et al. 2023, A&A, 673, A50 [NASA ADS] [CrossRef] [EDP Sciences] [Google Scholar]
- Meynet, G., & Maeder, A. 2005, A&A, 429, 581 [CrossRef] [EDP Sciences] [Google Scholar]
- Pascale, M., Dai, L., McKee, C. F., & Tsang, B. T. H. 2023, ApJ, 957, 77 [NASA ADS] [CrossRef] [Google Scholar]
- Pérez-Montero, E. 2017, PASP, 129, 043001 [CrossRef] [Google Scholar]
- Pignataro, G. V., Bergamini, P., Meneghetti, M., et al. 2021, A&A, 655, A81 [NASA ADS] [CrossRef] [EDP Sciences] [Google Scholar]
- Rhoads, J. E., Malhotra, S., Richardson, M. L. A., et al. 2014, ApJ, 780, 20 [Google Scholar]
- Rigby, J. R., Bayliss, M. B., Chisholm, J., et al. 2018, ApJ, 853, 87 [Google Scholar]
- Rigby, J. R., Vieira, J. D., Phadke, K. A., et al. 2023, ArXiv e-prints [arXiv:2312.10465] [Google Scholar]
- Rigby, J., Hutchison, T. A., Rivera-Thorsen, T. E., et al. 2024, https://doi.org/10.5281/zenodo.10933642 [Google Scholar]
- Rivera-Thorsen, T. E., Dahle, H., Gronke, M., et al. 2017, A&A, 608, L4 [NASA ADS] [CrossRef] [EDP Sciences] [Google Scholar]
- Rivera-Thorsen, T. E., Dahle, H., Chisholm, J., et al. 2019, Science, 366, 738 [Google Scholar]
- Schootemeijer, A., & Langer, N. 2018, A&A, 611, A75 [NASA ADS] [CrossRef] [EDP Sciences] [Google Scholar]
- Senchyna, P., Plat, A., Stark, D. P., & Rudie, G. C. 2024, ApJ, 966, 92 [NASA ADS] [CrossRef] [Google Scholar]
- Shapley, A. E., Steidel, C. C., Pettini, M., & Adelberger, K. L. 2003, ApJ, 588, 65 [Google Scholar]
- Sharon, K., Mahler, G., Rivera-Thorsen, T. E., et al. 2022, ApJ, 941, 203 [NASA ADS] [CrossRef] [Google Scholar]
- Smith, L. J., Oey, M. S., Hernandez, S., et al. 2023, ApJ, 958, 194 [NASA ADS] [CrossRef] [Google Scholar]
- Stanway, E. R., & Eldridge, J. J. 2018, MNRAS, 479, 75 [NASA ADS] [CrossRef] [Google Scholar]
- Stevance, H., Eldridge, J., & Stanway, E. 2020, J. Open Source Software, 5, 1987 [NASA ADS] [CrossRef] [Google Scholar]
- Topping, M. W., Stark, D. P., Senchyna, P., et al. 2024, MNRAS, 529, 3301 [NASA ADS] [CrossRef] [Google Scholar]
- Upadhyaya, A., Marques-Chaves, R., Schaerer, D., et al. 2024, A&A, 686, A185 [NASA ADS] [CrossRef] [EDP Sciences] [Google Scholar]
- Vacca, W. D., & Conti, P. S. 1992, ApJ, 401, 543 [NASA ADS] [CrossRef] [Google Scholar]
- Vanzella, E., Castellano, M., Bergamini, P., et al. 2022, A&A, 659, A2 [NASA ADS] [CrossRef] [EDP Sciences] [Google Scholar]
- Vink, J. S. 2023, A&A, 679, L9 [NASA ADS] [CrossRef] [EDP Sciences] [Google Scholar]
- Welch, B., Rivera-Thorsen, T. E., Rigby, J., et al. 2024, ArXiv e-prints [arXiv:2405.06631] [Google Scholar]
- Wofford, A., Leitherer, C., Chandar, R., & Bouret, J.-C. 2014, ApJ, 781, 122 [Google Scholar]
- Yuan, A., Yang, C., Zhong, G., et al. 2022, MNRAS, 510, 309 [Google Scholar]
All Tables
All Figures
|
Fig. 1. Overview of the arc. Left: NIRCam RGB composite of the N and NW arc segments, with R, G, B being F444W, F200W, and F115W, respectively, together covering the rest-frame wavelength range 3400–13 000 Å. Dashed cyan, magenta, and yellow overlays show the approximate footprints of the three NIRSpec pointings 1, 2, and 3, respectively. Orange arrows show the images of the gravitationally lensed LCE cluster that were included in the stacked spectrum. Right: NIRSpec IFU continuum images of pointings 1 (top right) and combined pointings 2+3 (bottom right), created from a median stacking along the spectral axis of the F100L/G140H cubes. Orange circles mark the images of the LCE cluster included in the stacked spectrum. |
| In the text | |
|
Fig. 2. Best-fit model of selected emission lines, shifted to rest-frame wavelengths. Here are shown the two strongest lines dominating the kinematics, as well as the two ne-sensitive doublets, [O II] 3727,3729 and [S II] 6716,6731. |
| In the text | |
|
Fig. 3. Extracted and stacked spectrum of the Sunburst LCE cluster, zoomed into the continuum to clearly show the blue and orange WR bumps. Blueward of 5500 Å, only the G140H spectrum is shown; redward, only the G235H spectrum is shown. Almost all the spikes are emission lines. The best-fit continuum at each bump is shown in its corresponding color. Lower left: Detailed view of the blue WR bump. The gray shading shows the ±1σ errors. A number of emission line centroids are marked. Lower right: Similar detailed view of the orange WR bump, centered on the C IVλλ 5801,5812 Å feature. On its red side is a He IIλ 5875 emission line; on its blue side is an instrument artifact. The blue and orange shading of the bumps is mainly to guide the eye. |
| In the text | |
|
Fig. 4. Comparison of BPASS models to the observed WR bumps. The panels show the blue (a, c) and orange (b, d) WR bumps in the Sunburst LCE, this time shown in normalized fλ units. Shown here along with the observed data is a selection of the fiducial BPASS (Eldridge et al. 2017; Stanway & Eldridge 2018; Stevance et al. 2020) synthetic spectra corresponding to a metallicity of 19% Z⊙ as found using the direct method, and the range of ages at which a considerable WR population can be present. Binary evolution is enabled in the models in panels a and b, and disabled in panels c and d. |
| In the text | |
Current usage metrics show cumulative count of Article Views (full-text article views including HTML views, PDF and ePub downloads, according to the available data) and Abstracts Views on Vision4Press platform.
Data correspond to usage on the plateform after 2015. The current usage metrics is available 48-96 hours after online publication and is updated daily on week days.
Initial download of the metrics may take a while.