Fig. 3.
Download original image
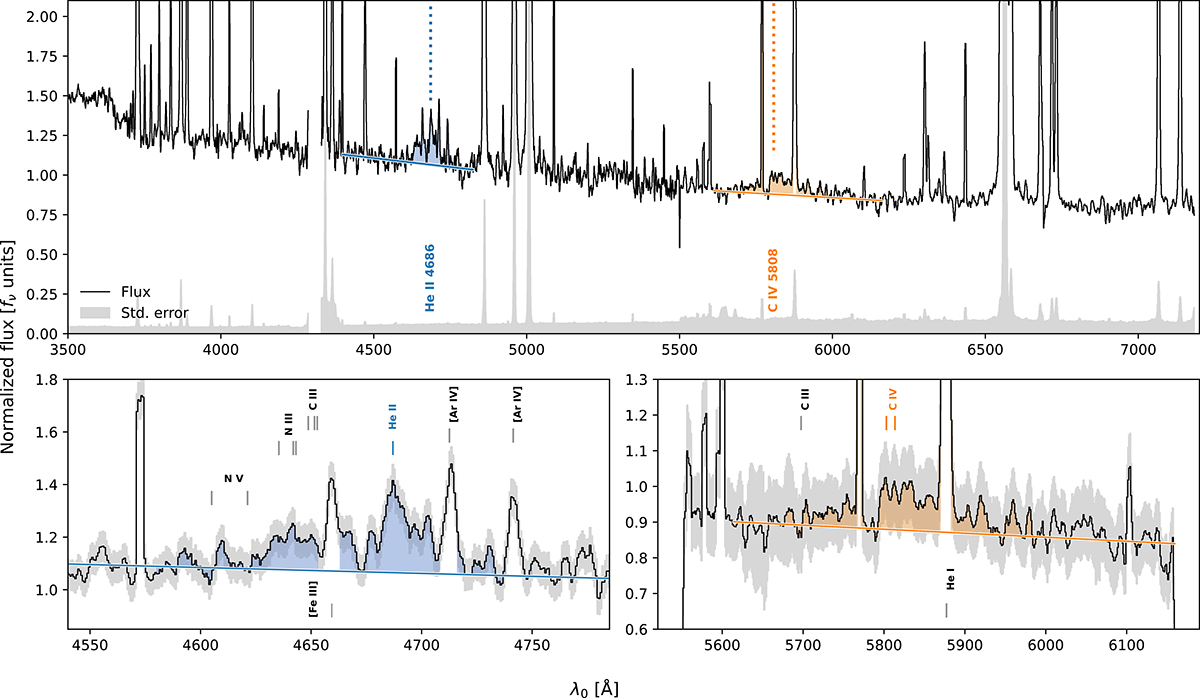
Extracted and stacked spectrum of the Sunburst LCE cluster, zoomed into the continuum to clearly show the blue and orange WR bumps. Blueward of 5500 Å, only the G140H spectrum is shown; redward, only the G235H spectrum is shown. Almost all the spikes are emission lines. The best-fit continuum at each bump is shown in its corresponding color. Lower left: Detailed view of the blue WR bump. The gray shading shows the ±1σ errors. A number of emission line centroids are marked. Lower right: Similar detailed view of the orange WR bump, centered on the C IVλλ 5801,5812 Å feature. On its red side is a He IIλ 5875 emission line; on its blue side is an instrument artifact. The blue and orange shading of the bumps is mainly to guide the eye.
Current usage metrics show cumulative count of Article Views (full-text article views including HTML views, PDF and ePub downloads, according to the available data) and Abstracts Views on Vision4Press platform.
Data correspond to usage on the plateform after 2015. The current usage metrics is available 48-96 hours after online publication and is updated daily on week days.
Initial download of the metrics may take a while.