Fig. 1.

Download original image
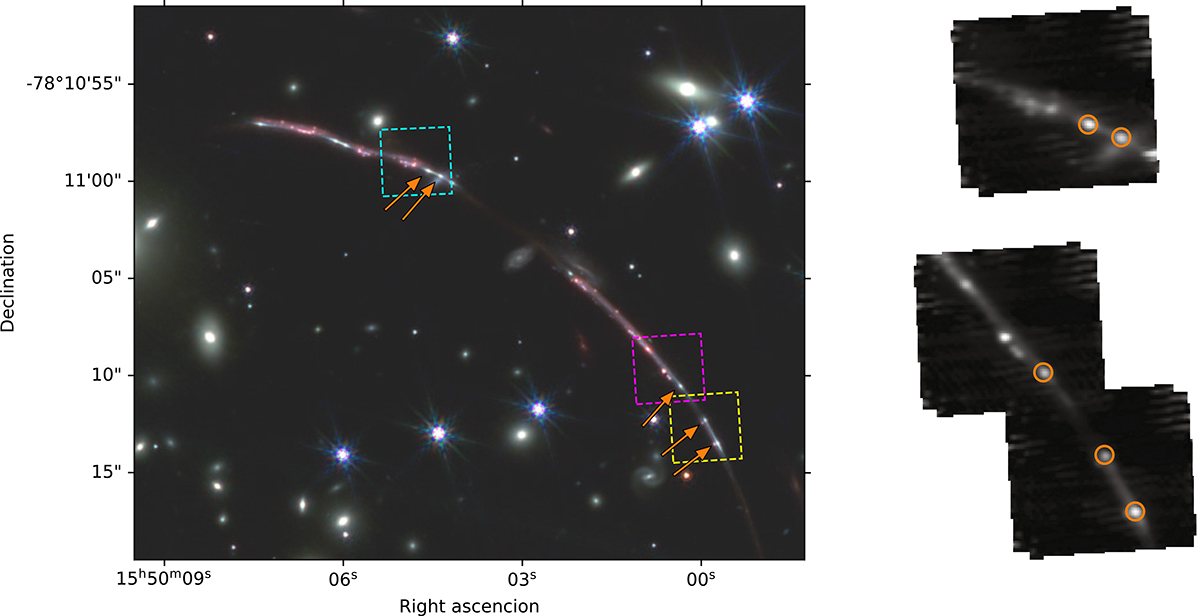
Overview of the arc. Left: NIRCam RGB composite of the N and NW arc segments, with R, G, B being F444W, F200W, and F115W, respectively, together covering the rest-frame wavelength range 3400–13 000 Å. Dashed cyan, magenta, and yellow overlays show the approximate footprints of the three NIRSpec pointings 1, 2, and 3, respectively. Orange arrows show the images of the gravitationally lensed LCE cluster that were included in the stacked spectrum. Right: NIRSpec IFU continuum images of pointings 1 (top right) and combined pointings 2+3 (bottom right), created from a median stacking along the spectral axis of the F100L/G140H cubes. Orange circles mark the images of the LCE cluster included in the stacked spectrum.
Current usage metrics show cumulative count of Article Views (full-text article views including HTML views, PDF and ePub downloads, according to the available data) and Abstracts Views on Vision4Press platform.
Data correspond to usage on the plateform after 2015. The current usage metrics is available 48-96 hours after online publication and is updated daily on week days.
Initial download of the metrics may take a while.


