| Issue |
A&A
Volume 690, October 2024
|
|
|---|---|---|
| Article Number | A278 | |
| Number of page(s) | 10 | |
| Section | Interstellar and circumstellar matter | |
| DOI | https://doi.org/10.1051/0004-6361/202348962 | |
| Published online | 15 October 2024 | |
G321.3–3.9: A new supernova remnant observed with multi-band radio data and in the SRG/eROSITA All-Sky Surveys
1
International Centre for Radio Astronomy Research, Curtin University,
Bentley
WA
6102,
Australia
2
Max-Planck-Institut für extraterrestrische Physik,
Gießenbachstraße 1,
85748
Garching,
Germany
3
Max-Planck-Institut für Radioastronomie,
Auf dem Hügel 69,
53121
Bonn,
Germany
4
INAF – Osservatorio di Astrofisica e Scienza dello Spazio di Bologna,
via Piero Gobetti 93/3,
40129
Bologna,
Italy
★ Corresponding author; This email address is being protected from spambots. You need JavaScript enabled to view it.
Received:
15
December
2023
Accepted:
24
August
2024
Abstract
Aims. G321.3–3.9 was first identified as a partial shell at radio frequencies a few decades ago. Although it continued to be observed, no additional studies were undertaken until recently.
Methods. In this paper, we present results from a large selection of radio and X-ray data that cover the position of G321.3–3.9. We confirmed G321.3–3.9 as a new supernova remnant (SNR) using data collected by several radio surveys, spanning a frequency range from 200 to 2300 MHz. Stacked eROSITA data from four consecutive all-sky surveys (eRASS:4) provide spectro-imaging information in the energy band 0.2–8.0 keV.
Results. G321.3–3.9 has an elliptical shape with major and minor axes of approximately 1.°7 × 1.°1. From CHIPASS and S-PASS data, we calculate a spectral index α = −0.8 ± 0.2, consistent with synchrotron emission from an expanding shell in the radiative phase. The eROSITA data show an X-ray diffuse structure filling almost the entire radio shell. Based on our spectral analysis, we found the temperature to be approximately 0.6 keV and the column absorption density about 1021 cm−2. Comparing this absorption density to optical extinction maps, we estimated the distance to fall within the range of (1.0–1.7) kpc, considering the 1σ uncertainty range.
Key words: radiation mechanisms: non-thermal / ISM: supernova remnants / ISM: individual objects: G321.3–3.9
© The Authors 2024
 Open Access article, published by EDP Sciences, under the terms of the Creative Commons Attribution License (https://creativecommons.org/licenses/by/4.0), which permits unrestricted use, distribution, and reproduction in any medium, provided the original work is properly cited.
This article is published in open access under the Subscribe to Open model. This email address is being protected from spambots. You need JavaScript enabled to view it. to support open access publication.
1 Introduction
Supernova remnants (SNRs) (see Dubner & Giacani 2015, for a detailed review) significantly contribute to the chemical and physical evolution of the Galaxy. The material and energy released during an explosion interact with the interstellar medium (ISM), generating a shock wave that expands more or less spherically depending on the ISM density and the evolutionary phase of the remnant (originally described by Woltjer 1972).
A census of SNRs is regularly updated by Green (2019)1. Confirmed and candidate sources are included along with a summary of their main properties: position, flux density (S ∝ vα), size, and spectral index. The December 2019 version contains 294 confirmed objects and ≃300 possible candidates detected in radio, optical, X-ray, and γ-ray. Most of the sources we know have been identified using radio observations where electrons lose energy slowly and remain visible for up to 150000 years. Recently, modern instruments such as the Murchison Widefield Array (MWA; Tingay et al. 2013; Wayth et al. 2018), the Australian Square Kilometre Array Pathfinder (ASKAP), and the Low-Frequency Array (LOFAR) have improved the sensitivity and resolution of surveys and have enabled the identification of new low surface brightness SNRs such as Hoinga (Becker et al. 2021), G118.4+37.0 (Arias et al. 2022), and G288.8–6.3 (Filipović et al. 2023). The objects are all located at high Galactic latitudes with a confirmed counterpart at X-ray and/or γ-ray energies, which provided us with a clearer understanding of the ongoing processes within the source.
In this paper we illustrate the identification of SNR G321.3–3.9, which appears as an extended structure filling the radio shell, via multi-band radio data and its simultaneous detection in X-ray data. G321.3–3.9 has been detected and classified as a SNR candidate three times. The first time was by Duncan et al. (1997) using a polarimetric radio continuum survey at 2.4 GHz taken with the Parkes 64 m radio telescope. The survey covers a region of the sky between 238° < l < 365° and |b| < 5° with a resolution of 10.4′. The authors classified the object as a partial elliptical structure with a size of ![Mathematical equation: $\[1^{\circ}_\cdot8 \times 1^{\circ}_\cdot3\]$](/articles/aa/full_html/2024/10/aa48962-23/aa48962-23-eq2.png) , showing a well-defined arc on the southeastern side. G321.3–3.9 was detected for the second time during the second epoch Molonglo Galactic Plane Survey (MGPS-2; Green et al. 2014) at 843 MHz, as one of the 23 SNR candidates the authors identified along the Galactic plane. They described G321.3–3.9 as an elliptical and almost complete shell with size of 109 × 64 arcmin2 (
, showing a well-defined arc on the southeastern side. G321.3–3.9 was detected for the second time during the second epoch Molonglo Galactic Plane Survey (MGPS-2; Green et al. 2014) at 843 MHz, as one of the 23 SNR candidates the authors identified along the Galactic plane. They described G321.3–3.9 as an elliptical and almost complete shell with size of 109 × 64 arcmin2 (![Mathematical equation: $\[1^{\circ}_\cdot8 \times 1^{\circ}_\cdot1\]$](/articles/aa/full_html/2024/10/aa48962-23/aa48962-23-eq3.png) ), peak flux of 10 mJy/arcmin2, and total integrated flux density greater than 0.37 Jy. For the third detection, a deep optical RGB composed of [O III], Hα, and [S II] emission-line images of G321.3–3.9 was reported by Fesen et al. (2024), in which the remnant structure reveals strong optical filaments. The detected emission lines typically characterize SNR regions where radiative shocks occur, in other words, shocks that have significantly reduced their velocity (<200 km/s) and are consequently associated with old objects. Here we confirm the identification of this SNR through the use of modern surveys conducted with the MWA at 200 MHz and the eROSITA instrument (Predehl et al. 2021) on board the Russian-German Spectrum-Roentgen-Gamma spacecraft (Sunyaev et al. 2021), as well as other archival and publicly accessible radio surveys.
), peak flux of 10 mJy/arcmin2, and total integrated flux density greater than 0.37 Jy. For the third detection, a deep optical RGB composed of [O III], Hα, and [S II] emission-line images of G321.3–3.9 was reported by Fesen et al. (2024), in which the remnant structure reveals strong optical filaments. The detected emission lines typically characterize SNR regions where radiative shocks occur, in other words, shocks that have significantly reduced their velocity (<200 km/s) and are consequently associated with old objects. Here we confirm the identification of this SNR through the use of modern surveys conducted with the MWA at 200 MHz and the eROSITA instrument (Predehl et al. 2021) on board the Russian-German Spectrum-Roentgen-Gamma spacecraft (Sunyaev et al. 2021), as well as other archival and publicly accessible radio surveys.
The structure of the paper is as follows. The radio observations and analysis are described in Section 2, including archival data for calculating the spectral index of the SNR. In Section 3 we describe the eROSITA X-ray detection and analysis. In Sections 4 and 5 we summarize the results and main properties of SNR G321.3–3.9 and present our conclusions.
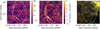 |
Fig. 1
|
![Mathematical equation: $\[3^{\circ}_\cdot5 \times 3^{\circ}_\cdot5\]$](/articles/aa/full_html/2024/10/aa48962-23/aa48962-23-eq4.png)
2 Radio data
Following the identification of the candidate in the Galactic Plane Monitoring (GPM) data (see Section 2.1), we searched all other archival surveys to detect this SNR candidate. In addition to MGPS-2, we identified it in the Continuum HI Parkes All-Sky Survey (CHIPASS; Calabretta et al. 2014), and the S-band Polarisation All Sky Survey (S-PASS; Carretti et al. 2019), which we used in the analysis for this paper and are described below. It was also detected in the Rapid ASKAP Continuum Survey (RACS; McConnell et al. 2020) and the Evolutionary Map of the Universe (EMU Norris et al. 2021), although the data was unsuitable for our analysis. For completeness, the images from these two surveys can be found respectively in Appendices B and C.
2.1 GPM
From July to September 2022, a GPM campaign across 185–215 MHz (see Hurley-Walker et al., in prep., for additional information) was conducted with the MWA, covering approximately one-third of the southern Galactic plane with a biweekly cadence. The data collected were calibrated, imaged, and mosaicked, achieving a sensitivity of ≃1–2 mJy/beam, extremely low compared to previous radio surveys of the Galactic plane at MHz frequencies, as well as an angular resolution of 45″. The aim of the campaign was to identify transient sources in the Milky Way, particularly the long-period radio transients (Hurley-Walker et al. 2023). However, the information can be transferred to other science goals, such as studying SNRs. The observed sky area covers 285° < l < 70° and |b| < 16° for a total of 4600 degrees squared.
Using this image, it was possible to identify 21 SNR candidates, one of which is G321.3–3.9. The sampling criteria correspond to a first selection based on the morphology of the objects, typically a ring-shaped structure that could be more or less elongated depending on the condition of the medium surrounding it. Second, we compared this with infrared emission, which is essential for distinguishing between thermal and nonthermal sources. Commonly, thermal regions (particularly HII regions) can be incorrectly classified as SNRs due to the similarity in their morphology at radio frequencies. However, HII regions show a distinctive structure in the infrared bands, where an annulus region of polycyclic aromatic hydrocarbon radiation (dominant at ≃10 μm) surrounds the hot dust radiation at 24 μm. In this paper we present this particular SNR’s radio and X-ray properties.
G321.3–3.9 appears in the GPM image as an elliptical-shaped radio shell with major and minor diameters equal to ![Mathematical equation: $\[1^{\circ}_\cdot7\]$](/articles/aa/full_html/2024/10/aa48962-23/aa48962-23-eq5.png) and
and ![Mathematical equation: $\[1^{\circ}_\cdot1\]$](/articles/aa/full_html/2024/10/aa48962-23/aa48962-23-eq6.png) , respectively, and an inclination angle of about 125° from the west, as shown in the left panel of Figure 1. Due to the lack of short baselines in the survey, it is not possible to completely measure the flux density on large scales for these observations. As can be seen in the left panel of Fig. 1, only the left side of the shell appears to be above the background level. Therefore, it is not possible to accurately measure the radio flux density for this particular remnant with GPM data.
, respectively, and an inclination angle of about 125° from the west, as shown in the left panel of Figure 1. Due to the lack of short baselines in the survey, it is not possible to completely measure the flux density on large scales for these observations. As can be seen in the left panel of Fig. 1, only the left side of the shell appears to be above the background level. Therefore, it is not possible to accurately measure the radio flux density for this particular remnant with GPM data.
2.2 MGPS-2
The middle panel of Fig. 1 shows the detection of G321.3–3.9 in the MGPS-2, a deep radio survey of the entire sky south of declination −30 degrees, made using the Molonglo Observatory Synthesis Telescope (MOST Mills 1981) at 843 MHz. MGPS-2 has a resolution that varies with declination: 45" × 45" csc |δ| and a noise level of ~ 1 mJy beam−1. We downloaded2 the extended source map to create a ![Mathematical equation: $\[3^{\circ}_\cdot5 \times 3^{\circ}_\cdot5\]$](/articles/aa/full_html/2024/10/aa48962-23/aa48962-23-eq7.png) cutout around the SNR candidate. Similarly to the GPM image, the remnant appears as a nonfilled shell, with the left portion of the shell being brighter than the rest of the structure. The MOST telescope does not measure the correlations on baselines shorter than 42.9λ, making extended sources with an angular scale larger than ≃20′ not detectable by the instrument, and therefore it is impossible to calculate the flux density accurately. Only a lower limit can be provided (as mentioned in Section 1).
cutout around the SNR candidate. Similarly to the GPM image, the remnant appears as a nonfilled shell, with the left portion of the shell being brighter than the rest of the structure. The MOST telescope does not measure the correlations on baselines shorter than 42.9λ, making extended sources with an angular scale larger than ≃20′ not detectable by the instrument, and therefore it is impossible to calculate the flux density accurately. Only a lower limit can be provided (as mentioned in Section 1).
2.3 CHIPASS
CHIPASS covers the entire sky south of declination +25° and operates at a central frequency of 1394.5 MHz with a sensitivity of 40 mK. This survey provides an excellent tool for measuring the total power of extended objects. We downloaded3 the extended source map to create a ![Mathematical equation: $\[3^{\circ}_\cdot5 \times 3^{\circ}_\cdot5\]$](/articles/aa/full_html/2024/10/aa48962-23/aa48962-23-eq8.png) cutout around the SNR candidate, which we then regridded to match the GPM mosaic (left panel of Fig. 2).
cutout around the SNR candidate, which we then regridded to match the GPM mosaic (left panel of Fig. 2).
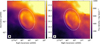 |
Fig. 2
|
![Mathematical equation: $\[3^{\circ}_\cdot5 \times 3^{\circ}_\cdot5\]$](/articles/aa/full_html/2024/10/aa48962-23/aa48962-23-eq9.png)
2.4 S-PASS
S-PASS operates at a central frequency of 2303 MHz with a sensitivity of 9 mK. S-PASS covers the entire southern sky with declination lower than −1°. This survey is particularly useful because it can detect polarized radio emission, given information regarding the magnetic field in the region of the sky under examination. We downloaded4 the Stokes I source map to create a ![Mathematical equation: $\[3^{\circ}_\cdot5 \times 3^{\circ}_\cdot5\]$](/articles/aa/full_html/2024/10/aa48962-23/aa48962-23-eq10.png) cutout around the SNR candidate, which we then regridded to match the GPM mosaic (right panel of Fig. 2). Stokes Q and U were not used in the principal analysis, but are reported in Appendix A.1 for completeness.
cutout around the SNR candidate, which we then regridded to match the GPM mosaic (right panel of Fig. 2). Stokes Q and U were not used in the principal analysis, but are reported in Appendix A.1 for completeness.
2.5 Radio spectral analysis
We now describe how we calculated the spectral index of G321.3–3.9 using the CHIPASS and S-PASS detections shown in Fig. 2. These maps were chosen for this calculation because the single-dish data measure the total flux density of the source and do not “resolve out” the structure, as is the case for interferometric measurements. A spectral index of −1.1 < α < −0.1 characterizes radio SNR shells (Dubner & Giacani 2015); thus, a measurement falling in this range will further support the nonthermal nature of G321.3–3.9.
Initially, we needed to remove any flux density contributions from point sources within the extent of the SNR. This was done by subtracting the point sources at locations identified in the higher-resolution MGPS-2 data from the CHIPASS and S-PASS images. The point sources were identified within ![Mathematical equation: $\[2^{\circ}_\cdot3\]$](/articles/aa/full_html/2024/10/aa48962-23/aa48962-23-eq11.png) of G321.3–3.9 using the algorithm Aegean, which utilizes background and noise models previously generated with BANE (see Hancock et al. 2012, 2018, for technical details) to detect significant pixels in the image and to create a catalog of sources giving, among other things, coordinates, peak flux, and integrated flux.
of G321.3–3.9 using the algorithm Aegean, which utilizes background and noise models previously generated with BANE (see Hancock et al. 2012, 2018, for technical details) to detect significant pixels in the image and to create a catalog of sources giving, among other things, coordinates, peak flux, and integrated flux.
We then applied the three following steps:
convolution of the catalog created to match the resolution of CHIPASS and S-PASS;
creation of a FITS image in the same sky frame with the model of the sources to subtract assuming a spectral index value corresponding to the median local value of −0.83 (according to the source catalog of the southern sky presented in Mauch et al. 2003) fixing the error to the width of the spectral distribution;
subtraction of the model from the original CHIPASS and S-PASS images.
At this point, we converted the CHIPASS and S-PASS image units from Kelvin to Jansky, and we applied the POLYGON_FLUX (Hurley-Walker et al. 2019)5 software to measure the flux density of the remnant in both surveys. The polygon selection around the source is the dominant source of error6, so we measured the flux density of the SNR ten times. The flux density has been assumed to be the average of these measurements, and the uncertainty is calculated as the standard deviation of this data set. The results are reported in Table 1; as expected for a nonthermal source, the SNR is brighter at lower frequencies.
The two data points were fitted with a power law using the propagation of the errors to determine the uncertainty, yielding a spectral index value of α = −0.8 ± 0.2. We also cross-checked this result with infrared data. The two higher bands (at 22 μm and 12 μm) of the all-sky survey release of the Wide-field Infrared Survey Explorer (WISE Wright et al. 2010) provide images in the sky area of G321.3–3.9. These do not show the typical HII region morphology of a central region bright at 22 μm and a ring of 12 μm emission from excited PAHs, as shown in the right panel of Fig. 1. We thus confirm that the radio emission is from nonthermal radiation.
Integrated flux densities of G321.3–3.9 from the CHIPASS and S-PASS detections used to calculate the SNR spectral index.
3 eROSITA observations of G321.3–3.9
The X-ray data we report here were taken during the first four eROSITA all-sky surveys eRASS:4 (Predehl et al. 2021; Sunyaev et al. 2021). G321.3–3.9 was mapped in 80 telescope passages in the following date intervals: March 6–9 and September 5–8, 2020; February 23–25 and August 30-September 02, 2021. These observations resulted in an averaged vignetting-corrected exposure time of 710 s (~177 s per sky survey). eROSITA is an array of seven X-ray telescopes observing the same sky region. Each telescope has a detector module. The detectors of telescope modules (TM) 1, 2, 3, 4, and 6 differ from the detectors of modules TM5 and TM7 by having an on-chip filter; hence, each detector has a slightly different detector response. In addition, detector modules 5 and 7 are partially affected by a light leak, depending on the telescope’s orientation with respect to the Sun. We verified that this was not a problem for the observation of G321.3–3.9, so we used all the data from eROSITA’s seven telescope modules in the X-ray image reconstruction. These data were processed by the eROSITA Standard Analysis Software (eSASS) pipeline (Brunner et al. 2022) with the processing number #020. For the data analysis, we used the standard tasks available in eSASS version 211214 (released on December 21, 2021)7 The eSASS pipeline divides X-ray data into 4700 partly overlapping sky tiles of ![Mathematical equation: $\[3^{\circ}_\cdot6 \times 3^{\circ}_\cdot6\]$](/articles/aa/full_html/2024/10/aa48962-23/aa48962-23-eq12.png) each. These are numbered using six digits, three for RA and three for Dec, representing the sky tile center position in degrees. G321.3–3.9 falls into the eRASS sky tile numbered 231150.
each. These are numbered using six digits, three for RA and three for Dec, representing the sky tile center position in degrees. G321.3–3.9 falls into the eRASS sky tile numbered 231150.
Figure 3 depicts a composite X-ray-radio RGB image of G321.3–3.9, color-coded according to the energy of the detected photons. To produce the figure, we first created single-band pictures for the three energy bands 0.2–0.7 keV, 0.7–1.2 keV, and 1.2–8.0 keV. As there was no significant emission in the 1.2–8.0 keV band, we loaded the MWA radio image taken at 200 MHz into the blue channel to create the RGB image shown in Figure 3. eROSITA’s field of view had an average angular resolution of 26″ during its all-sky survey mode. The spatial binning in the R- and G-bands of Figure 3 was set to 20″ to limit the slight resolution reduction by the smoothing process.
To enhance the visibility of diffuse X-ray emission to its largest extent, we applied the adaptive kernel smoothing algorithm of Ebeling et al. (2006) with a Gaussian kernel of 3.5 σ after point-source removal in each of the single-band images. We further computed the vignetting corrected exposure maps for the R- and G- eROSITA bands and applied the vignetting correction to the corresponding images. The cut values used for the R- and G-bands are at (1.53–5.47) × 10−5 cts/s and (2.04–12.13) × 10−5 cts/s, respectively. As can be seen from Figure 3, diffuse X-ray emission fills a large part of the inner remnant region, partly overlapping with the remnant’s radio emission in the MWA image taken at 200 MHz in the west and southeast. We also found a similar structure in the ROSAT all-sky survey, which has made this source a target in our ROSAT SNR candidate list. As the quality of the eROSITA data supersedes those from the ROSAT all-sky survey, we did not include the ROSAT data in this publication. Galactic absorption, eROSITA’s energy response, and the remnant’s energy emission spectrum result in a more substantial X-ray flux at medium energies (0.7–1.2 keV) than in the soft and hard bands. In addition we checked the XMM-Newton and Chandra data archives. We found an 11.6 ks XMM-Newton observation covering the northern region of G321.3–3.9. A short report about these data can be found in Appendix D.
We performed the X-ray spectral analysis using PyXSPEC, the Python implementation of XSPEC (Arnaud 1996). The data extraction was limited to eROSITA TMs 1–4 and 6 because of the potential light leak in TM5 and TM7, which makes their spectral calibration uncertain. For spectral fitting, we used the Cash statistic (Cash 1979) as implemented in XSPEC, presenting errors at 1σ confidence levels. The CSTAT/d.o.f. (degrees of freedom) value was employed to assess the quality of the fit.
To exclude unrelated point source contributions in our spectral analysis to the largest extent possible, we removed all point sources located within the remnant boundaries if they had a logarithmic detection likelihood threshold of DETLIKE = – ln(P) ≥ 70. This threshold might appear stringent, but it is necessary to avoid the inclusion of numerous spurious point sources, mainly because the source detection algorithm treats diffuse emission as a plethora of individual point sources. The remaining fainter point source contributions detected with a likelihood <70 are considered to be negligible relative to the overall emission of the SNR. All identified point sources were masked out using circular regions with a radius of 120″. The radius was chosen according to the instrument’s point spread function.
The diffuse X-ray emission of the remnant was extracted from a polygonal region encompassing the remnant with additional analysis in three internal regions labeled A, B, and C (see Fig. 4). The background was extracted from a scaled polygonal region surrounding the source region, approximately 30% larger than the original source-surrounding polygon. This region includes surrounding diffuse X-ray sources to the north and west of the remnant, potentially introducing contamination into the analysis. Therefore, we also tested an alternative background region located to the east of the remnant, where no contaminating X-ray diffuse emission was observed. The results of the spectral analysis remained consistent within the margins of error.
The background spectral model considered the contribution from the instrumental background, a fixed absorbed extragalactic X-ray background, and a thermal background component (see, e.g., Mayer et al. 2023 for further details). For our source spectral models, the first tested was vpshock, a constant temperature plane-parallel shock plasma model (Borkowski et al. 2001). The absorption component was modeled with the TBabs model (Wilms et al. 2000). The second model, TBabs*vapec, represents an emission spectrum from collisionally ionized diffuse gas, while the third model, TBabs*vnei, is a nonequilibrium ionization collisional plasma model. In all the models, we allowed the abundance of O, Ne, Mg, Si, and Fe to vary, keeping the other elements frozen at solar values.
The limited photon statistics of G321.3–3.9 in the eROSITA survey data allow only approximate spectral modeling. The models all fitted the data with a comparable goodness of fit, as detailed in Table 2, reflecting the challenges in distinguishing between different physical emission scenarios.
Among the tested spectral models, the temperature and the absorption column density (NH) were found to be consistent with values of approximately 0.6 keV and 1021 cm−2, respectively, within a 2 σ error range. While temperatures show consistently small errors among all fitted models, abundances are determined with larger uncertainties due to the limited photon statistics. A noticeable scarcity of Ne and Mg is common to all fitted spectral models. Unlike Mg, Ne cannot be depleted into dust grains (Hwang et al. 2008). To test the spectral results for their dependencies on the abundances of these elements, we fixed Ne and/or Mg to a solar value. Specifically, when fixing both Ne and Mg, CSTAT deteriorated by ΔC = 44 for vpshock, ΔC = 16 for vapec, and ΔC = 17 for vnei; the errors of the fitted abundances of the other elements became larger, the normalization decreased by a factor of 10, and the temperature increased to a high value of 1 keV. Fixing only Ne led to similar effects.
Assuming that the X-ray emission is dominated by emission from the ejecta, this may suggest a thermonuclear supernova origin, as core-collapse supernovae typically exhibit a higher ratio of Ne and Mg to Fe (see, e.g., Fig. 2.8 in Vink 2020). However, determining whether the X-ray emission is dominated by the ejecta or by circumstellar and/or interstellar material requires further analysis. The spectral fit obtained using the absorbed vapec model is shown in Fig. 5, whereas the fitting results of all tested models are listed in Table 2.
The fitting results for the subregions demonstrate notable consistency in temperature and absorption (see Table 3). The temperature remains around 0.6 keV and hydrogen column density NH ~ 1021 cm−2 for the vapec model, with variations within the 1 σ error range.
It should be noted that, from the physical point of view, the vpshock model is likely not applicable in the case of G321.3–3.9 since it is probably an older remnant in the radiative phase, as is discussed below. However, we present the results of all tested spectral models for completeness and reference of the reader.
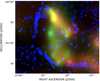 |
Fig. 3 Composite RGB image of G321.3–3.9 as seen in the eROSITA all-sky surveys eRASS:4 and the MWA radio image taken at 200 MHz. The X-ray photons to produce the image were color-coded according to their energy (red for energies 0.2–0.7, green for 0.7–1.2 keV), whereas the MWA image of G321.3–3.9 is shown in the blue channel. |
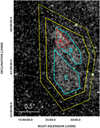 |
Fig. 4 eRASS:4 smoothed image of G321.3–3.9 in the 0.5–2.4 keV energy range with regions used for the eROSITA X-ray spectral analysis. The main source region is the solid yellow polygon surrounding the SNR. The point sources subtracted from the field are highlighted by a green circle with a red line in the center. The background region is the area between that polygon and the bigger dotted polygon. |
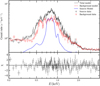 |
Fig. 5 X-ray spectrum of G321.3–3.9 obtained with eROSITA. The fit model is TBabs*vapec. |
Best fit parameters with 1σ errors obtained with different models; O, Ne, Mg, Si, and Fe were left free to vary.
Best fit parameters with 1σ errors obtained with a TBabs*vapec model; O, Ne, Mg, Si, and Fe were left free to vary.
4 Discussions
4.1 SNR classification confirmation
Detecting a Galactic SNR candidate in a single frequency band may not confirm its nature definitively; data across multiple wavelengths is crucial for the conclusive identification of the candidate as a remnant. Infrared wavelengths help to ascertain whether the radio emission is thermal or nonthermal; X-rays reveal the object’s chemical composition and highlight regions where particle acceleration occurs. G321.3–3.9 shows an extended structure at low X-ray energies surrounded by a radio shell, and it does not present any diffuse emission in the infrared.
The radio flux density has not been determined in the GPM and MGPS-2 data because the signal-to-noise ratio was insufficient for detection. A two-point spectral index was calculated using 1.4 and 2.3 GHz flux density data, obtaining a value of α = −0.8 ± 0.2. The negative value thus obtained is consistent with nonthermal synchrotron emission, as expected from a shell-type SNR.
4.2 Distance and age estimates
Given that G321.3–3.9 does not have positional coincidences with HI, HII, and molecular clouds, providing a distance estimate to the remnant is difficult. However, we can determine a lower and upper limit by applying the studies conducted by Case & Bhattacharya (1998) on SNRs in the Magellanic Clouds. The authors show that SNRs at 1.4 GHz typically have luminosity values in the range 5 × 10¹⁴ < L1.4 GHz < 1017 W Hz−1. If we suppose that the shell has a luminosity greater than the lower value of this range, using the relation
![Mathematical equation: $\[D=\sqrt{\frac{L_{1.4 ~\mathrm{GHz}}}{4 \pi S_{1.4 ~\mathrm{GHz}}}},\]$](/articles/aa/full_html/2024/10/aa48962-23/aa48962-23-eq61.png) (1)
(1)
we can determine its distance from Earth (i.e., D ≳ 700 pc). Furthermore, if we consider the greatest diameter that a radio SNR could have (i.e., 100 pc) (Badenes et al. 2010), by applying straightforward calculations we can determine that its distance from Earth must be D < 3.4 kpc. Using this result in the formula above, we obtain an upper limit on the luminosity of L1.4 ghz < 1.3 × 10¹⁶ W Hz−1.
We also used the results of the X-ray spectral analysis to estimate the distance to the remnant. Although the limited photon statistics do not allow us to constrain the tested spectral models, we estimated the column absorption density NH toward G321.3–3.9 to fall within the range of (0.9–1.9) × 1021 cm−2, considering 1σ uncertainties. Employing the relation proposed by Zhu et al. (2017),
![Mathematical equation: $\[N_{\mathrm{H}}\left[\mathrm{~cm}^{-2} / A_v\right]=(2.08 \pm 0.02) \times 10^{21},\]$](/articles/aa/full_html/2024/10/aa48962-23/aa48962-23-eq62.png) (2)
(2)
we derived an anticipated extinction of Av ~ (0.4–0.9). This extinction value corresponds to a distance range of (1.0–1.7) kpc when compared to the Gaia data set of Lallement et al. (2019) using the tool available online8, as shown in Fig. 6.
We used the SNR evolutionary model calculator developed by Leahy & Williams (2017) to estimate an age limit for G321.3–3.9. The shell is situated close enough to the Galactic plane; consequently, we can assume an ISM density of 1.0 cm−3 following the studies conducted by Zhu et al. (2017) who analyzed the distribution of the hydrogen in the Galaxy using hundreds of SNRs for which the distance and the column density is well known. Furthermore, we used a standard value for the electron temperature of 100 K. For a distance of 1.0 < D < 1.7 kpc (corresponding to a diameter ranging between 15 pc and 25 pc), the interval of possible ages falls between 13.7 < t < 70.1 kyr. The transition time between the Sedov-Taylor and radiative phases, in this condition, is estimated to happen at ~ 13 kyr, suggesting that the SNR is dominated by radiative mechanisms and that the X-ray map is predominantly composed of the hot gas left behind by the shock wave interaction with the medium. This is further supported by the mixed morphology of G321.3–3.9, which shows a shell structure in the radio and a filled center in X-rays. Additionally, the bright optical filaments discovered by Fesen et al. (2024) also indicate that G321.3–3.9 is in the radiative-snow-plow phase (Vink 2020).
To have a more accurate estimate of the shell’s distance, we also checked whether a pulsar could be associated with it. Due to its proximity to the Galactic plane latitudes, we examined an area within a 2° radius from the remnant’s geometric center. This choice aligns with the maximum distance from the remnant’s center that a pulsar could have reached of approximately 2°. 4 if we consider the edge case of a source at the same distance from Earth as the SNR (1.7 kpc), with an age of 70.1 kyr and a maximum proper motion of 1000 km/s. We compared it to the Australia Telescope National Facility pulsar catalog v1.70 (Manchester et al. 2005)9. None of the pulsars in the same region have age or proper motion parameters that could be related to a SNR of the size of G321.3–3.9. We performed PARKES follow-up observations in the Ultra-Wideband Low (UWL) search mode using the MEDUSA back-end at 1.5 GHz to explore the possibility of a pulsar association within the remnant shell without any specific candidate in mind. There is no discernible evidence of a compact object inside the shell at the selected observing frequency. We evaluated the sensitivity of our observations by utilizing the pulsar version of the radiometer equation to determine the limiting flux density (as specified in Lorimer & Kramer 2004). The minimum detectable flux density obtained is 0.02 mJy at a signal-to-noise ratio (S/N) of 5, leading to the exclusion of pulsars at this brightness. From the G321.3–3.9 X-ray spectra, we conclude that the SNR progenitor corresponds to a Type Ia supernova, which is in line with the likely absence of a compact remnant associated with it.
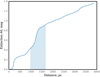 |
Fig. 6 Extinction A0 in the direction of G321.3–3.9 as provided by the Gaia/2MASS extinction map. The blue shaded area is the distance corresponding to the extinction range derived from hydrogen column density obtained from our X-ray spectral analysis. |
5 Conclusions
The re-discovery of the SNR candidate G321.3–3.9 in the radio band with the MWA/GPM survey and in X-rays in eROSITA data lets us confirm with a high level of confidence the nature of the object itself. This work successfully demonstrates how a multi-wavelength study of astronomical objects can confirm their classification. Radio observations alone would not have been enough to establish the real origin of the observed diffuse emission. Still, identifying diffuse X-ray emission within the shell and measuring a negative spectral index in archival radio data have provided the required support for a conclusive SNR classification. The independent re-discovery of the remnant in optical by Fesen et al. (2024) strengthens our result.
We will continue to search for more radio and X-ray bright SNR candidates along the plane, identified through combined studies of MWA and eROSITA survey data. Future wide-field low-frequency radio surveys would help reduce the discrepancy between observations and theoretical calculations in the SNR population. The falling spectra of these synchrotron sources make them brighter at low frequencies. This enables us to identify fainter and older remnants that may have a surface brightness that are too low to be detectable at higher radio frequencies. The Square Kilometer Array (SKA) is a strong example of instrumentation that would make a difference in supernova remnant detection as it will cover a frequency range of 50–350 MHz with a resolution of 2 arcsec and a sensitivity of ~20 μJy/beam. The shortest baseline of the new interferometer will vary between 45 and 18 meters, respectively, if full stations or a subset are used, leading to a maximum angular scale between 1 and 3 degrees.
Acknowledgements
We want to thank the referee for the comments that helped to improve the paper. NHW is supported by an Australian Research Council Future Fellowship (project number FT190100231) funded by the Australian Government. AK thanks Martin G. F. Mayer for the helpful discussions and suggestions. AK acknowledges support from the International Max-Planck Research School (IMPRS) on Astrophysics at the Ludwig-Maximilians University (IMPRS). LN acknowledges support from the Deutsche Forschungsgemeinschaft through the grant BE 1649/11-1. This work has made use of S-band Polarisation All Sky Survey (S-PASS) data and the Continuum HI Parkes All-Sky Survey. This work is based on data from eROSITA, the soft X-ray instrument aboard SRG, a joint Russian-German science mission supported by the Russian Space Agency (Roskosmos), in the interests of the Russian Academy of Sciences represented by its Space Research Institute (IKI), and the Deutsches Zentrum für Luftund Raumfahrt (DLR). The SRG spacecraft was built by Lavochkin Association (NPOL) and its subcontractors and is operated by NPOL with support from the Max Planck Institute for Extraterrestrial Physics (MPE). The development and construction of the eROSITA X-ray instrument was led by MPE, with contributions from the Dr. Karl Remeis Observatory Bamberg & ECAP (FAU Erlangen-Nuernberg), the University of Hamburg Observatory, the Leibniz Institute for Astrophysics Potsdam (AIP), and the Institute for Astronomy and Astrophysics of the University of Tübingen, with the support of DLR and the Max Planck Society. The Argelander Institute for Astronomy of the University of Bonn and the Ludwig Maximilians Universität Munich also participated in the science preparation for eROSITA. The eROSITA data shown here were processed using the eSASS software system developed by the German eROSITA consortium. This scientific work uses data obtained from Inyarrimanha Ilgari Bundara / the Murchison Radio-astronomy Observatory. We acknowledge the Wajarri Yamaji People as the Traditional Owners and native title holders of the Observatory site. CSIRO’s ASKAP radio telescope is part of the Australia Telescope National Facility (https://ror.org/05qajvd42). Operation of ASKAP is funded by the Australian Government with support from the National Collaborative Research Infrastructure Strategy. ASKAP uses the resources of the Pawsey Supercomputing Research Centre. Establishment of ASKAP, Inyarrimanha Ilgari Bundara, the CSIRO Murchison Radio-astronomy Observatory and the Pawsey Supercomputing Research Centre are initiatives of the Australian Government, with support from the Government of Western Australia and the Science and Industry Endowment Fund. This paper includes archived data obtained through the CSIRO ASKAP Science Data Archive, CASDA (https://data.csiro.au).
Appendix A Polarization
The radiation coming from SNRs is linearly polarized. Ideally, it could be possible to determine the orientation of the magnetic field in the plane of the sky, as has been done by Shanahan et al. (2022). However, Faraday rotation changes the electric field’s orientation due to the interaction with the ISM present in the same sky area and along the line of sight, changing the orientation of the signal we receive. In addition, Faraday rotation is inversely proportional to the frequency, becoming important at low radio frequencies.
We examined by eye the remnant’s Stokes Q and U images to verify if linear polarization, respectively, is present at ±90° and ±45° angles. We could not determine the magnetic field vectors and strength because we only had data at a single frequency. We could, instead, morphologically identify a region of linear polarization in coincidence with the bottom-left branch of G321.3–3.9 shell. We determine the total polarization fraction (see Fig. A.1) as: ![Mathematical equation: $\[p=\frac{\sqrt{U^2+Q^2}}{I}\]$](/articles/aa/full_html/2024/10/aa48962-23/aa48962-23-eq63.png) , obtaining a value of p = 15%.
, obtaining a value of p = 15%.
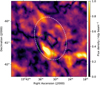 |
Fig. A.1 Total linear polarization of |
![Mathematical equation: $\[3^{\circ}_\cdot5 \times 3^{\circ}_\cdot5\]$](/articles/aa/full_html/2024/10/aa48962-23/aa48962-23-eq64.png)
Appendix B RACS
G321.3–3.9’s shell is also visible in the first data release of RACS at a frequency of ~ 888 MHz. The survey covers more than 34000 degrees2 with −90° < δ < +41°; its resolution and sensitivity, respectively, take value of ~ 15″ and 0.25 mJy beam−1. The mean total intensity map has been downloaded10 to create a ![Mathematical equation: $\[3^{\circ}_\cdot5 \times 3^{\circ}_\cdot5\]$](/articles/aa/full_html/2024/10/aa48962-23/aa48962-23-eq65.png) cutout around the SNR candidate. The structure can be seen in the left panel of Fig. B.1.
cutout around the SNR candidate. The structure can be seen in the left panel of Fig. B.1.
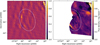 |
Fig. B.1
|
![Mathematical equation: $\[3^{\circ}_\cdot5 \times 3^{\circ}_\cdot5\]$](/articles/aa/full_html/2024/10/aa48962-23/aa48962-23-eq66.png)
Appendix C EMU
EMU is a wide-field radio continuum survey collected using the new Australian Square Kilometre Array Pathfinder (ASKAP) telescope. It is currently observing the southern sky at 944 MHz south of declination 30°. It observes the sky with a resolution of 15″ and a noise of 25 μJy/beam. It is the deepest survey we have so far, making it possible to distinguish the fine details of the internal structure of G321.3–3.9 as shown in the right panel of Fig. B.1. It is an ongoing project, so the sky region where G321.3–3.9 resides has not been completely observed yet, but the first image made available is already promising.
Appendix D XMM-Newton observation
Within a circle of 90′ diameter covering the SNR, ~ 180 X-ray point sources are detected in the eRASS:4 data. We inspected the XMM-Newton data archive for observations covering the SNR area. On March 21st, 2012 a ≃11.6 ks observation centered at RA = 15:33:20.710, Dec = −60:14:11.30 covered a 42′ × 42′ area in the northern part of the remnant. A total of 8 point sources are reported in the 4XMM-DR13 catalog (Webb et al. 2020). A few of them are also visible in the eROSITA images. The two strongest sources in the field are 4XMM J153254.1–601418 (S1) and 4XMM J153323.4–601019 (S2), with a cataloged 0.2–10 keV flux of (1.24 ± 0.18) × 10−13 erg cm−2 s−1, and (1.38 ± 0.34) × 10−13 erg cm−2 s−1, respectively.
Tranin et al. (2022) performed a Bayes classification of the XMM-Newton sources, and the produced catalog identifies both these sources as stars at a confidence level > 99%11. Considering the ~ 2″ positional uncertainty of the XMM-Newton detection, we identify them in the Gaia DR3 catalog (Gaia Collaboration 2022): S1 is a 13.1 Gmag M3-type star at a distance of ~ 67 pc and a high proper motion of ~ 118 mas yr−1, whereas S2 is a 10.8 Gmag rK3III-type giant star at a distance of ~ 1 kpc. High background level affecting the whole observation prevents us from using these data for diffuse emission studies.
References
- Arias, M., Botteon, A., Bassa, C. G., et al. 2022, A&A, 667, A71 [NASA ADS] [CrossRef] [EDP Sciences] [Google Scholar]
- Arnaud, K. A. 1996, in Astronomical Society of the Pacific Conference Series, 101, Astronomical Data Analysis Software and Systems V, eds. G. H. Jacoby, & J. Barnes, 17 [Google Scholar]
- Badenes, C., Maoz, D., & Draine, B. T. 2010, MNRAS, 407, 1301 [NASA ADS] [CrossRef] [Google Scholar]
- Becker, W., Hurley-Walker, N., Weinberger, C., et al. 2021, A&A, 648, A30 [NASA ADS] [CrossRef] [EDP Sciences] [Google Scholar]
- Borkowski, K. J., Lyerly, W. J., & Reynolds, S. P. 2001, ApJ, 548, 820 [Google Scholar]
- Brunner, H., Liu, T., Lamer, G., et al. 2022, A&A, 661, A1 [NASA ADS] [CrossRef] [EDP Sciences] [Google Scholar]
- Calabretta, M. R., Staveley-Smith, L., & Barnes, D. G. 2014, PASA, 31, e007 [Google Scholar]
- Carretti, E., Haverkorn, M., Staveley-Smith, L., et al. 2019, MNRAS, 489, 2330 [Google Scholar]
- Case, G. L., & Bhattacharya, D. 1998, ApJ, 504, 761 [NASA ADS] [CrossRef] [Google Scholar]
- Cash, W. 1979, ApJ, 228, 939 [Google Scholar]
- Dubner, G., & Giacani, E. 2015, A&A Rev., 23, 3 [NASA ADS] [CrossRef] [Google Scholar]
- Duncan, A. R., Stewart, R. T., Haynes, R. F., & Jones, K. L. 1997, MNRAS, 287, 722 [NASA ADS] [Google Scholar]
- Ebeling, H., White, D. A., & Rangarajan, F. V. N. 2006, MNRAS, 368, 65 [NASA ADS] [Google Scholar]
- Fesen, R. A., Drechsler, M., Strottner, X., et al. 2024, arXiv e-prints [arXiv:2403.00317] [Google Scholar]
- Filipović, M. D., Dai, S., Arbutina, B., et al. 2023, AJ, 166, 149 [CrossRef] [Google Scholar]
- Gaia Collaboration. 2022, VizieR Online Data Catalog, I/355 [Google Scholar]
- Green, D. A. 2019, J. Astrophys. Astron., 40, 36 [Google Scholar]
- Green, A. J., Reeves, S. N., & Murphy, T. 2014, PASA, 31, e042 [Google Scholar]
- Hancock, P. J., Murphy, T., Gaensler, B. M., Hopkins, A., & Curran, J. R. 2012, MNRAS, 422, 1812 [Google Scholar]
- Hancock, P. J., Trott, C. M., & Hurley-Walker, N. 2018, PASA, 35, e011 [Google Scholar]
- Hurley-Walker, N., Gaensler, B. M., Leahy, D. A., et al. 2019, PASA, 36, e048 [NASA ADS] [CrossRef] [Google Scholar]
- Hurley-Walker, N., Rea, N., McSweeney, S. J., et al. 2023, Nature, 619, 487 [NASA ADS] [CrossRef] [Google Scholar]
- Hwang, U., Petre, R., & Flanagan, K. A. 2008, ApJ, 676, 378 [NASA ADS] [CrossRef] [Google Scholar]
- Lallement, R., Babusiaux, C., Vergely, J. L., et al. 2019, A&A, 625, A135 [NASA ADS] [CrossRef] [EDP Sciences] [Google Scholar]
- Leahy, D. A., & Williams, J. E. 2017, AJ, 153, 239 [NASA ADS] [CrossRef] [Google Scholar]
- Lorimer, D. R., & Kramer, M. 2004, Handbook of Pulsar Astronomy, 4 [Google Scholar]
- Manchester, R. N., Hobbs, G. B., Teoh, A., & Hobbs, M. 2005, AJ, 129, 1993 [Google Scholar]
- Mauch, T., Murphy, T., Buttery, H. J., et al. 2003, MNRAS, 342, 1117 [Google Scholar]
- Mayer, M. G. F., Becker, W., Predehl, P., & Sasaki, M. 2023, A&A, 676, A68 [NASA ADS] [CrossRef] [EDP Sciences] [Google Scholar]
- McConnell, D., Hale, C. L., Lenc, E., et al. 2020, PASA, 37, e048 [Google Scholar]
- Mills, B. Y. 1981, PASA, 4, 156 [NASA ADS] [CrossRef] [Google Scholar]
- Norris, R. P., Marvil, J., Collier, J. D., et al. 2021, PASA, 38, e046 [NASA ADS] [CrossRef] [Google Scholar]
- Predehl, P., Andritschke, R., Arefiev, V., et al. 2021, A&A, 647, A1 [EDP Sciences] [Google Scholar]
- Shanahan, R., Stil, J. M., Anderson, L., et al. 2022, ApJ, 939, 92 [NASA ADS] [CrossRef] [Google Scholar]
- Sunyaev, R., Arefiev, V., Babyshkin, V., et al. 2021, A&A, 656, A132 [NASA ADS] [CrossRef] [EDP Sciences] [Google Scholar]
- Tingay, S. J., Goeke, R., Bowman, J. D., et al. 2013, PASA, 30, e007 [Google Scholar]
- Tranin, H., Godet, O., Webb, N., & Primorac, D. 2022, A&A, 657, A138 [NASA ADS] [CrossRef] [EDP Sciences] [Google Scholar]
- Vink, J. 2020, Physics and Evolution of Supernova Remnants [CrossRef] [Google Scholar]
- Wayth, R. B., Tingay, S. J., Trott, C. M., et al. 2018, PASA, 35, e033 [NASA ADS] [CrossRef] [Google Scholar]
- Webb, N. A., Coriat, M., Traulsen, I., et al. 2020, A&A, 641, A136 [NASA ADS] [CrossRef] [EDP Sciences] [Google Scholar]
- Wilms, J., Allen, A., & McCray, R. 2000, ApJ, 542, 914 [Google Scholar]
- Woltjer, L. 1972, ARA&A, 10, 129 [NASA ADS] [CrossRef] [Google Scholar]
- Wright, E. L., Eisenhardt, P. R. M., Mainzer, A. K., et al. 2010, AJ, 140, 1868 [Google Scholar]
- Zhu, H., Tian, W., Li, A., & Zhang, M. 2017, MNRAS, 471, 3494 [NASA ADS] [CrossRef] [Google Scholar]
We applied a mean background and an interpolated 2D plane. Since the variation between the two options is 3%, which is lower than the error caused by the polygon selection effects, we report here only the results obtained using a mean background.
All Tables
Integrated flux densities of G321.3–3.9 from the CHIPASS and S-PASS detections used to calculate the SNR spectral index.
Best fit parameters with 1σ errors obtained with different models; O, Ne, Mg, Si, and Fe were left free to vary.
Best fit parameters with 1σ errors obtained with a TBabs*vapec model; O, Ne, Mg, Si, and Fe were left free to vary.
All Figures
|
Fig. 1
|
| In the text | |
|
Fig. 2
|
| In the text | |
|
Fig. 3 Composite RGB image of G321.3–3.9 as seen in the eROSITA all-sky surveys eRASS:4 and the MWA radio image taken at 200 MHz. The X-ray photons to produce the image were color-coded according to their energy (red for energies 0.2–0.7, green for 0.7–1.2 keV), whereas the MWA image of G321.3–3.9 is shown in the blue channel. |
| In the text | |
|
Fig. 4 eRASS:4 smoothed image of G321.3–3.9 in the 0.5–2.4 keV energy range with regions used for the eROSITA X-ray spectral analysis. The main source region is the solid yellow polygon surrounding the SNR. The point sources subtracted from the field are highlighted by a green circle with a red line in the center. The background region is the area between that polygon and the bigger dotted polygon. |
| In the text | |
|
Fig. 5 X-ray spectrum of G321.3–3.9 obtained with eROSITA. The fit model is TBabs*vapec. |
| In the text | |
|
Fig. 6 Extinction A0 in the direction of G321.3–3.9 as provided by the Gaia/2MASS extinction map. The blue shaded area is the distance corresponding to the extinction range derived from hydrogen column density obtained from our X-ray spectral analysis. |
| In the text | |
|
Fig. A.1 Total linear polarization of |
| In the text | |
|
Fig. B.1
|
| In the text | |
Current usage metrics show cumulative count of Article Views (full-text article views including HTML views, PDF and ePub downloads, according to the available data) and Abstracts Views on Vision4Press platform.
Data correspond to usage on the plateform after 2015. The current usage metrics is available 48-96 hours after online publication and is updated daily on week days.
Initial download of the metrics may take a while.