Open Access
Fig. 1
Download original image
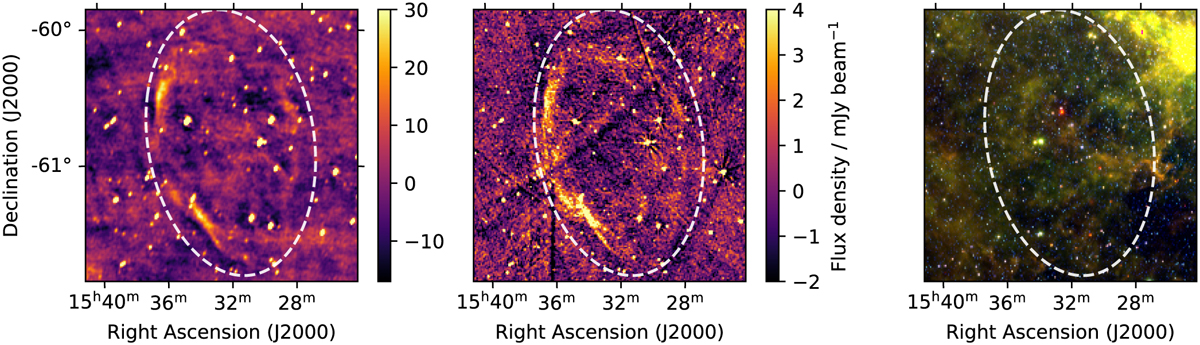
![]() region surrounding G321.3–3.9 as seen by GPM at 200 MHz in the left panel and by MGPS-2 at 843 MHz in the middle panel. An infrared zoomed-in visualization by WISE at 22 μm (R), 12 μm (G), and 3.4 μm (B) is shown in the right panel. The white dashed line highlights the location of the candidate.
region surrounding G321.3–3.9 as seen by GPM at 200 MHz in the left panel and by MGPS-2 at 843 MHz in the middle panel. An infrared zoomed-in visualization by WISE at 22 μm (R), 12 μm (G), and 3.4 μm (B) is shown in the right panel. The white dashed line highlights the location of the candidate.
Current usage metrics show cumulative count of Article Views (full-text article views including HTML views, PDF and ePub downloads, according to the available data) and Abstracts Views on Vision4Press platform.
Data correspond to usage on the plateform after 2015. The current usage metrics is available 48-96 hours after online publication and is updated daily on week days.
Initial download of the metrics may take a while.