Open Access
Fig. 3
Download original image
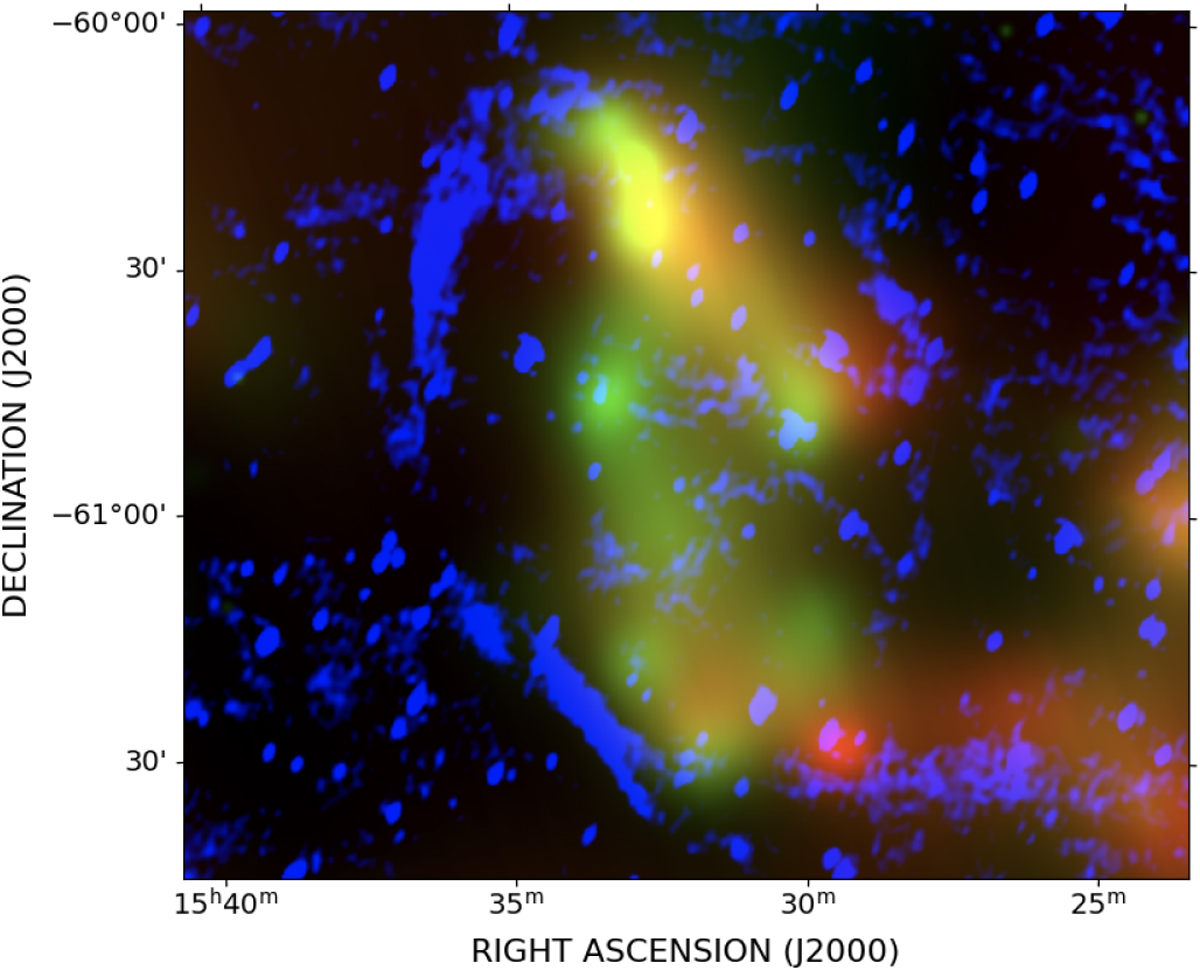
Composite RGB image of G321.3–3.9 as seen in the eROSITA all-sky surveys eRASS:4 and the MWA radio image taken at 200 MHz. The X-ray photons to produce the image were color-coded according to their energy (red for energies 0.2–0.7, green for 0.7–1.2 keV), whereas the MWA image of G321.3–3.9 is shown in the blue channel.
Current usage metrics show cumulative count of Article Views (full-text article views including HTML views, PDF and ePub downloads, according to the available data) and Abstracts Views on Vision4Press platform.
Data correspond to usage on the plateform after 2015. The current usage metrics is available 48-96 hours after online publication and is updated daily on week days.
Initial download of the metrics may take a while.