Fig. 4
Download original image
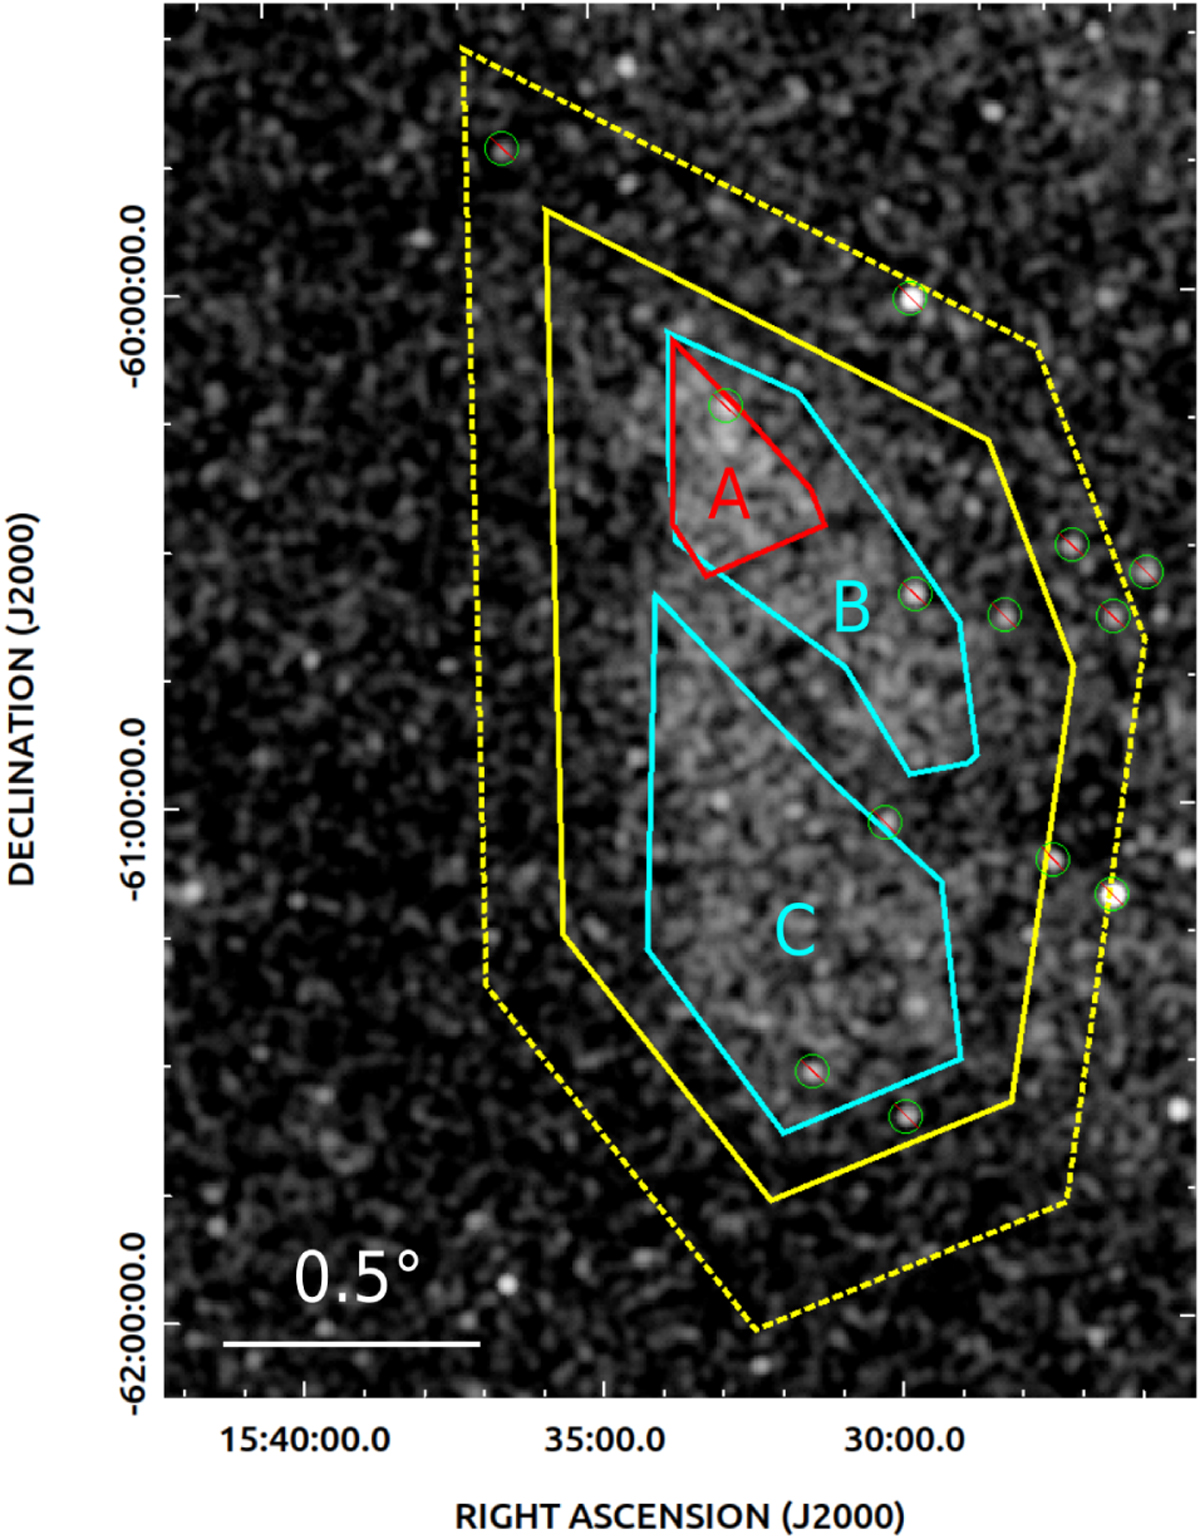
eRASS:4 smoothed image of G321.3–3.9 in the 0.5–2.4 keV energy range with regions used for the eROSITA X-ray spectral analysis. The main source region is the solid yellow polygon surrounding the SNR. The point sources subtracted from the field are highlighted by a green circle with a red line in the center. The background region is the area between that polygon and the bigger dotted polygon.
Current usage metrics show cumulative count of Article Views (full-text article views including HTML views, PDF and ePub downloads, according to the available data) and Abstracts Views on Vision4Press platform.
Data correspond to usage on the plateform after 2015. The current usage metrics is available 48-96 hours after online publication and is updated daily on week days.
Initial download of the metrics may take a while.