Open Access
Fig. B.1
Download original image
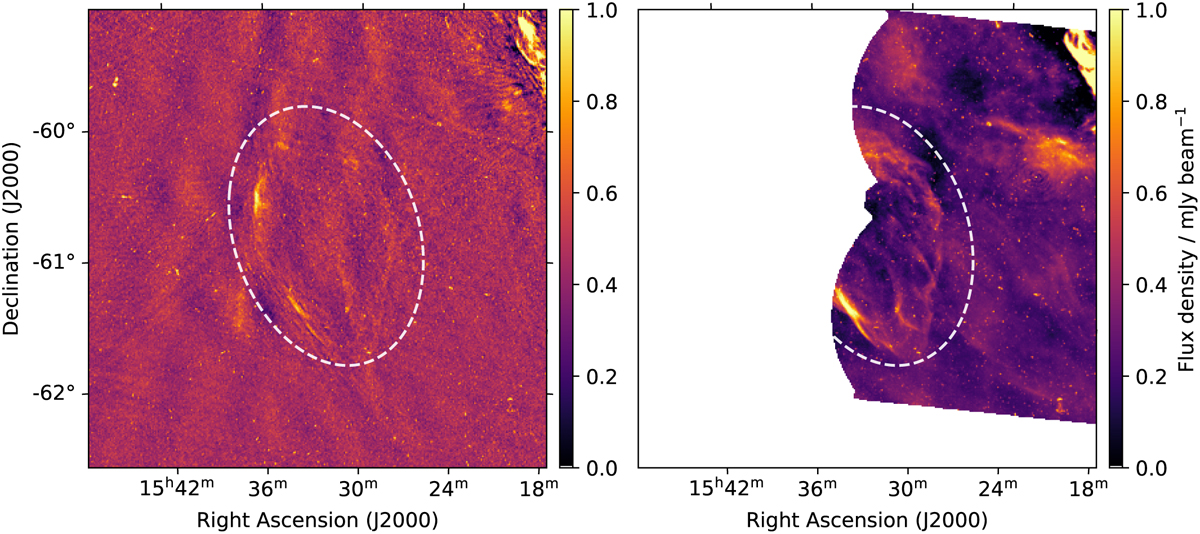
![]() deg of the region surrounding G321.3–3.9 as seen at ~ 888 MHz by RACS in the left panel and at 944 MHz by EMU in the right panel.
deg of the region surrounding G321.3–3.9 as seen at ~ 888 MHz by RACS in the left panel and at 944 MHz by EMU in the right panel.
Current usage metrics show cumulative count of Article Views (full-text article views including HTML views, PDF and ePub downloads, according to the available data) and Abstracts Views on Vision4Press platform.
Data correspond to usage on the plateform after 2015. The current usage metrics is available 48-96 hours after online publication and is updated daily on week days.
Initial download of the metrics may take a while.