| Issue |
A&A
Volume 689, September 2024
|
|
|---|---|---|
| Article Number | A260 | |
| Number of page(s) | 8 | |
| Section | Interstellar and circumstellar matter | |
| DOI | https://doi.org/10.1051/0004-6361/202451518 | |
| Published online | 18 September 2024 | |
Advancing spectroscopic understanding of HOCS+: Laboratory investigations and astronomical implications
1
Center for Astrochemical Studies, Max-Planck-Institut für Extraterrestrische Physik,
Gießenbachstraße 1,
85748
Garching,
Germany
2
Centro de Astrobiología (CAB), INTA-CSIC,
Carretera de Ajalvir km 4, Torrejón de Ardoz,
28850
Madrid,
Spain
Received:
15
July
2024
Accepted:
5
August
2024
Sulphur-bearing species play crucial roles in interstellar chemistry, yet their precise characterisation remains challenging. Here, we present laboratory experiments aimed at extending the high-resolution spectroscopy of protonated carbonyl sulphide (HOCS+), a recently detected molecular ion in space. Using a frequency-modulated free-space absorption spectrometer, we detected rotational transitions of HOCS+ in an extended negative glow discharge with a mixture of H2 and OCS, extending the high-resolution rotational characterisation of the cation well into the millimetre wave region (200–370 GHz). Comparisons with prior measurements and quantum chemical calculations revealed an overall agreement in the spectroscopic parameters. With the new spectroscopic dataset in hand, we re-investigated the observations of HOCS+ towards G+0.693−0.027, which were initially based solely on Ka = 0 lines contaminated by HNC34S. This re-investigation enabled the detection of weak Ka ≠ 0 transitions, free from HNC34S contamination. Our high-resolution spectroscopic characterisation also provides valuable insights for future millimetre and submillimetre astronomical observations of these species in different interstellar environments. In particular, the new high-resolution catalogue will facilitate the search for this cation in cold dark clouds, where very narrow line widths are typically observed.
Key words: line: identification / molecular data / ISM: abundances / ISM: clouds / ISM: molecules
© The Authors 2024
 Open Access article, published by EDP Sciences, under the terms of the Creative Commons Attribution License (https://creativecommons.org/licenses/by/4.0), which permits unrestricted use, distribution, and reproduction in any medium, provided the original work is properly cited.
This article is published in open access under the Subscribe to Open model.
Open Access funding provided by Max Planck Society.
1 Introduction
The interstellar medium (ISM) stands as a vast cosmic laboratory, where a multitude of molecular species undergo complex chemical transformations under extreme conditions. Among the myriad of molecules detected in the ISM, sulphur-bearing species hold particular significance, comprising more than 10% of the vast chemical inventory. These sulphur-containing compounds then play prominent roles in interstellar chemistry, influencing the formation of more complex molecules and contributing to the chemical diversity of the ISM. Despite the wealth of molecular data accumulated through astronomical observa tions, sulphur chemistry in the ISM remains a largely uncharted territory, especially in dense environments, where a significant depletion of gaseous sulphur onto interstellar dust grains is believed to occur (Ruffle et al. 1999; Laas & Caselli 2019; Shingledecker et al. 2020). Determining the sulphur content within both volatile and refractory compounds in the ISM poses a significant challenge in astrochemistry. The detection of primary sulphur reservoirs, icy H2S and atomic gas, has proven difficult, relying heavily on the accuracy of models to estimate the abundances of species comprising less than 1% of the total sulphur. Recent observations performed with JWST show that sulphur remains undepleted during the ionic, atomic, and molecular gas phases of the ISM, and in particular in the Orion Bar (Fuente et al. 2024). This is consistent with other findings that suggest that sulphur depletion is low in massive star-forming regions because of the interaction of the UV photons coming from newly formed stars with interstellar matter (Fuente et al. 2023). Similar low depletion has been observed towards the comet C67P/Churyumov-Gerasimenko (Calmonte et al. 2016).
Carbonyl sulphide, OCS, is one of the most abundant S-bearing species in the ISM, detected in a plethora of different environments, including pre-stellar cores such as L183 and L1544 (e.g. Lattanzi et al. 2020), comets (Bockelée-Morvan et al. 2016), and interstellar ices (Boogert et al. 2015). An intriguing aspect of interstellar chemistry is the detection of many species that are unstable under terrestrial conditions, such as protonated species. The detection of protonated species in the ISM is of particular importance for several reasons. Firstly, these species provide valuable information about the chemical processes occurring in the interstellar environment, shedding light on the formation pathways and reaction mechanisms that govern molecular evolution. Secondly, protonated species often serve as intermediates in complex chemical reactions, acting as key players in the synthesis of more complex organic molecules. Lastly, in some cases, protonated species can serve as a proxy of their non-polar neutral counterparts, such as HOCO+ and N2H+, of CO2 and N2, respectively. Therefore, their detection can offer an insight into precursors of important pre-biotic molecules in space and their potential role in the emergence of life.
The most recent molecular ion detected in the interstellar gas is the oxygen-protonated carbonyl sulphide, HOCS+, identified in the course of a molecular line survey of the molec ular cloud G+0.693−0.027 (hereafter G+0.693) in the Galactic centre employing the Yebes 40m and IRAM 30m radio telescopes (Sanz-Novo et al. 2024a). While the sulphur protonated ion, HSCO+, is more energetically favourable, by about 2500 K (Wheeler et al. 2006), this isomer is yet to be identified in the ISM, leading to an estimated abundance of less than a factor of two compared to the high-energy HOCS+isomer. Unfortunately, the Ka = 0 transitions of HOCS+ appeared to be blended with transitions from HNC34S, complicating the robust characterisation of the spectroscopic parameters of HOCS+. Therefore, new laboratory experiments are needed to obtain information about the Ka ≠ 0 transitions, which are not expected to be blended with those of HNC34S, and hence the spectroscopic information of HOCS+ can be properly determined.
The initial experimental investigation of the protonated car-bonyl sulphide system was conducted by Nakanaga & Amano (1987), during which the fundamental v1 vibrational band (O–H stretch) of HOCS+ was detected via absorption in a hollow cathode discharge using a difference frequency laser system. Although these measurements were executed at a low resolution (with an accuracy of approximately 30 MHz), this study facilitated the inaugural experimental characterisation of the spectroscopic parameters of this cation. Concurrently, efforts to detect the lower energy isomer, HSCO+, in the expected S–H stretch frequency region were unsuccessful. Approximately a decade later, Ohshima & Endo (1996) advanced the understanding of the HOCS+ rotational spectrum in the centimetre-wave range, by detecting the lower three Ka = 0 a-type transitions in the 11–35 GHz range, through high-resolution measurements with a Fourier-transform microwave spectrometer coupled with a pulsed-discharge nozzle. The identification of the lower-energy isomer HSCO+ was ultimately achieved through the work of McCarthy & Thaddeus (2007). Employing experimental techniques similar to those used by Ohshima & Endo (1996) resulted in the detection of the three lowest rotational transitions in the Ka = 0 ladder of the normal isotopic species, alongside DSCO+ and H34SCO+. Further extensive laboratory spectroscopic characterisation of HSCO+ and DSCO+ extending into the submillimetre wave region was subsequently conducted by Lattanzi et al. (2018).
Considerable scholarly attention has been directed towards the investigation of the geometries, vibrational wave numbers, and relative energies of two stable isomers of protonated carbonyl sulphide. Initial discrepancies between ab initio predic tions and experimental results in infrared spectroscopy promptedan in-depth examination of the potential energy surface of this protonated system. This examination was meticulously car ried out by Wheeler et al. (2006) employing multiple quantum chemical calculation methods, notably including coupled cluster theory extended to triple excitations, used in conjunction with the correlation consistent hierarchy of basis sets, cc-pVXZ (X = D, T, Q, 5, 6). Subsequently, comprehensive ab initio spectroscopic predictions, encompassing fundamental vibrational frequencies and spectroscopic constants of HOCS+, HSCO+, and their isotopically substituted variants, were undertaken by Fortenberry et al. (2012). These studies utilised vibrational per turbation theory at the second order and the vibrational configu ration interaction method, integrated with an extremely accurate quartic force field. Furthermore, an exhaustive review of high-level quantum chemical calculations concerning several sulphur-containing species, including protonated carbonyl sulphide, was conducted by Alessandrini et al. (2018). This review employed the coupled-cluster singles and doubles approach (CCSD) aug mented by a perturbative treatment of triple excitations, denoted as CCSD(T).
In this manuscript, we present the results of laboratory experiments aimed at extending the high-resolution spectroscopy of HOCS+, providing a reliable database for the astronomical characterisation of this species well into the submillimetre wave region, and including a full treatment of the asymmetric rotor behaviour. A search for Ka ≠ 0 a-type transitions in G+0.693 is also presented and discussed in the following sections, along with a re-investigation of the Ka = 0 transitions.
2 Laboratory experiment
The laboratory experiment utilised the Center for Astrochemical Studies Absorption Cell (CASAC), a frequency-modulated free-space absorption spectrometer, developed at the Max Planck Institute for Extraterrestrial Physics (Bizzocchi et al. 2017). This instrument has previously been used to characterise various reactive sulphur-bearing species (e.g. Prudenzano et al. 2018; Lattanzi et al. 2018; Inostroza-Pino et al. 2024; Araki et al. 2024). The primary radiation source is a Keysight E8257D frequency synthesiser precisely synchronised with a 10 MHz rubidium frequency standard from Stanford Research Systems, ensuring the highest accuracy in frequency and phase stabilisation. The synthesiser’s radiation can then be amplified and multiplied using a Virginia Diodes solid-state active multiplier chain, allowing the coverage of the 75 GHz to 1600 GHz frequency range with exceptional frequency agility.
Radiation passes through a 3-m-long, 5-cm-diameter Pyrex tube, encountering two hollow stainless steel electrodes, each 10 centimetres in length, connected to a 5 kW DC power supply. The discharge region, which spans 2 metres between the electrodes, can be efficiently cooled by liquid nitrogen. Frequency modulation is achieved by encoding the signal with a sine wave at a constant rate of 50 kHz. Upon interaction with the molecular plasma, the signal is detected using a cryogenic-free InSb hot electron bolometer from QMC Instruments Ltd. To derive the absorption signal’s second derivative profile, a lock-in amplifier (SR830, Stanford Research Systems) demodulates the detector output at twice the modulation frequency (2f detection).
All experimental procedures were co-ordinated and recorded using a computer-controlled acquisition system. The experimental conditions involved the gases Neon, H2, and OCS in a ratio of 30/1/1, respectively, and for a total pressure of 20 mTorr measured downstream. The whole cell was cooled using liquid nitrogen to a temperature of ~ 150 K, measured around the middle of the length of the Pyrex tube, and an extended negative glow discharge was applied at 2 kV/6 mA with a ~200 G co-axial magnetic field.
Overall, the absorption characteristics exhibited weak signals, which required extensive averaging to achieve an accept able signal-to-noise ratio. Undoubtedly, temperature emerged as the most crucial factor in ensuring a satisfactory quality of signal readability. In an effort to amplify the weak signal, additional tests were conducted using a hollow cathode system recently developed in our laboratory. However, these attempts proved unsuccessful. Detailed findings regarding this new system will be presented separately. The general experimental conditions were quite akin to those used for the spectroscopy of the lower-energy isomer and reported in Lattanzi et al. (2018), with the sole exception of the buffer gas; in this case, Neon demonstrated superior discharge stability and facilitated better dynamic control of the experiment, while in the case of HSCO+ measurements Argon was preferred.
3 Analysis
The protonated carbonyl sulphide system comprises two stable isomers, depending on whether the protonation occurs to the sulphur or the oxygen side. The energy separation of the two species is about 4.9 kJ mol−1 (~2450 K), with the sulphur protonated isomer being the lower-energy form. The transition state, which constitutes the barrier to the isomerisation of HSCO+to HOCS+, lies ~69 kJ mol−1 higher than the lower-energy isomer (see Fig. 1). The oxygen-protonated carbonyl sulphide is a near-prolate asymmetric top (κ = −0.99) with a Cs symmetry and a planar structure (inertial defect of Δ ≈ 0.082 amu Å2). Proton affinities of OCS to form HOCS+ and HSCO+ were calculated to be 610 kJ mol−1 and 632 kJ mol−1, respectively, with the CCSD(T)/aug-cc-pVTZ method (Tsuge & Lee 2016).
The laboratory search was motivated by the recent detection of HOCS+in the G+0.693 molecular cloud by Sanz-Novo et al. (2024a) and by the previous successful experiment carried out in our laboratories on HSCO+. Assuming similar experimental conditions for the formation of both species, the experimental settings were first optimised for the production of the previ ously detected HSCO+. Once the conditions were defined for the S-protonated OCS, a search was carried out for the oxygen-protonated isomer around the strongest predicted a-type Ka = 0 transitions in the 1mm-wave band. This frequency region was chosen as a good balance between the predicted line intensity for our experimental conditions and the overall performance of the spectrometer. The initial search was guided by the effective B rotational and quartic distortion constants derived by Ohshima & Endo (1996).
Multiple short integrations on the same transition, as opposed to a single long integration, were required due to the delicate and sensitive experimental setting. With this approach, a better handling on the stability of the experimental condi tions was possible, along with the opportunity to monitor bad scans that were eventually discarded from the final averaging. The results of such a strategy can be appreciated in Fig. 2 where the rotational frequency of the transition,  , around 344 179 MHz, has been obtained after averaging 30 different scans, each with an integration time of 3 min utes. Although the individual averaging periods were brief, one can observe significant variability in the experimental conditions, as is evidenced by notable fluctuations in the baseline (Fig. 2, top). This variability vividly illustrates the interplay among various experimental parameters within a discharge system. Even slight fluctuations in cell temperature, spanning just a few degrees, exert a discernible impact on plasma behaviour, thereby influencing the efficacy of the DC discharge and the applied magnetic field. Concurrently, alterations in discharge and magnetic field conditions reciprocally affect the molecular plasma and its effective temperature. To recover the line central frequencies, each individual experimental averaged rotational transition was baseline-subtracted and line-profile-fitted to a modulated Voigt algorithm (Dore 2003), implemented in the data analysis software QtFit, part of our in-house python-based libraries for laboratory spectroscopy, pyLabSpec1. Both the complex component of the Fourier transform of the dipole correlation function (i.e. the dispersion term) and a low-order polynomial (typically second or third order) were also taken into account to model the line asymmetry and baseline produce by the background standing waves between non-perfectly transmitting windows of the absorption cell. From this anal ysis, considering the line width and signal-to-noise ratio of each rotational transition, we assigned an estimated accuracy of 75–150 kHz to our experimental dataset. With the line central frequency in hand, the whole dataset, including the three low-frequency transitions previously measured, was then analysed using the SPFIT/SPCAT suit of programs (Pickett 1991) and fitted to a Watson S-reduced Hamiltonian for asymmetric-top molecules. The full dataset now consists of 30 rotational transitions, from 28 independent absorption features, including the three centimetre-wave transitions previously detected by Ohshima & Endo (1996), and a final standard deviation of 46 kHz (see Table 1). The transitions observed by Nakanaga & Amano (1987) were not included in the final dataset since they were not available and also measured with a reported accuracy of 0.001 cm−1 (i.e. ~ 30 MHz), which is at least 200 times worse than our estimated accuracy. Nevertheless, it is worth comparing the molecular parameters derived in the new dataset with those reported earlier, including the infrared measurements of the v1 fundamental band by Nakanaga & Amano (1987) and the more recent ab initio quantum chemical calculations by Alessandrini et al. (2018) (see Table 1). An initial comparison of the spectroscopic parameters obtained in the different works shows a good agreement amongst the majority of parameters. In particular, the theoretical values for B and C are only a few hundred kilohertz away from the experimental values (0.02% and 0.01%). The quartic centrifugal distortion constants, DJ and DJK, both agree within 3%. The largest difference is seen for the d1 quartic parameter; here, the difference between the parameter derived experimentally and that obtained from quantum chemi cal calculations is around a few tens of percent. This difference is even larger when the ab initio is compared to the previous experimental value obtained by Nakanaga & Amano (1987). For consistency with our work and other ab initio and experimental studies, the parameters from Nakanaga & Amano (1987) shown in Table 1 have been converted from the Watson A-reduction Hamiltonian used by the authors in their work to the Watson S-reduced one, following Table 8.16 of the Gordy & Cook (1984). It is worth noticing that the real impact on this conversion is marginal since the magnitude of the d2 parameter is negligible (less than 1 Hz) especially when compared to all the other parameters, and the only visible effect is on the d1 constants, which change sign when passing from δJ, since d1 = −δJ. Due to the limitation of our measurements to the a-type spectrum only, the A rotational constant is still largely uncertain (~0.5% error), compared to the other rotational constant, but in good agreement with the theoretical value (0.02% difference), and in one sigma from the previous experimental value. The other expected effect of the limitation to the a-type spectrum is on the large unresolved correlation of the A and DK parameters, so the latter is left fixed to the measured values by Nakanaga & Amano (1987). An alternative fitting analysis was performed, fixing the DK to its ab initio value derived in Alessandrini et al. (2018), but no significant variations were noticed in the overall quality of the fit itself and the values, and corresponding errors, of the other individual parameters.
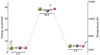 |
Fig. 1 Structures and relative energy levels of HSCO+, HOCS+, and the SC(H)O+ transition state. Values refer to kcal mol−1 and have been obtained at the CCSD(T) level of theory, with the cc-pVQZ basis set by Wheeler et al. (2006). |
 |
Fig. 2 Experimental rotational spectra of HOCS+. Left panel: single short scans (3-minute integration time, each with a 3 ms time constant) around 344 GHz. Centre panel: average spectrum from the 30 individual scans. Right panel: 2f absorption spectrum of the |

Spectroscopic parameters of oxygen protonated carbonyl sulphide HOCS+.
4 Astronomical search
4.1 Observations
Our search for HOCS+ involved an unbiased and ultra-deep spectral survey performed towards the Galactic centre molecular cloud G+0.693. This source ranks among the most chemically diverse astronomical regions, marked by the first detections of numerous carbon-, oxygen-, nitrogen-, and sulphur-bearing compounds (see, e.g. Rivilla et al. 2019, 2020, 2021a,b, 2022a,b, 2023; Rodríguez-Almeida et al. 2021a,b; Jiménez-Serra et al. 2022; Zeng et al. 2021, 2023; Sanz-Novo et al. 2023, 2024a,b).
We covered the Q-band (31.075-50.424 GHz) using the Yebes 40m (Guadalajara, Spain) radiotelescope. Furthermore, the IRAM 30 m radiotelescope was employed to cover three additional frequency ranges with high sensitivity: 83.2–115.41 GHz,132.28–140.39 GHz, and 142.00–173.81 GHz. We used the position-switching mode, centred at α = 17h47m22s, δ = −28°21′27″, with the off position shifted by Δα = −885″ and Δδ = 290″. The half power beam width (HPBW) of the Yebes 40 m telescope ranges from approximately 35″ to 55″ at frequencies of 50 GHz and 31 GHz, respectively (Tercero et al. 2021). Meanwhile, the HPBW of the IRAM 30 m radiotelescope varies from ~14″ to ~29″ across the covered frequency range. Further details of these observations (e.g. resolution, beam efficiencies, and noise levels of the molecular line survey) are provided in Rivilla et al. (2023) and Sanz-Novo et al. (2023).
4.2 Re-inspection of the detection of HOCS+ towards G+0.693 and search for Ka ≥ 1 transitions
The new catalogue, based on the spectroscopy presented in Sect. 3 and implemented in the Spectral Line Identification and Modeling (SLIM) tool (version from 2023 November 15) within the MADCUBA package (Martín et al. 2019), was used to conduct a new astronomical search for HOCS+. This tool allowed us to generate the local thermodynamic equilibrium (LTE) synthetic spectra under the assumption of LTE conditions.
Once the emission from all the molecules previously identified towards G+0.693 was accounted for (Rivilla et al. 2023 and references therein), we re-evaluated the detection of the Ka = 0 lines reported in Sanz-Novo et al. (2024a), which was based on an extrapolation to higher frequencies of the three lowest-J R-branch a-type rotational transitions of HOCS+ measured by Ohshima & Endo (1996). Sanz−Novo et al. (2024a) foresaw sizable uncertainties upon reaching the millimetre-wave region (e.g. 0.3 MHz at 100 GHz and1 0.6 MHz at 130 GHz, corresponding to velocities of 1.1 km s−1 and 1.8 km s−1, respectively). Nonetheless, we already anticipated that these uncertainties would not have an impact on the analysis, as they are notably smaller than the typical line widths of the molecular line emission observed towards G+0.693 (FWHM ~ 15−20 km s−1; Requena-Torres et al. 2006, 2008; Zeng et al. 2018). Indeed, the discrepancies between the old and new rest frequencies account for several hundred kilohertz (e.g. 147 kHz and 360 kHz at ~103.076 GHz and ~137.432 GHz, respectively), which are considerably better than expected and, furthermore, do not affect the detection of any of the previously reported Ka = 0 transitions.
Thanks to new laboratory data, we have expanded our search to include Ka ≥ 1 transitions, which are free from contamination by HNC34S (see e.g. the 31,2−21,1 transition at 34.4294313 GHz in Fig. A.1). In brief, fortuitously, the B and C rotational constants of both HOCS+ and HNC34S are extremely similar, and therefore their spectra will be characterised by nearly identical Ka = 0 progressions. Therefore, the Ka = 0 transitions of HOCS+ are partially blended with those belonging to HNC34S, although the contribution of the latest can be well constrained based on the HNC32S/HNC34S isotopic ratio (Sanz-Novo et al. 2024a). Consequently, the inclusion of the newly measured Ka = 1 transitions is of particular relevance to conclusively disentangle the emission of HOCS+ and HNC34S. Overall, several new Ka = 1 transitions were observed (see Fig. A.1), which further strengthen the detection of HOCS+, even though they appear to be extremely weak, with most of them contaminated by the emission of other species. Nevertheless, this fact is not surprising owing to the large value of the A rotational constant, which will directly affect the intensity ratio between the Ka = 0 and 1 lines.
Regarding the final LTE analysis of HOCS+, we used the same parameters of Tex = 28 K, vLSR = 66.8 km s−1, and FWHM = 21.8 km s−1 derived from the previous analysis presented in Sanz-Novo et al. (2024a). We then carried out the LTE fit to the HOCS+ emission using the AUTOFIT tool within SLIM (Martín et al. 2019), which performs a non-linear least-squares LTE fit to the observed spectra, with only the column density left as a free parameter. We used all the Ka = 0 transitions covered in our survey, which were already reported in Sanz-Novo et al. (2024a), as well as the brightest Ka = 1 lines listed in Table 2, and accounted for the expected emission from every molecule detected within the same frequency range. Also, since the excitation temperatures of the molecules are low, as usual in G+0.693 (Tex = 5–20 K), in this case we have not used the vibrational contribution of the partition function (Qv) presented in Table 3. We derived a molecular column density of N = (9 ± 2) × 1012 cm−2, which yields a fractional abundance with respect to molecular hydrogen of (7 ± 2) × 10−11, adopting a  from Martín et al. (2008), and assuming an uncertainty of 15% of its value. Thus, current results are in perfect agreement with those reported in Sanz-Novo et al. (2024a). We present the fitted line profiles of the Ka = 0 and Ka = 1 transitions of HOCS+ (in red), along with the predicted spectrum considering all molecular species identified and analysed towards G+0.693 (in blue), in Fig. A.1a and Fig. A.1b, respectively.
Rotational and vibrational partition functions for HOCS+
5 Conclusions
In this study, we conducted laboratory experiments aimed at extending the high-resolution spectroscopy of protonated carbonyl sulphide (HOCS+), providing a comprehensive database for its full astronomical characterisation well into the submillimetre wave region. Here, we summarise the key findings and implications of our research:
Utilising CASAC, we employed a frequency-modulated free-space absorption spectrometer for our experiments. Despite extensive efforts and optimisations, weak signals persisted, necessitating prolonged averaging to achieve acceptable signal-to-noise ratios. Temperature stability emerged as a critical factor influencing plasma behaviour, with even slight fluctuations affecting discharge efficacy and magnetic field performance;
Our experiments have successfully detected rotational transitions of HOCS+ in the laboratory setting. Through careful analysis and baseline subtraction techniques, we obtained a dataset comprising 30 rotational transitions, with a standard deviation of 46 kHz. The accuracy of our dataset is estimated to be within the range of 75-150 kHz (~ 100 ms−1 at 300 GHz);
Comparisons of our experimental results with prior infrared measurements and quantum chemical calculations reveal an overall agreement in spectroscopic parameters. While discrepancies are noted in certain quartic parameters, most rotational constants exhibit good consistency across studies;
The new spectroscopic measurements reported in this work allow us to decisively corroborate the detection of the Ka = 0 lines presented in Sanz-Novo et al. (2024a), thanks to more accurate constraints on both the B and C rotational constants as well as the centrifugal distortion parameters. Also, we have found additional Ka = 1 lines to unravel the emission of HOCS+ and HNC34S, which is consistent with the detection of the Ka = 0 lines alone, strengthening the detection even further;
Our laboratory measurements also provide crucial insights for future astronomical observations of HOCS+ in other interstellar environments, such as the cold sources TMC-1 or L1544, where the line widths can be as narrow as 0.5–0.6 km s−1 (see e.g. the QUIJOTE line survey; Cernicharo et al. 2021);
Future laboratory research endeavours may focus on refining experimental techniques to enhance sensitivity and resolution, and possibly to pin down the b-type spectrum of the cation, still undetected, which would further constrain the A rotational constant.
Acknowledgements
We gratefully acknowledge the Max Planck society for the financial support. V.M.R., M.S.-N. I.J.-S. and J.M.P. acknowledge support from the grant No. PID2022-136814NB-I00 by the Spanish Ministry of Science, Innovation and Universities/State Agency of Research MICIU/AEI/10.13039/501100011033 and by ERDF, UE. V.M.R. also acknowledges support from the grant number RYC2020-029387-I funded by MICIU/AEI/10.13039/501100011033 and by “ESF, Investing in your future”, and from the Consejo Superior de Investigaciones Científicas (CSIC) and the Centro de Astrobiología (CAB) through the project 20225AT015 (Proyectos intramurales especiales del CSIC), and from the grant CNS2023-144464 funded by MICIU/AEI/10.13039/501100011033 and by “European Union NextGenerationEU/PRTR”. M.S.N. also acknowledges a Juan de la Cierva Postdoctoral Fellowship, project JDC2022-048934-I, funded by MCIN/AEI/10.13039/501100011033 and by the European Union “NextGenera-tionEU/PRTR”.
Appendix A Observed HOCS+ transitions towards G+0.693−0.027
In this section the spectra of the Ka = 0 and Ka = 1 transitions detected towards the molecular cloud G+0.693−0.027 are reported.
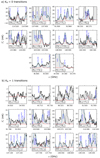 |
Fig. A.1 Transitions of HOCS+ detected towards the G+0.693−0.027 molecular cloud (listed in Table 2). We depict with a red line the result of the best LTE fit of HOCS+, while the blue line plots the emission from all the molecules identified to date in our survey. The observed spectra are plotted as gray histograms. Note that for the Ka = 0 transitions, HOCS+ appears to be blended with HNC34S because of their similar B + C, but the contribution of HNC34S can be well constrained based on the HNC32S/HNC34S isotopic ratio (Sanz-Novo et al. 2024a). |
References
- Alessandrini, S., Gauss, J., & Puzzarini, C. 2018, J. Chem. Theory Computat., 14, 5360 [Google Scholar]
- Araki, M., Lattanzi, V., Endres, C. P., & Caselli, P. 2024, ApJ, 965, 46 [Google Scholar]
- Bizzocchi, L., Lattanzi, V., Laas, J., et al. 2017, A&A, 602, A34 [NASA ADS] [CrossRef] [EDP Sciences] [Google Scholar]
- Bockelée-Morvan, D., Crovisier, J., Erard, S., et al. 2016, MNRAS, 462, S170 [Google Scholar]
- Boogert, A. C. A., Gerakines, P. A., & Whittet, D. C. B. 2015, ARA&A, 53, 541 [Google Scholar]
- Calmonte, U., Altwegg, K., Balsiger, H., et al. 2016, MNRAS, 462, S253 [NASA ADS] [CrossRef] [Google Scholar]
- Cernicharo, J., Cabezas, C., Agúndez, M., et al. 2021, A&A, 648, L3 [EDP Sciences] [Google Scholar]
- Dore, L. 2003, J. Mol. Spectrosc., 221, 93 [NASA ADS] [CrossRef] [Google Scholar]
- Fortenberry, R. C., Huang, X., Francisco, J. S., Crawford, T. D., & Lee, T. J. 2012, J. Phys. Chem. A, 116, 9582 [Google Scholar]
- Fuente, A., Rivière-Marichalar, P., Beitia-Antero, L., et al. 2023, A&A, 670, A114 [NASA ADS] [CrossRef] [EDP Sciences] [Google Scholar]
- Fuente, A., Roueff, E., Le Petit, F., et al. 2024, A&A, 687, A87 [NASA ADS] [CrossRef] [EDP Sciences] [Google Scholar]
- Gordy, W., & Cook, R. I. 1984, Microwave Molecular Spectra, 3rd edn. (Wiley) [Google Scholar]
- Inostroza-Pino, N., Lattanzi, V., Palmer, C. Z., et al. 2024, Mol. Phys., 122, e2280762 [NASA ADS] [CrossRef] [Google Scholar]
- Jiménez-Serra, I., Rodríguez-Almeida, L. F., Martín-Pintado, J., et al. 2022, A&A, 663, A181 [NASA ADS] [CrossRef] [EDP Sciences] [Google Scholar]
- Laas, J. C., & Caselli, P. 2019, A&A, 624, A108 [NASA ADS] [CrossRef] [EDP Sciences] [Google Scholar]
- Lattanzi, V., Spezzano, S., Laas, J. C., et al. 2018, A&A, 620, A184 [NASA ADS] [CrossRef] [EDP Sciences] [Google Scholar]
- Lattanzi, V., Bizzocchi, L., Vasyunin, A. I., et al. 2020, A&A, 633, A118 [NASA ADS] [CrossRef] [EDP Sciences] [Google Scholar]
- Martín, S., Requena-Torres, M. A., Martín-Pintado, J., & Mauersberger, R. 2008, ApJ, 678, 245 [CrossRef] [Google Scholar]
- Martín, S., Martín-Pintado, J., Blanco-Sánchez, C., et al. 2019, A&A, 631, A159 [Google Scholar]
- McCarthy, M. C., & Thaddeus, P. 2007, J. Chem. Phys., 127, 221104 [Google Scholar]
- Nakanaga, T., & Amano, T. 1987, Mol. Phys., 61, 313 [CrossRef] [Google Scholar]
- Ohshima, Y., & Endo, Y. 1996, Chem. Phys. Lett., 256, 635 [Google Scholar]
- Pickett, H. M. 1991, J. Mol. Spectrosc., 148, 371 [Google Scholar]
- Prudenzano, D., Laas, J., Bizzocchi, L., et al. 2018, A&A, 612, A56 [NASA ADS] [CrossRef] [EDP Sciences] [Google Scholar]
- Requena-Torres, M. A., Martín-Pintado, J., Rodríguez-Franco, A., et al. 2006, A&A, 455, 971 [NASA ADS] [CrossRef] [EDP Sciences] [Google Scholar]
- Requena-Torres, M. A., Martín-Pintado, J., Martín, S., & Morris, M. R. 2008, ApJ, 672, 352 [Google Scholar]
- Rivilla, V. M., Martín-Pintado, J., Jiménez-Serra, I., et al. 2019, MNRAS, 483, L114 [NASA ADS] [CrossRef] [Google Scholar]
- Rivilla, V. M., Martín-Pintado, J., Jiménez-Serra, I., et al. 2020, ApJ, 899, L28 [Google Scholar]
- Rivilla, V. M., Jiménez-Serra, I., García de la Concepción, J., et al. 2021a, MNRAS, 506, L79 [NASA ADS] [CrossRef] [Google Scholar]
- Rivilla, V. M., Jiménez-Serra, I., Martín-Pintado, J., et al. 2021b, PNAS, 118, 2101314118 [Google Scholar]
- Rivilla, V. M., Colzi, L., Jiménez-Serra, I., et al. 2022a, ApJ, 929, A11 [Google Scholar]
- Rivilla, V. M., Garcia De La Concepción, J., Jiménez-Serra, I., et al. 2022b, Front. Astron. Space Sci., 9, 829288 [NASA ADS] [CrossRef] [Google Scholar]
- Rivilla, V. M., Sanz-Novo, M., Jiménez-Serra, I., et al. 2023, ApJ, 953, L20 [NASA ADS] [CrossRef] [Google Scholar]
- Rodríguez-Almeida, L. F., Jiménez-Serra, I., Rivilla, V. M., et al. 2021a, ApJ, 912, L11 [Google Scholar]
- Rodríguez-Almeida, L. F., Rivilla, V. M., Jiménez-Serra, I., et al. 2021b, A&A, 654, L1 [CrossRef] [EDP Sciences] [Google Scholar]
- Ruffle, D. P., Hartquist, T. W., Caselli, P., & Williams, D. A. 1999, MNRAS, 306, 691 [Google Scholar]
- Sanz-Novo, M., Rivilla, V. M., Jiménez-Serra, I., et al. 2023, ApJ, 954, 3 [NASA ADS] [CrossRef] [Google Scholar]
- Sanz-Novo, M., Rivilla, V. M., Jiménez-Serra, I., et al. 2024a, ApJ, 965, 149 [Google Scholar]
- Sanz-Novo, M., Rivilla, V. M., Müller, H. S. P., et al. 2024b, ApJ, 965, L26 [Google Scholar]
- Shingledecker, C. N., Lamberts, T., Laas, J. C., et al. 2020, ApJ, 888, 52 [Google Scholar]
- Tercero, F., López-Pérez, J. A., Gallego, J. D., et al. 2021, A&A, 645, A37 [EDP Sciences] [Google Scholar]
- Tsuge, M., & Lee, Y.-P. 2016, J. Chem. Phys., 145, 164308 [Google Scholar]
- Wheeler, S. E., Yamaguchi, Y., & Schaefer, H. F. 2006, J. Chem. Phys., 124, 044322 [Google Scholar]
- Wheeler, S. E., Yamaguchi, Y., & Schaefer, Henry F., I. 2006, J. Chem. Phys., 124, 044322 [Google Scholar]
- Zeng, S., Jiménez-Serra, I., Rivilla, V. M., et al. 2018, MNRAS, 478, 2962 [Google Scholar]
- Zeng, S., Jiménez-Serra, I., Rivilla, V. M., et al. 2021, ApJ, 920, L27 [NASA ADS] [CrossRef] [Google Scholar]
- Zeng, S., Rivilla, V. M., Jiménez-Serra, I., et al. 2023, MNRAS, 523, 1448 [NASA ADS] [CrossRef] [Google Scholar]
All Tables
All Figures
|
Fig. 1 Structures and relative energy levels of HSCO+, HOCS+, and the SC(H)O+ transition state. Values refer to kcal mol−1 and have been obtained at the CCSD(T) level of theory, with the cc-pVQZ basis set by Wheeler et al. (2006). |
| In the text | |
|
Fig. 2 Experimental rotational spectra of HOCS+. Left panel: single short scans (3-minute integration time, each with a 3 ms time constant) around 344 GHz. Centre panel: average spectrum from the 30 individual scans. Right panel: 2f absorption spectrum of the |
| In the text | |
|
Fig. A.1 Transitions of HOCS+ detected towards the G+0.693−0.027 molecular cloud (listed in Table 2). We depict with a red line the result of the best LTE fit of HOCS+, while the blue line plots the emission from all the molecules identified to date in our survey. The observed spectra are plotted as gray histograms. Note that for the Ka = 0 transitions, HOCS+ appears to be blended with HNC34S because of their similar B + C, but the contribution of HNC34S can be well constrained based on the HNC32S/HNC34S isotopic ratio (Sanz-Novo et al. 2024a). |
| In the text | |
Current usage metrics show cumulative count of Article Views (full-text article views including HTML views, PDF and ePub downloads, according to the available data) and Abstracts Views on Vision4Press platform.
Data correspond to usage on the plateform after 2015. The current usage metrics is available 48-96 hours after online publication and is updated daily on week days.
Initial download of the metrics may take a while.