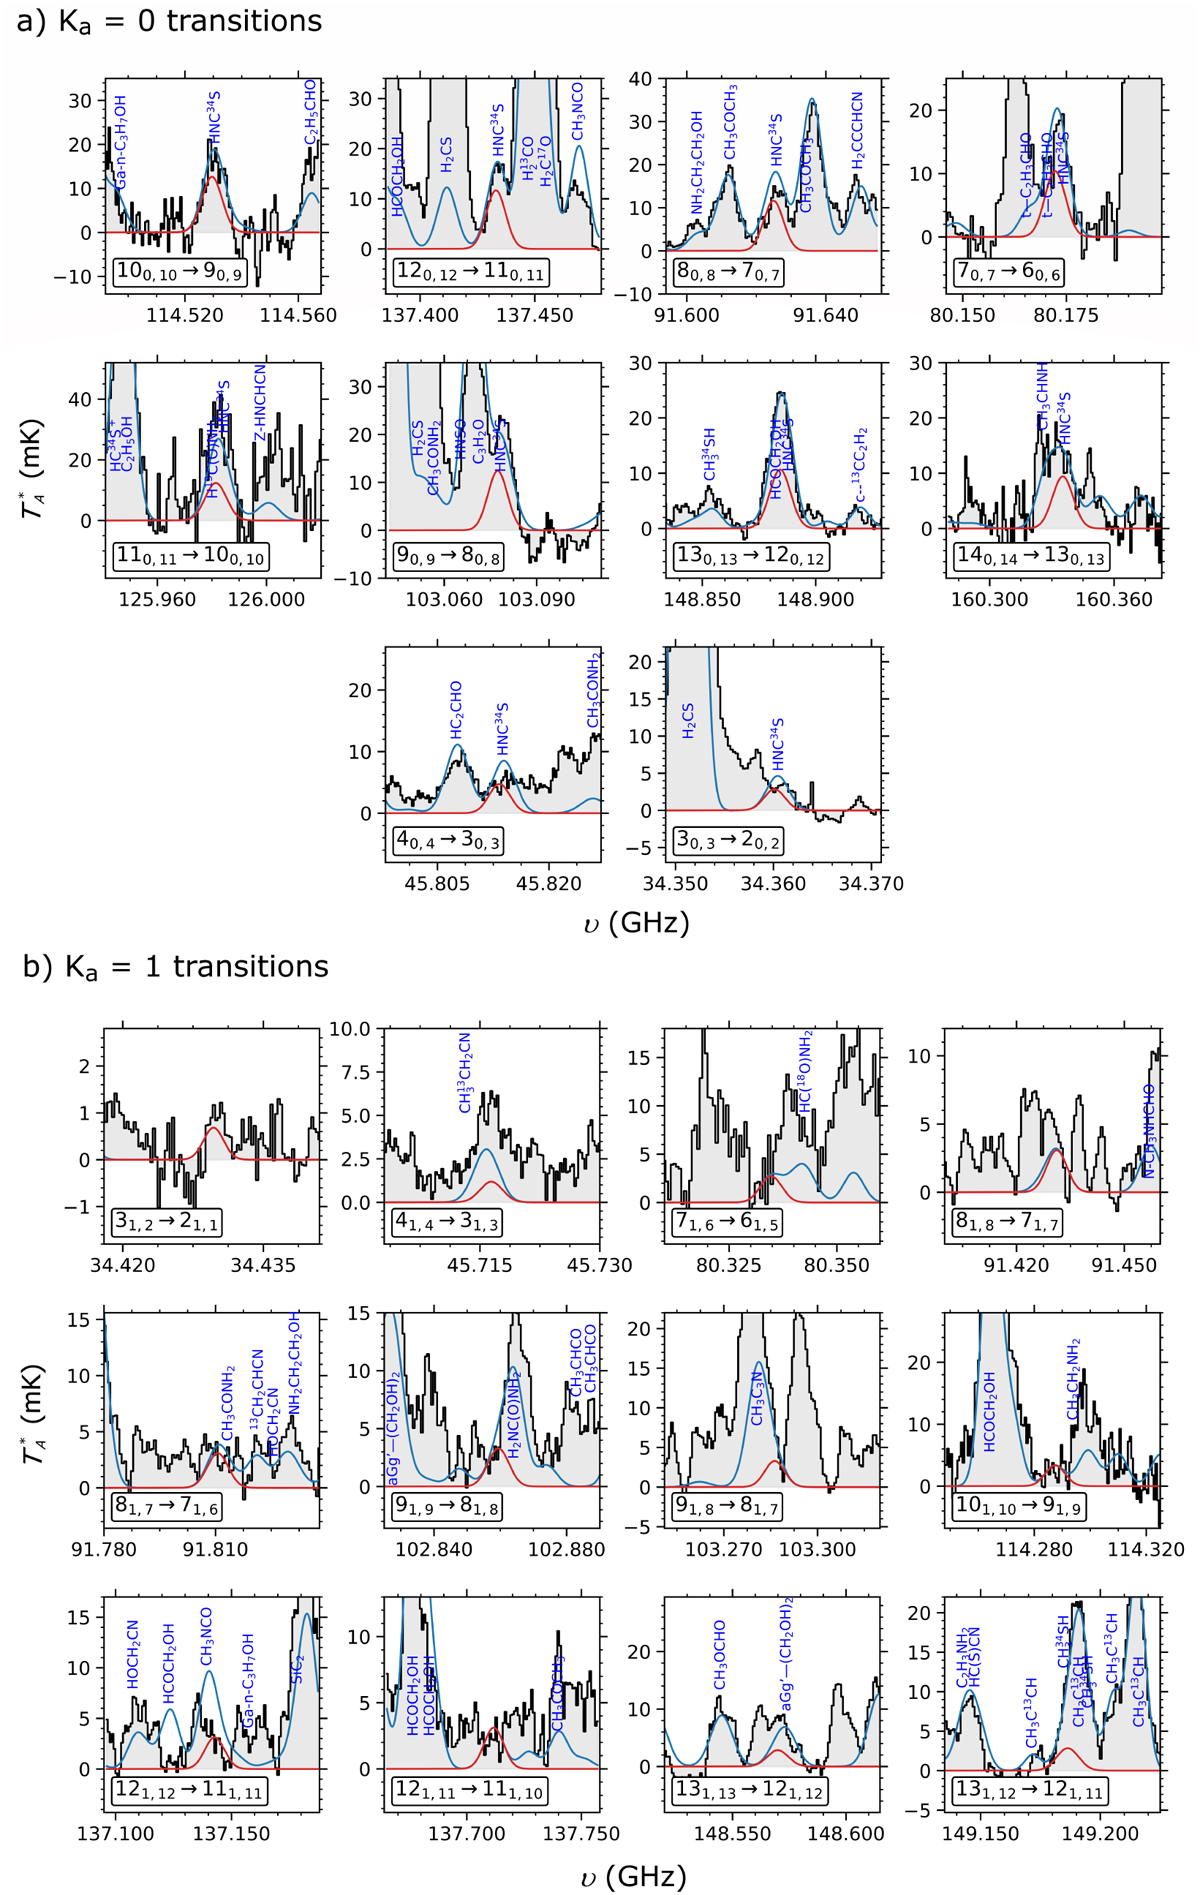
Fig. A.1

Download original image
Transitions of HOCS+ detected towards the G+0.693−0.027 molecular cloud (listed in Table 2). We depict with a red line the result of the best LTE fit of HOCS+, while the blue line plots the emission from all the molecules identified to date in our survey. The observed spectra are plotted as gray histograms. Note that for the Ka = 0 transitions, HOCS+ appears to be blended with HNC34S because of their similar B + C, but the contribution of HNC34S can be well constrained based on the HNC32S/HNC34S isotopic ratio (Sanz-Novo et al. 2024a).
Current usage metrics show cumulative count of Article Views (full-text article views including HTML views, PDF and ePub downloads, according to the available data) and Abstracts Views on Vision4Press platform.
Data correspond to usage on the plateform after 2015. The current usage metrics is available 48-96 hours after online publication and is updated daily on week days.
Initial download of the metrics may take a while.


