| Issue |
A&A
Volume 689, September 2024
|
|
|---|---|---|
| Article Number | A189 | |
| Number of page(s) | 8 | |
| Section | Galactic structure, stellar clusters and populations | |
| DOI | https://doi.org/10.1051/0004-6361/202450701 | |
| Published online | 10 September 2024 | |
Validation of the RR Lyrae period determination in the Pan-STARRS PS1 3π survey with K2
1
Konkoly Observatory, HUN-REN Research Centre for Astronomy and Earth Sciences, MTA Centre of Excellence,
1121 Konkoly Thege Miklós út 15–17,
Budapest,
Hungary
2
Eötvös Loránd University, Institute of Physics and Astronomy,
Pázmány Péter sétány 1/a,
1117
Budapest,
Hungary
Received:
13
May
2024
Accepted:
10
July
2024
Context. The Pan-STARRS 3π survey has detected hundreds of thousands of variable stars thanks to its coverage and 4-year time span, even though the sampling of the light curves is relatively sparse. These light curves contain only 10–15 detections in each of the five filters (g, r, i, z, y). During the K2 mission, the Kepler space telescope observed along the ecliptic plane with a high sampling frequency, although only for about 80 days in each of its campaigns.
Aims. Crossmatching and investigating the RR Lyrae stars observed by both K2 and Pan-STARRS can serve as a valuable tool to validate the classification and period determination of the ground-based survey.
Methods. We used the Sesar catalogue of RR Lyrae stars detected by Pan-STARRS. After determining the overlap between the stars observed by both Pan-STARRS and K2, we also considered the Gaia DR3 SOS RR Lyrae catalogue data for the list of these stars wherever it was available. The frequencies of the light variations were calculated by applying the Lomb-Scargle periodogram method on the K2 light curves that were prepared with autoEAP photometry. The calculated frequencies of the stars then were compared with those given in the Sesar catalogue and the Gaia DR3 RR Lyrae catalogue.
Results. We found that for the majority of the stars, the classification (95.6%) and the frequency determination (90.1%) of the Pan-STARRS RR Lyrae stars were consistent within 0.03 d−1 with those that we derived from the K2 autoEAP light curves. For a significant subset of the sample, 7.4%, however, an offset of 1 or 2 d−1 was found in the frequencies. These are the result of the sampling of the detections, because Pan-STARRS observations are affected by diurnal cycles, whereas Kepler carried out measurements quasi-continuously. We found that RRc subtypes are significantly more affected (25.3%) than RRab subtypes (3.7%), which is most likely caused by RRc stars having less sharp light curve features. Validation via space-based data will be important for future ground-based surveys, as well.
Key words: stars: statistics / stars: variables: RR Lyrae
© The Authors 2024
 Open Access article, published by EDP Sciences, under the terms of the Creative Commons Attribution License (https://creativecommons.org/licenses/by/4.0), which permits unrestricted use, distribution, and reproduction in any medium, provided the original work is properly cited.
This article is published in open access under the Subscribe to Open model. Subscribe to A&A to support open access publication.
1 Introduction
RR Lyrae stars are old, population II, core-helium-burning variable stars, found on the horizontal branch of the Hertzsprung-Russell diagram. Thanks to their high luminosity and the well-studied period-luminosity relation, they can be used as tracers of the galactic structure of the Milky Way (Catelan & Smith 2015). They are commonly found in the Galactic halo, and especially in globular clusters, but they appear in large numbers in the Galactic Bulge, the thick disk, and in a metal-poor thin disk (Iorio & Belokurov 2021; D’Orazi et al. 2024) as well. They also trace extragalactic structures and can be used to identify close-by dwarf galaxies as well as streams and tidal tails of perturbed galaxies, such as the Sagittarius (Sgr) dwarf galaxy and stream (Ibata et al. 1994).
Mapping and statistical studies really took off with the start of extensive sky surveys in the early 2000s such as OGLE (Optical Gravitational Lensing Experiment, Udalski et al. 1992), SDSS (Sloan Digital Sky Survey, York et al. 2000), NSVS (Northern Sky Variability Survey, Woźniak et al. 2004), ASAS (All-Sky Automated Survey, Pojmanski 1997), or the VVV (VISTA Variables in the Via Lactea, Minniti et al. 2017). Since the identification of the Sagittarius stream, numerous other dwarf galaxies and streams have been discovered as a result of the availability of large amounts of data (Weisz et al. 2011). In addition, Drake et al. (2013) used light curves from the Catalina Surveys, for example, to analyse RRab stars in the outer halo.
Pan-STARRS observed 75% of the sky during its 3π survey, which lasted for four years. During this time span, the telescope made photometric measurements in each of the five grizy SDSS filters (Chambers et al. 2016). The number of detections for a given object can vary; on average, there are approximately 60 detections in total, 10–15 in each filter. The sampling is nonuniform, which makes it possible to use the obtained light curves to identify variable objects of different types and frequencies despite the relatively low number of detections. Large sky surveys have proved to be excellent sources of data for identifying and tracking the distribution of variables, such as RR Lyrae stars. For example, Hernitschek et al. (2016) analysed the Pan-STARRS PS1 3π data and found ~1 million quasi-stellar objects (QSOs) and ~150 000 RR Lyrae candidates, and Sesar et al. (2013) used the re-calibrated LINEAR data of RR Lyrae stars to trace the structure of the galactic halo. It is worth noting, however, that ground-based surveys are limited by the diurnal cycle that affects both sampling and period determination.
Space-based observations, on the other hand, are less heavily affected by the rotation of the Earth, and therefore this kind of measurements can be an important complement to ground-based photometry data. The Kepler space telescope made quasi-continuous observations of a dedicated area of the sky, concentrating on pre-selected target stars in the direction of Lyrae and Cygnus, in order to discover exoplanet transits (Borucki et al. 2010; Borucki 2016). These datasets have proved to be invaluable in the field of stellar variability. After the spacecraft was no longer able to continue its original mission as a result of the failing reaction wheels, its second mission, named K2, started, during which the orientation of the telescope was changed to observe in the ecliptic plane (Howell et al. 2014), and a new observing mode had to be developed. Similar to its original mission, the sampling remained frequent; however, these light curves typically span about 80 days (with ~600–4000 epochs) in contrast to the previous four years.
A large number of new variable stars have already been discovered thanks to the robust nature of the survey programs, even though all-sky missions, such as the Gaia mission (Eyer et al. 2023; Clementini et al. 2023), could only collect sparse photometric data from each observed star. The light curves of the Gaia DR3 RR Lyrae catalogue contain on average 38–39 measurements, with 12 and 257 being the minimum and maximum number of observation points. It can make the identification, the classification, or the period determination challenging. The completeness of the Gaia DR3 catalogue was estimated by Clementini et al. (2023), who found it to be 79–94%, based on the OGLE data, which they considered almost complete. However, they found that comparison with a compilation of existing catalogues outside of the OGLE fields is more complicated.
The overlap between the all-sky but sparsely sampled ground-based data from Pan-STARRS, and the frequently sampled space-based measurements from K2 over a limited sky area, provide an excellent opportunity to compare and validate the accuracy of these observations. Therefore, the primary aim of this research is to investigate variable stars, specifically RR Lyrae stars, through the lens of both Pan-STARRS and K2 in order to be able to compare the accuracy of the identification and the period determination.
In Section 2, we describe our methods in detail as well as the data and catalogues that served as a basis for the analysis. The results and conclusions are presented in Sections 3 and 4.
2 Data and methods
2.1 Data and catalogues
There are multiple catalogues that contain RR Lyrae stars observed by Pan-STARRS. For example, in their study, Hernitschek et al. (2016) searched for RR Lyrae-type variables and QSOs in the light curves, analysing the first 3.5 years of observations of the Pan-STARRS dataset. They applied a machine-learning algorithm (a random forest classifier) to determine the probability of the light curve showing RR Lyrae or QSO-type variability. In the published catalogue, these probability scores can be found, but not the periodicity of a possible variability. Another catalogue is the Sesar et al. (2017) catalogue, which is exclusively dedicated to RR Lyrae stars. They applied a template fitting method and then used a machine-learning-based classification. The catalogue contains not only the classifications of the stars and the respective probability scores but also the determined periods. There is a significant overlap between these two catalogues. Because the goal is the analysis and comparison of not only the classifications but also the periods of the stars, we decided to proceed using the Sesar et al. (2017) catalogue.
After the original mission of the Kepler space telescope ended, the precision of keeping the position of the targets got worse for K2. Therefore in some cases, it can be challenging to determine the optimal aperture for the photometry in order to obtain the light curve with the best signal-to-noise ratio. We used the autoEAP light curves provided by Bódi et al. (2022). In their work, they automated the process of determining the optimal extended aperture for the photometry1.
2.2 Methods and analysis
Hereafter, when discussing the steps of data reduction, a star observed by Pan-STARRS means that it was identified and listed in the Sesar et al. (2017) catalogue. A star observed by K2 means that it was actually observed in at least one of the campaigns, as is explained below. Some stars are observed in multiple campaigns. We started the study by crossmatching the targets to obtain those stars that were potentially observed by both Pan-STARRS and K2.
To determine the overlap, we used the K2fov python tool (Mullally et al. 2016) to find those stars from the Pan-STARRS RR Lyrae catalogue that fall onto the field of view of the K2 mission in at least one of the campaigns. However, the mere fact that a star’s position falls onto the K2 field of views does not guarantee that it was actually included in the observations. Only the pixels around the pre-selected targets were downloaded due to bandwidth constraints. For this reason, after we obtained the primary list of crossmatched stars, we also checked the EPIC catalogue (Huber et al. 2016) to see whether the selected stars were observed. We focused on those stars that were among the main targets of the K2 mission in order to make sure that the light curves have a good signal-to-noise ratio for the analysis.
Finally, we crossmatched our list with the Gaia DR3 catalogue (Gaia Collaboration 2023), which served multiple purposes. One was to provide a universal ID for all our stars that we can use consistently. Another was to check the Gaia RR Lyrae catalogue (Clementini et al. 2023), too, which contained valuable information about 89% of our RR Lyraes, such as the type and pulsation period in the fundamental mode and/or the first overtone. Having another point of comparison in terms of classification, the pulsation period is important, especially in cases in which there is a disagreement between the Pan-STARRS and K2 observations in any way.
For all of the stars in the Sesar et al. (2017) catalogue, we refer to their provided period as the Pan-STARRS period. We calculated the K2 periods from the autoEAP light curves using the Lomb-Scargle periodogram method in the Astropy Python package (Astropy Collaboration 2022). However, in Campaign 7 of K2, many light curves are contaminated due to the dense field and we found that Pre-search Data Conditioning Simple Aperture Photometry (PDCSAP, Van Cleve et al. 2016) produced a cleaner light curve. Therefore, for these affected stars, PDCSAP photometry was used instead of the autoEAP one. For the stars that are found in the Gaia DR3 RR Lyrae catalogue (Clementini et al. 2023), the Gaia frequency is also given.
For further analysis, we used the corrected autoEAP light curves from K2 and downloaded the detections in each filter from Pan-STARRS. This step served only a qualitative purpose; the two light curves were visually compared. To be able to make a comparison, we converted the light curves to magnitude units. The magnitude conversion formula of Kp = −2.5 1og10(F) + 25.3, calibrated by Lund et al. (2015), was applied to convert the K2 flux to a Kp magnitude. We used the mAB = −2.5 log10(F/3631Jy) formula (Tonry et al. 2012) to convert the Pan-STARRS light curves from Jansky to the AB magnitude system for each passband.
Finally, we checked the K2 light curves of all the variable stars on the final list and classified them by visual inspection. Light curves were classified based on the periods and the structure of the folded light curves, and were compared to templates, such as the OGLE Atlas of Variable Stars2, if needed. The Sesar et al. (2017) catalogue lists their classifications based on the Pan-STARRS data; however, the only two subtypes in the catalogue are RRab (fundamental mode pulsator) and RRc (first overtone pulsator) stars. RRd (double mode pulsator) stars or other variable types were not present as classification categories. Therefore, it was crucial to obtain the K2-based classification of the stars as well, to be able to better characterise and analyse the sample.
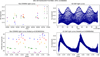 |
Fig. 1 Light curve comparison for a sample RR Lyrae star. The upper left panel visualises the Pan-STARRS light curve of the star, in all five filters, and the lower left panel shows the light curve phase-folded with the period given in the (Sesar et al. 2017) catalogue. In order to make the periodicity more transparent, we shifted the AB magnitude levels of each filter’s light curve by adding 0, 1, 2, 3, 4 magnitudes to the g, r, i, z, y filter light curves. The upper right panel illustrates the K2 light curve, while the lower right panel shows the light curve phase-folded with the period that was determined by the Lomb–Scargle periodogram method. |
3 Results
The main properties of the stars that our search criteria yielded are listed in Table A.1 in the appendix. The entire sample consists of 1120 RRab and 233 RRc stars, classified by Sesar et al. (2017). The whole table is available online3. The first two columns list the co-ordinates of the stars (taken from the Sesar et al. 2017 catalogue), the second two columns the EPIC (K2) and Gaia DR3 IDs, the fifth column is the classification type by Sesar et al. (2017), and the sixth column is the classification type based on the K2 light curve. Then, the seventh, eighth, and ninth columns show the pulsation frequencies of the RR Lyraes. The K2 ones were calculated using the Lomb–Scargle periodogram method; meanwhile, the Pan-STARRS frequencies were taken from the Sesar et al. (2017) catalogue and the Gaia frequencies are from the DR3 Special Object Studies (SOS) RR Lyrae variable catalogue (Clementini et al. 2023). The last two columns show the Kp taken from the EPIC catalogue (Huber et al. 2016) and the flux-averaged g (<g>) magnitudes taken from the Sesar et al. (2017) catalogue.
To illustrate a typical case, the light curves of one of the sample RR Lyrae stars are shown in Figure 1. It is clear that in all cases the Pan-STARRS light curves are sparsely sampled compared to the K2 light curves; however, their longer observation interval leads to more precise periods. One important thing to note in this example is that the period that was calculated based on the K2 light curve using the Lomb–Scargle periodogram method is different from that determined by Sesar et al. (2017).
In the case of the K2 data, the identification (and period determination) of the RR Lyrae star is straightforward and can be done with good precision based on the time series and the folded light curves, even by visual inspection. However, as can be seen in the left-hand panels, the Pan-STARRS datasets contain significantly fewer detections, making it harder to track the brightness changes through the different phases. The catalogue of RR Lyrae stars in the Pan-STARRS data was compiled based on template light curve fits using machine-learning (Sesar et al. 2017). The corresponding template was not included in Figure 1 because one of the free parameters (r′) could not be recovered from the work of Sesar et al. (2010).
For the majority of the stars (90.1% in total, 95.2% of RRab stars, and 65.7% of RRc ones), the periods calculated from the K2 light curves are consistent with those listed in the Sesar et al. (2017) catalogue within the uncertainties. We estimated the uncertainties from the frequency resolution of the data. The resolution of a frequency spectrum can be approximated with Δf = 2/T (Aerts et al. 2010). Assuming that the average length of a K2 light curve is T = 80 days, the formula yields Δf = 0.025 d−1. We estimated the uncertainties of the Pan-STARRS observations similarly; that is, of the order of Δf = 0.001 d−1. Frequency uncertainties were published in the Gaia DR3 catalogue. A comparison with the Gaia data indicates that our estimates serve as upper limits for the frequency estimates, but more accurate values would require calculations on a star-by-star basis.
For a significant subset of the sample (9.9% in total, 4.8% of RRab stars, and 34.3% of RRc ones), the period calculations yielded quite different results, as is demonstrated in the case of EPIC 214586963 (Figure 1), in which the frequencies for the star differ by 1 d−1. We managed to determine a clear pattern in the frequency differences, which is shown in Figure 2. For 7.4% of the whole sample (3.7% of RRab and 25.3% of RRc stars) we found an alias in the frequencies, meaning that the frequencies given in the Sesar et al. (2017) catalogue are 1.0 or 2.0 d−1 off compared to the frequencies derived from the K2 light curves. It is clearly visible that there is an asymmetry in the alias frequencies; the frequencies determined from the Pan-STARRS light curves are more frequently 1.0 d−1 shorter than longer. For the remaining 2.5% of stars (1.2% of RRab and 9.0% of RRc stars), we found discrepancies between the two frequencies, yet no aliases. For the outlier stars that also have Gaia DR3 variability data, in 63.6% of cases the frequency given by Gaia is in agreement with the K2 frequencies.
In Figure 2, we compare the identified frequencies for each star using K2, Pan-STARRS, and even Gaia DR3 data when available. We found that when there is a mismatch in the frequencies, it is likely to be off by 1.0 or 2.0 d−1, the 1.0 d−1 offset being the most common one. This trend is observable in both Pan-STARRS versus K2 and Pan-STARRS versus Gaia comparisons, but not in the K2 versus Gaia analysis. Therefore, for stars with discrepant period values, we recommend using the K2 or Gaia periods instead of the Pan-STARRS values.
The explanation for this finding is the biases present in the different kinds of observations. K2 and Gaia are space telescopes, able to make observations both during daytime and nighttime, but Pan-STARRS, being a ground-based telescope, could observe only during local nighttime. These regularly missing intervals from the sampling are likely the causes of this phenomenon.
We analysed not only the frequencies of the variables, but also their classifications. We compared the classification given in the Sesar et al. (2017) catalogue (RRab or RRc) with the classification that resulted from the visual inspection of the K2 light curves. We found that for 95.6% of the stars (97.7% of RRab stars and 85.8% of RRc stars), the classifications were consistent. In five cases, classification based on the K2 light curve was not possible due to the quality of the light curve. With these exceptions, we are confident that the K2-based classification is the correct one. Among the stars that were misclassified, we found examples where, although the star was an RR Lyrae type star, the correct subtype was different; for example, RRd instead of RRab or RRc instead of RRab and vice versa. We found 12 cases in which based on the K2 light curves the star is clearly not an RR Lyrae star, but rather another type of variable, such as BL Herculis, δ Scuti, an anomalous Cepheid star, or an eclipsing binary. In total, 29.6% of the misclassified stars have matching frequencies, 46.3% have aliases, and 24.1% have different frequencies from K2 and Pan-STARRRS. The results are summarized in Table 1.
The distribution of the frequency differences is shown in Figure 3. From the second and third panels of the plot, it is obvious that RRc stars are disproportionately affected. This could be attributed to the fact that the RRc light curve shape is more sinusoidal. Furthermore, the fits done by Sesar et al. (2017) find frequencies lower by 1.0 d−1 significantly more often. This suggests that assumptions made for the preferred frequency range could also have affected the results, preferring lower frequency fits for those stars. When considering the classifications, it is important to note that we find misclassified stars in all three groups, not just in the period mismatch group, which indicates that just because the classification is not accurate, the given frequency can be.
The distribution of the probability scores of the overlapping sample stars is presented in Figure 4. These scores are given in the Sesar et al. (2017) catalogue and are indicators of their RR Lyrae classification quality. As is apparent from the semi-log scale charts, the vast majority of the stars have a probability score at the higher end for each sub-class. Although in the case of the stars with matching periods there does not seem to be a relation between the probability score values and the number of misclassified stars, in the case of the alias group and especially in the period mismatch group, as was expected, we tend to find more misclassified stars among those that have lower-probability score values in the Sesar et al. (2017) catalogue. This effect is particularly noticeable in case of the RRc stars.
Finally, we compare the brightnesses of the variables in Figure 5. From the Pan-STARRS datasets, we used the g-filter data to compare with the K2 Kp magnitudes. The brightnesses derived from the K2 and the Pan-STARRS light curves are in agreement for the majority of the stars in the sample; however, there are cases with significant differences in the magnitudes. There is no visible link between the correctness of the period or classification of the stars and the brightness differences. The discrepancies are rather due to the uncertainties in the determination of the brightnesses.
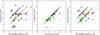 |
Fig. 2 Frequency comparisons of the sample. The figure shows the comparisons of the periods determined from different datasets. For Pan-STARRS, the Sesar et al. (2017) catalogue period was used, for Gaia DR3, the Gaia RR Lyrae catalogue period was used, and for K2, our calculated values were used, which we obtained with the Lomb–Scargle periodogram method. The plot symbols are colour-coded based on the Pan-STARRS vs. K2 frequency comparison. Green dots indicate the stars that have matching frequencies, blue dots indicate the stars that have an alias of 1 or 2 cycles/day in their Pan-STARRS frequencies, and red dots signify the stars that have discrepancies between their K2 and Pan-STARRS frequencies that are not aliases. Black circles mark the stars that we found to be misclassified in the Sesar et al. (2017) catalogue. |
Summary of the result of the frequency analysis.
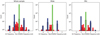 |
Fig. 3 Distibution of frequency differences for each sub-type of RR Lyrae stars. The classification types were taken from the Sesar et al. (2017) catalogue. Green indicates the stars that have matching frequencies, blue indicates the stars that have an alias of 1 or 2 cycles/day in their Pan-STARRS frequencies, and red signifies the stars that have discrepancies between their K2 and Pan-STARRS frequencies that are not aliases. The dot-edged black columns show the number of misclassified stars within each bin. |
4 Summary and conclusions
The Pan-STARRS 3π survey has detected a vast number of RR Lyrae stars, but these light curves are sparsely sampled, and the observations were only possible during local nighttime as a result of it being a ground-based telescope. On the other hand, the K2 mission only observed a limited fraction of the sky in each of its campaigns, but did so with a much higher sampling frequency, and thanks to the fact that it was a space mission, the time series are quasi-continuous. Their data can complement each other: Kepler provides high-time-resolution light curves for a shorter period of time for a limited number of stars, whereas Pan-STARRS provides more sparsely sampled data but for a longer time span and for significantly more stars. Because of this, we decided to investigate their overlap. To carry out a more thorough analysis, we used the Gaia DR3 data as well, wherever it was available.
For the comparison, we derived the classification and period information from the Sesar et al. (2017) catalogue. From the K2 data, we used the available autoEAP light curves and calculated the periods with the Lomb–Scargle periodogram method. We found that for the majority of the stars (95.6%), the classification was consistent, but we also found some exceptions; for example, some RRd stars were classified as RRab or RRc stars, or the stars were other type of pulsators or eclipsing binaries instead.
During the investigation of the periods, we found that for the majority (90.1%) of the stars, the periods derived from the Pan-STARRS and K2 data are consistent. However, we found a significant subset of stars (9.9%) that seem to have different periods from the two missions.
Analysing the frequencies, it became apparent that there is a systematic difference between the periods calculated from K2 and those from the catalogue in the case of some stars (7.4% of the sample). We found that the Pan-STARRS frequencies were usually 1 or 2 d−1 off from the K2 periods. This discrepancy strongly affected the RRc periods, with a quarter of them (25.3%) being alias values instead of the true ones. The explanation of this alias is the fact that because Pan-STARRS observed from the ground, and therefore could only make measurements during nighttime, the sampling is not even, compared to the time series of the K2 mission. The Gaia periods (where available) are in agreement with the K2 periods in most cases (94.6%). In terms of the remainder, for 3.33% of the stars only the Gaia frequency is off and the K2 and Pan-STARRS frequencies are in agreement, and for 1.48% of the stars all three frequencies are different.
Our research concludes that although Pan-STARRS observed a huge number of stars with measurements spanning a long time interval (4 years), it was still important and insightful to compare the data with the K2 mission data, not only because K2 offers a more evenly and frequently sampled light curve, but more importantly because there are aliases in the determined frequencies due to the observing time bias of ground-based detections and these aliases are not necessarily symmetrical. In our case it was more likely to find the Pan-STARRS frequency (Sesar et al. 2017) to be 1 d−1 lower than higher than the K2 frequency.
The conclusions of the study are important in the era of big surveys such as the Vera C. Rubin Observatory’s LSST (Legacy Survey of Space and Time) sky survey (Ivezić et al. 2019). The LSST program will produce an unprecedented amount of data on the stars in the southern hemisphere for ten years with a relatively sparse cadence. Therefore, validating the ground-based data against space-based observations is critical in being able to identify the possible aliases and other artefacts in the dataset that can later be taken into account during data reduction in order to get more precise and accurate results.
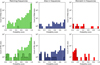 |
Fig. 4 RR Lyrae classification probability score distribution of the crossmatched sample. The classification probability score of each star was given in the Sesar et al. (2017) catalogue. The color green refers to the stars with matching frequencies from K2 and Pan-STARRS, blue denotes stars that have an alias in their frequency from Pan-STARRS, and red is for the stars that have a difference in their frequencies. The dot-edged black columns show the number of misclassified stars within each bin. |
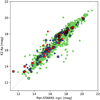 |
Fig. 5 Brightness comparison of the sample. Pan-STARRS g magnitudes are shown on the horizontal axis, while Kepler Kp magnitudes are plotted for each star on the vertical axis. The green dots denote stars that have the same frequency from both K2 and Pan-STARRS data, the blue dots are stars that have an alias of 1 or 2 d−1 in their Pan-STARRS frequencies, and red dots mark the stars for which there is a different discrepancy in the periods. Black circles mark the stars that we found to be misclassified in the Sesar et al. (2017) catalogue. |
Data availability
Full Table A.1 is available at the CDS via anonymous ftp to cdsarc.cds.unistra.fr (130.79.128.5) or via https://cdsarc.cds.unistra.fr/viz-bin/cat/J/A+A/689/A189
Acknowledgements
This project has been supported by the Lendület Program of the Hungarian Academy of Sciences, project No. LP2018-7/2022, the KKP-137523 ‘SeismoLab’ Élvonal and the NKFIH SNN-147362 grants of the Hungarian Research, Development and Innovation Office (NKFIH). This work was also supported by the NKFIH excellence grant TKP2021-NKTA-64. This paper includes data collected by the Kepler mission and obtained from the MAST data archive at the Space Telescope Science Institute (STScI). Funding for the Kepler mission is provided by the NASA Science Mission Directorate. STScI is operated by the Association of Universities for Research in Astronomy, Inc., under NASA contract NAS 5–26555. The Pan-STARRS1 Surveys (PS1) and the PS1 public science archive have been made possible through contributions by the Institute for Astronomy, the University of Hawaii, the Pan-STARRS Project Office, the Max-Planck Society and its participating institutes, the Max Planck Institute for Astronomy, Heidelberg and the Max Planck Institute for Extraterrestrial Physics, Garching, The Johns Hopkins University, Durham University, the University of Edinburgh, the Queen’s University Belfast, the Harvard-Smithsonian Center for Astrophysics, the Las Cumbres Observatory Global Telescope Network Incorporated, the National Central University of Taiwan, the Space Telescope Science Institute, the National Aeronautics and Space Administration under Grant No. NNX08AR22G issued through the Planetary Science Division of the NASA Science Mission Directorate, the National Science Foundation Grant No. AST-1238877, the University of Maryland, Eötvös Loránd University (ELTE), the Los Alamos National Laboratory, and the Gordon and Betty Moore Foundation. This work has made use of data from the European Space Agency (ESA) mission Gaia (https://www.cosmos.esa.int/gaia), processed by the Gaia Data Processing and Analysis Consortium (DPAC, https://www.cosmos.esa.int/web/gaia/dpac/consortium). Funding for the DPAC has been provided by national institutions, in particular the institutions participating in the Gaia Multilateral Agreement.
Appendix A Table of investigated RR Lyrae variables
The main properties of the investigated RR Lyrae variables.
References
- Aerts, C., Christensen-Dalsgaard, J., & Kurtz, D. W. 2010, Asteroseismology (Springer) [CrossRef] [Google Scholar]
- Astropy Collaboration (Price-Whelan, A. M., et al.) 2022, ApJ, 935, 167 [NASA ADS] [CrossRef] [Google Scholar]
- Bódi, A., Szabó, P., Plachy, E., Molnár, L., & Szabó, R. 2022, PASP, 134, 014503 [CrossRef] [Google Scholar]
- Borucki, W. J. 2016, Rep. Progr. Phys., 79, 036901 [Google Scholar]
- Borucki, W. J., Koch, D., Basri, G., et al. 2010, Science, 327, 977 [Google Scholar]
- Catelan, M., & Smith, H. A. 2015, Pulsating Stars (Wiley-VCH) [CrossRef] [Google Scholar]
- Chambers, K. C., Magnier, E. A., Metcalfe, N., et al. 2016, arXiv e-prints [arXiv:1612.05560] [Google Scholar]
- Clementini, G., Ripepi, V., Garofalo, A., et al. 2023, A&A, 674, A18 [NASA ADS] [CrossRef] [EDP Sciences] [Google Scholar]
- D’Orazi, V., Storm, N., Casey, A. R., et al. 2024, MNRAS, 531, 137 [CrossRef] [Google Scholar]
- Drake, A. J., Catelan, M., Djorgovski, S. G., et al. 2013, ApJ, 763, 32 [NASA ADS] [CrossRef] [Google Scholar]
- Eyer, L., Audard, M., Holl, B., et al. 2023, A&A, 674, A13 [NASA ADS] [CrossRef] [EDP Sciences] [Google Scholar]
- Gaia Collaboration (Vallenari, A., et al.) 2023, A&A, 674, A1 [NASA ADS] [CrossRef] [EDP Sciences] [Google Scholar]
- Hernitschek, N., Schlafly, E. F., Sesar, B., et al. 2016, ApJ, 817, 73 [Google Scholar]
- Howell, S. B. Sobeck, C., Haas, M., et al. 2014, PASP, 126, 398 [NASA ADS] [CrossRef] [Google Scholar]
- Huber, D., Bryson, S. T., Haas, M. R., et al. 2016, ApJS, 224, 2 [Google Scholar]
- Ibata, R. A., Gilmore, G., & Irwin, M. J. 1994, Nature, 370, 194 [Google Scholar]
- Iorio, G., & Belokurov, V. 2021, MNRAS, 502, 5686 [Google Scholar]
- Ivezić, Ž., Kahn, S. M., Tyson, J. A., et al. 2019, ApJ, 873, 111 [Google Scholar]
- Lund, M. N., Handberg, R., Davies, G. R., Chaplin, W. J., & Jones, C. D. 2015, ApJ, 806, 30 [NASA ADS] [CrossRef] [Google Scholar]
- Minniti, D., Dékány, I., Majaess, D., et al. 2017, AJ, 153, 179 [Google Scholar]
- Mullally, F., Barclay, T., & Barentsen, G. 2016, K2fov: Field of view software for NASA’s K2 mission, Astrophysics Source Code Library, [record ascl:1601.009] [Google Scholar]
- Pojmanski, G. 1997, Acta Astron., 47, 467 [Google Scholar]
- Sesar, B., Ivezić Ž., Grammer, S. H., et al. 2010, ApJ, 708, 717 [NASA ADS] [CrossRef] [Google Scholar]
- Sesar, B., Ivezić, Ž., Stuart, J. S., et al. 2013, AJ, 146, 21 [NASA ADS] [CrossRef] [Google Scholar]
- Sesar, B., Hernitschek, N., Mitrović, S., et al. 2017, AJ, 153, 204 [NASA ADS] [CrossRef] [Google Scholar]
- Tonry, J. L., Stubbs, C. W., Lykke, K. R., et al. 2012, ApJ, 750, 99 [Google Scholar]
- Udalski, A., Szymanski, M., Kaluzny, J., Kubiak, M., & Mateo, M. 1992, Acta Astron., 42, 253 [NASA ADS] [Google Scholar]
- Van Cleve, J. E., Howell, S. B., Smith, J. C., et al. 2016, PASP, 128, 075002 [CrossRef] [Google Scholar]
- Weisz, D. R., Dolphin, A. E., Dalcanton, J. J., et al. 2011, ApJ, 743, 8 [NASA ADS] [CrossRef] [Google Scholar]
- Woźniak, P. R., Vestrand, W. T., Akerlof, C. W., et al. 2004, AJ, 127, 2436 [Google Scholar]
- York, D. G., Adelman, J., John E. Anderson, J., et al. 2000, AJ, 120, 1579 [NASA ADS] [CrossRef] [Google Scholar]
All Tables
All Figures
|
Fig. 1 Light curve comparison for a sample RR Lyrae star. The upper left panel visualises the Pan-STARRS light curve of the star, in all five filters, and the lower left panel shows the light curve phase-folded with the period given in the (Sesar et al. 2017) catalogue. In order to make the periodicity more transparent, we shifted the AB magnitude levels of each filter’s light curve by adding 0, 1, 2, 3, 4 magnitudes to the g, r, i, z, y filter light curves. The upper right panel illustrates the K2 light curve, while the lower right panel shows the light curve phase-folded with the period that was determined by the Lomb–Scargle periodogram method. |
| In the text | |
|
Fig. 2 Frequency comparisons of the sample. The figure shows the comparisons of the periods determined from different datasets. For Pan-STARRS, the Sesar et al. (2017) catalogue period was used, for Gaia DR3, the Gaia RR Lyrae catalogue period was used, and for K2, our calculated values were used, which we obtained with the Lomb–Scargle periodogram method. The plot symbols are colour-coded based on the Pan-STARRS vs. K2 frequency comparison. Green dots indicate the stars that have matching frequencies, blue dots indicate the stars that have an alias of 1 or 2 cycles/day in their Pan-STARRS frequencies, and red dots signify the stars that have discrepancies between their K2 and Pan-STARRS frequencies that are not aliases. Black circles mark the stars that we found to be misclassified in the Sesar et al. (2017) catalogue. |
| In the text | |
|
Fig. 3 Distibution of frequency differences for each sub-type of RR Lyrae stars. The classification types were taken from the Sesar et al. (2017) catalogue. Green indicates the stars that have matching frequencies, blue indicates the stars that have an alias of 1 or 2 cycles/day in their Pan-STARRS frequencies, and red signifies the stars that have discrepancies between their K2 and Pan-STARRS frequencies that are not aliases. The dot-edged black columns show the number of misclassified stars within each bin. |
| In the text | |
|
Fig. 4 RR Lyrae classification probability score distribution of the crossmatched sample. The classification probability score of each star was given in the Sesar et al. (2017) catalogue. The color green refers to the stars with matching frequencies from K2 and Pan-STARRS, blue denotes stars that have an alias in their frequency from Pan-STARRS, and red is for the stars that have a difference in their frequencies. The dot-edged black columns show the number of misclassified stars within each bin. |
| In the text | |
|
Fig. 5 Brightness comparison of the sample. Pan-STARRS g magnitudes are shown on the horizontal axis, while Kepler Kp magnitudes are plotted for each star on the vertical axis. The green dots denote stars that have the same frequency from both K2 and Pan-STARRS data, the blue dots are stars that have an alias of 1 or 2 d−1 in their Pan-STARRS frequencies, and red dots mark the stars for which there is a different discrepancy in the periods. Black circles mark the stars that we found to be misclassified in the Sesar et al. (2017) catalogue. |
| In the text | |
Current usage metrics show cumulative count of Article Views (full-text article views including HTML views, PDF and ePub downloads, according to the available data) and Abstracts Views on Vision4Press platform.
Data correspond to usage on the plateform after 2015. The current usage metrics is available 48-96 hours after online publication and is updated daily on week days.
Initial download of the metrics may take a while.