| Issue |
A&A
Volume 695, March 2025
|
|
|---|---|---|
| Article Number | A88 | |
| Number of page(s) | 25 | |
| Section | Galactic structure, stellar clusters and populations | |
| DOI | https://doi.org/10.1051/0004-6361/202452619 | |
| Published online | 11 March 2025 | |
Give to Ursa Minor what is Ursa Minor’s: An updated census of the RR Lyrae population in the Ursa Minor dwarf galaxy based on Gaia DR3
INAF, Osservatorio di Astrofisica e Scienza dello Spazio di Bologna,
via Piero Gobetti 93/3,
40129
Bologna, Italy
★ Corresponding author; This email address is being protected from spambots. You need JavaScript enabled to view it.
Received:
15
October
2024
Accepted:
29
January
2025
Abstract
Aims. We used RR Lyrae stars identified by the Gaia third data release (DR3) to explore the outskirts of the Ursa Minor (UMi) dwarf spheroidal galaxy (dSph) and update the census of its variable star population.
Methods. We adopted different tools based on the Gaia DR3 astrometric and photometric data (proper motions, Period–Wesenheit–Metallicity relations, spatial distribution, colour–magnitude diagram and stellar isochrone fitting) to discriminate between different types of variable stars, and to identify UMi members.
Results. We found a total of 129 RR Lyrae stars and 10 Anomalous Cepheids (ACs) that belong to UMi. In this paper we report 47 new RR Lyrae stars (46 bona fide and 1 candidate) and 5 new ACs (4 bona fide and 1 candidate), including new possible members in the extreme periphery of the galaxy at a distance of ∼12 half-light radii. We reclassified 13 RR Lyrae stars identified by the Gaia DR3 Specific Object Study pipeline for Cepheids and RR Lyrae stars (SOS Cep&RRL), using data from the literature and Gaia astrometry and photometry. Specifically, we assigned these 13 DR3 RR Lyrae stars to ten Anomalous Cepheids and three doublemode RR Lyrae (RRd), respectively. From the average luminosity of the RR Lyrae stars we derive for UMi a distance modulus of (m − M)0 = 19.23 ± 0.11 mag, in excellent agreement with the literature. Finally, we investigated whether some of UMi’s variable stars might be members of the ultra-faint stellar cluster Muñoz 1 that lies at a projected distance of 45′ from UMi’s centre. Based on the properties of the variable stars (distances, colours, and metallicities), we find it unlikely that they belong to the cluster.
Key words: stars: Population II / pulsars: general / stars: variables: RR Lyrae / Galaxy: halo / galaxies: dwarf
© The Authors 2025
 Open Access article, published by EDP Sciences, under the terms of the Creative Commons Attribution License (https://creativecommons.org/licenses/by/4.0), which permits unrestricted use, distribution, and reproduction in any medium, provided the original work is properly cited.
This article is published in open access under the Subscribe to Open model. This email address is being protected from spambots. You need JavaScript enabled to view it. to support open access publication.
1 Introduction
RR Lyrae stars are pulsating variables widely used as tracers of old, metal-poor stellar populations in the Milky Way (MW) and the Local Group (LG) galaxies. These stars are an important asset in the study of resolved stellar populations, as their properties allow us to infer the indirect parameters such as distance, age, metallicity, and reddening of their host systems (Sarajedini 2011 and references therein). As low-mass (M<1 M⊙), heliumburning, horizontal branch (HB) stars, RR Lyrae have typical ages exceeding 10 Gyr and predominantly subsolar metallicities, although their iron abundances span a wide range: −2.5< [Fe/H] <0.2 dex (Smith 1995; Catelan & Smith 2015 and references therein). With pulsation periods ranging from 0.2 to 1 day, they are frequently, but not only, identified in dwarf spheroidal (dSph) and ultra-faint dwarf spheroidal satellites of the MW. These systems are typically dominated by old (population II) stars, making RR Lyrae stars fundamental tracers of their stellar content and evolutionary history.
The Gaia third data release (DR3; Gaia Collaboration 2023) published positions and distances for nearly two billion sources observed during the initial 34 months of science operations, and multi-epoch photometry allowing the identification of more than 10 million variable sources. A final catalogue of 270 891 RR Lyrae stars processed through the Specific Object Study pipeline for Cepheids and RR Lyrae stars (SOS Cep&RRL, Clementini et al. 2023 and references therein) has been published in Gaia DR3. They are distributed all-sky tracing the MW outer halo, its stellar streams, and the old component of its satellites as far as 100 kpc from us. To date, this is the largest, most homogeneous, and most parameter-rich catalogue of all-sky RR Lyrae stars published in the G magnitude range from ∼7 to ∼21 mag. For almost all of them Gaia DR3 provided astrometry (individual parallaxes and proper motions), photometry (epoch and mean G, GBP , and GRP magnitudes), pulsation characteristics (e.g. period, amplitude, Fourier parameters) and, based on this last, individual photometric metallicity and G absorption values for nearly one-half of the sample (for details, see Clementini et al. 2019, 2023).
Gaia, and Gaia DR3 in particular, has had a huge impact on the role of RR Lyrae stars as standard candles and stellar population tracers. Based on the Gaia DR3 parallaxes the luminosity–metallicity (LZ) relation followed by RR Lyrae stars in the visual, and the period–luminosity–(metallicity) and period–Wesenheit–(metallicity) (PW(Z)) relations followed in the infrared were recalibrated (Prudil et al. 2024 in the optical bands; Garofalo et al. 2022; Li et al. 2023; Prudil et al. 2024 in the Gaia bands; and Zgirski et al. 2023; Prudil et al. 2024 in the infrared). The pulsation properties of the Gaia DR2 and DR3 RR Lyrae stars also allowed the empirical recalibration of the photometric metallicity relations for these variable stars (Iorio & Belokurov 2021; Li et al. 2023; Muraveva et al. 2024). Furthermore, studies based on Gaia DR3 have analysed the spatial distribution of RR Lyrae stars in dSph and ultra-faint dwarf satellites of the MW, uncovering extended stellar halos and population structures in these systems (Tau et al. 2024 and reference therein).
According to the Λ Cold Dark Matter (ΛCDM) model of hierarchical structure formation (Searle & Zinn 1978), the MW dSph satellites may have been involved in the formation and evolution of our Galactic halo as witnesses and/or leftovers of the MW assembling history. Studying their resolved stellar populations allows us to improve our knowledge of their properties and shed light on whether they contribute to the Galactic halo formation and evolution. With unprecedented Gaia data, several studies have explored the extreme outskirts of the MW satellites and found member stars up to 9–10 half-light radii (rh) away from the centre of these galaxies, as for instance in Tucana II (Chiti et al. 2021), Sculptor, and Ursa Minor (Jensen et al. 2024).
The Ursa Minor (UMi) dSph galaxy, discovered by Wilson (1955), is among the smallest and faintest galaxies in the LG (MV = −8.8 mag; McConnachie 2012 and reference therein). As one of the first MW satellites to be identified, UMi has been extensively studied through photometric and spectroscopic observations over the decades. It is widely known that UMi appears to be dominated by a very old (t > 10 Gyr) and metalpoor ([Fe/H] ~ −2 dex) stellar population (see Mateo 1998; Mighell & Burke 1999; Dolphin 2002; Bellazzini et al. 2002). In particular, Bellazzini et al. (2002) revealed that UMi has a sizeable metallicity spread (σ[Fe/H] =0.10 dex), indicating rapid self-enrichment within a few gigayears in its early history. They also identified a massive CDM halo, that is possibly preventing the formation of significant substructures among its stars, and observed strong asymmetry in the galaxy’s inner regions.
Kirby et al. (2010, 2011) obtained multi-element abundances from medium-resolution spectroscopy with DEIMOS at the Keck Observatory for 212 red giant branch (RGB) stars in UMi finding an average metallicity of [Fe/H] = −2.13 ± 0.01 dex with a spread (σ[Fe/H]) of 0.34 dex and a negligible metallicity gradient over an inner region within 3 half-radii of the galaxy. Using the same instrumental set-up Pace et al. (2020) later expanded the spectroscopic dataset. They confirmed the membership in UMi of 892 stars, the most distant being about ~5.5 times the galaxy half-light radius (rh), and identified two distinct populations with different properties: a first kinematically cold, less metal-poor ([Fe/H] = −2.05 ± 0.03 dex) and centrally concentrated population, and a second kinematically hot, more metal-poor ![Mathematical equation: $\left( {\left[ {{\rm{Fe/H}}} \right] = - 2.29_{ - 0.06}^{ + 0.05}{\rm{dex}}} \right)$](/articles/aa/full_html/2025/03/aa52619-24/aa52619-24-eq1.png) , and spatially extended population. They also observed that members on the outskirts dominated by metal-poor stars are more spherically distributed (with ϵ = 0.33) than the galaxy’s overall ellipticity (ϵ = 0.55; McConnachie & Venn 2020) and the metal-rich stars (ϵ = 0.75). More recently, Sestito et al. (2023) used high-resolution spectra (R ~ 40 000) obtained with GRACES at the Gemini- North telescope to measure radial velocities and metallicities for five member stars located between 5 and 12 times the UMi rh , revealing that the galaxy has a larger structure than previously thought extending to ~ 12×rh (or ~4.5 kpc from the centre), approaching the tidal radius of 5–6 kpc estimated by Pace et al. (2020). To conclude the overview of UMi and its outer halo, Muñoz et al. (2012) serendipitously discovered an ultra-faint stellar system, Muñoz 1, using the wide-field MegaCam imager on the Canada-France-Hawaii Telescope. Muñoz 1 is located 45′ (~30 kpc) from the centre of UMi at a heliocentric distance of 45 ± 0.5 kpc from us; despite the very close angular separation, the system is not associated with the dSph.
, and spatially extended population. They also observed that members on the outskirts dominated by metal-poor stars are more spherically distributed (with ϵ = 0.33) than the galaxy’s overall ellipticity (ϵ = 0.55; McConnachie & Venn 2020) and the metal-rich stars (ϵ = 0.75). More recently, Sestito et al. (2023) used high-resolution spectra (R ~ 40 000) obtained with GRACES at the Gemini- North telescope to measure radial velocities and metallicities for five member stars located between 5 and 12 times the UMi rh , revealing that the galaxy has a larger structure than previously thought extending to ~ 12×rh (or ~4.5 kpc from the centre), approaching the tidal radius of 5–6 kpc estimated by Pace et al. (2020). To conclude the overview of UMi and its outer halo, Muñoz et al. (2012) serendipitously discovered an ultra-faint stellar system, Muñoz 1, using the wide-field MegaCam imager on the Canada-France-Hawaii Telescope. Muñoz 1 is located 45′ (~30 kpc) from the centre of UMi at a heliocentric distance of 45 ± 0.5 kpc from us; despite the very close angular separation, the system is not associated with the dSph.
From the variability point of view, the first studies of the UMi variable star population was led by van Agt (1967) which identified 93 variable stars in the galaxy publishing photometry for 39 of them and periods for 29. Later, Kholopov (1971) used van Agt’s photometry to derive periods for an additional ten stars.
The most recent and complete study of UMi variable sources was published by Nemec et al. (1988). They identified 95 variable stars determining accurate pulsation properties for 89 of them: 82 were classified as RR Lyrae stars and 7 as Anomalous Cepheids (ACs). All the variable stars identified in UMi so far are located within the inner regions of the galaxy. With this work, we aim to reclassify and derive more accurate properties for the already known variable stars in UMi. Furthermore, using Gaia DR3 we explored the outer regions of this dSph to update the census of UMi’s variable star members. In particular, by better defining the distribution and extension of UMi’s RR Lyrae stars we obtained hints on the structure and geometry of UMi’s ancient stellar population and its potential links with the MW stellar halo.
The paper is organised as follows. The starting sample of variables that are potentially members of UMi selected using Gaia DR3 data is described in Section 2. Section 3 introduces the Gold sample of RR Lyrae stars, which we used to determine the distance to UMi. In Sections 4 and 5, we describe the methods and tools adopted to confirm UMi’s known and new ACs and RR Lyrae stars. Their updated census is presented in Section 6 and, in Section 7, we also discuss the possibility that some variables might belong to Muñoz 1. Finally, Section 8 summarises the paper’s main results and conclusions.
Centre coordinates and structural parameters of UMi adopted in this work reported with the respective references.
2 Data from Gaia DR3
We retrieved from the Gaia DR3 catalogues all sources contained in a circle of 3.5 degrees in radius from UMi centre coordinates (Table 1). We chose this area because it coincides with 12 half-light radii from UMi’s centre. This is approximately the most external radius where UMi member stars have been found by Sestito et al. (2023, ~11.7× rh). The query1 to the Gaia archive returned a total of 160 689 sources. Figure 1 shows the spatial distribution of these sources. The inner green dashed ellipse represents the area enclosed within 3 times UMi’s rh according to Sestito et al. (2023). The outer ellipses track areas which cover 5, 11 and 12 times UMi’s rh, respectively. In the map a lime cross indicates the centroid of the faint cluster Muñoz 1 with respect to UMi’s centre. To more safely identify stars belonging to UMi we cross-matched the 160 689 sources extracted from the Gaia DR3 catalogue against the list of 212 RGB members of UMi spectroscopically confirmed by Kirby et al. (2010). We recovered 166 of them (~ 78%). Their metallicity ranges from −1.43 to −3.81 dex.
These spectroscopically confirmed members all lie in the inner area defined by UMi’s rh. They are marked by red open circles in Fig. 1, but are totally covered by the variable stars (magenta filled circles in Fig. 1). We also counter-identified member stars of UMi published by Pace et al. (2020, RGB and HB stars; orange filled circles in the left panel of Fig. 1 and following figures) and Sestito et al. (2023, RGB stars; blue empty squares) recovering 705 sources from Pace et al. (2020) with probability >0.95 to be UMi’s members. Among them, 157 objects are in common with the RGB stars that we cross-matched from Kirby et al. (2010). The magenta filled circles in the left panel of Fig. 1 mark 164 RR Lyrae stars validated and characterised by the Gaia SOS Cep & RR Lyrae pipeline (vari_rrlyrae; Clementini et al. 2023), whereas cyan filled circles mark 4 RR Lyrae candidates identified by the general classifier of the Gaia variability pipeline, which relies on supervised machine learning techniques (vari_classifier_result; Rimoldini et al. 2023) (see Section 3 for details). Adopting for UMi the structural parameters provided in Table 1, we find that the majority of RR Lyrae stars (126) are placed within the area covering 5 times the elliptical half-light radius of the galaxy, 22 are in the most peripheral areas between 5 and 12 times the rh , and 20 RR variables are beyond the extreme outskirts of the galaxy, traced by the outer ellipse corresponding to 12 elliptical half-light radii. In the right panel of the Fig. 1 we highlight the spatial distribution of the 168 sources in this area classified as RR Lyrae stars by Gaia DR3 colour-coding them according to their mean G magnitude. The majority of the RR Lyrae stars beyond 12 half-light radii very likely are not UMi’s members and rather belong to the MW field (see discussion in Section 4).
The colour–magnitude diagram (CMD) of the 160 thousand sources around UMi’s centre we selected from the Gaia DR3 archive is shown in the left panel of Fig. 2. As in Fig. 1 magenta and cyan filled circles mark RR Lyrae classified in the Gaia DR3 vari_rrlyrae and vari_classifier_result tables, respectively. The right panel of the figure provides a zoom-in view of the CMD. The 20 most external variable stars in Fig. 1 are now highlighted by yellow filled circles. The luminosity of many of them is incompatible with the mean magnitude of UMi’s HB (<GHB>~19.6 mag) confirming that it’s unlikely that they are RR Lyrae stars belonging to this galaxy. However, some of them may still be variable stars of UMi of a different type, they could indeed be Classical Cepheids (CCs) or, more likely, ACs. Finally, the variable star with Gaia source_id = 1669496020369252864 (named V169, later in the text) was dropped from the sample because its mean magnitude (G ∼ 21 mag) and (GBP–GRP) colour are not compatible with the distance and CMD of UMi making it unlikely that it could be an RR Lyrae star belonging to this dSph2.
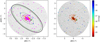 |
Fig. 1 Left panel: map of sources within a circle of 3.5 degrees in radius from UMi’s centre coordinates that we retrieved from the Gaia DR3 archive. The four ellipses show 3 (inner ellipse), 5, 11 and 12 times the galaxy rh (outer ellipse, black solid line) adopting the position angle ϕ, rh, and ellipticity from Sestito et al. (2023), and the centre coordinates of Irwin & Hatzidimitriou (1995) (see Table 1). A lime cross indicates the position of the cluster Muñoz 1. The magenta filled circles mark the sources classified as RR Lyrae stars in the Gaia DR3 vari_rrlyrae table that are located inside and outside 12 times the galaxy rh. Four cyan circles mark additional candidate RR Lyrae stars listed in the Gaia DR3 vari_classifier_result table. The red and orange open circles mark spectroscopically confirmed members of UMi respectively from Kirby et al. (2010) and Pace et al. (2020), the blue empty squares mark the furthest RGB members of UMi from Sestito et al. (2023). Right panel: same as in the left panel, but showing with filled circles only sources classified as RR Lyrae stars in the vari_classifier_result and vari_rrlyrae tables, colour-coded according to their mean G magnitude. |
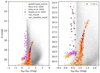 |
Fig. 2 Left: G, GBP–GRP CMD of all sources in our catalogue of ∼160 thousand objects within the area delimited by our selection around the centre of UMi. The magenta and cyan filled circles mark the RR Lyrae stars classified by Gaia DR3. The red, orange, and blue symbols mark the UMi members from Kirby et al. (2010), Pace et al. (2020), and Sestito et al. (2023), respectively. Right: zoomed-in image of the left panel. The yellow filled black circles highlight 20 sources classified as RR Lyrae by Gaia DR3, located beyond 12 times the elliptical half-light radius of the galaxy. |
3 RR Lyrae stars in UMi: The Gold sample
3.1 Selection based on previously known RR Lyrae and their spatial distribution
To distinguish RR Lyrae stars (or variables of other types) belonging to UMi from field variables, we started by identifying UMi’s known RR Lyrae stars in our initial dataset of 168 objects, based on previously published studies. We adopted, as a reference, the catalogue published by Nemec et al. (1988, hereafter N88) that is, so far, the most recent and complete inventory of UMi’s variable stars. Nemec and collaborators have identified in UMi 82 RR Lyrae stars (47 fundamental mode – RRab, and 35 first overtone – RRc, pulsators), 7 ACs and 5 variables without an accurate period determination (V14, V30, V65, V88 and V94), whereas two additional variables, V74 and V76, are outside their photographic plates. They reclassify and confirm nearly all the candidate variables previously identified in UMi by van Agt (1967). However, five of them were not confirmed to vary: V46, V85, V87, V89, and V91. These stars are only mentioned without a discussion and no identifying information (location on charts or coordinates) is provided.
We have followed the nomenclature and numbering by N88 and counter identified 82 variable stars in N88 catalogue among the 168 RR Lyrae stars classified in Gaia DR3, using a spatial cross-match radius of 2.5″. Of these 82 cross-identified variables, 75 are classified by N88 as RR Lyrae, 2 as probable RR Lyrae (V30 and V76), and 5 as ACs (discussed in Section 4). Seven of N88’s 82 bona fide RR Lyrae stars are missing among the 168 variables classified in Gaia DR3. Specifically, V12, V57, V84, and V95 are only in the Gaia main catalogue and are discussed in Section 5, while V86, V90, and V96 are not included in the Gaia DR3 source catalogue.
Periods and classifications published by N88 are based on an average of 20–22 phase points spanning a temporal baseline of more than 20 years. Gaia DR3 data, on the other hand, cover a time interval of only 34 months. The number of phase points in the G light curves used by the SOS Cep&RRL pipeline to determine the period and classification of the variable stars included in the area that we selected around UMi’s centre ranges from 16 for V169 to 62 for V178 (also named I later on). Hence the differences between the periods of the known variable stars of UMi in Gaia DR3 and in N88 (see Sections 4 and 5) are not due to an incorrect cross-identification of the sources but rather to the different number of phase points, although N88 spanned a larger time baseline they had on average fewer phase points than Gaia DR3 to infer the pulsation period.
We defined a clean sample of 57 confirmed RR Lyrae stars which have |PGaia – PN88| < 0.003 days3 and the same classification in type (RRab or RRc) in both catalogues. These 57 sources form our Gold sample of RR Lyrae stars in UMi.
The average number of phase points for the Gold sample RR Lyrae stars is 37, with minimum of 31 and maximum of 43 observations. As described in Clementini et al. (2023), the search for a secondary periodicity by the SOS Cep&RRL pipeline was activated only for sources having 40 or more measures in the DR3 G-band time series data and, with residuals from the best-fitting model of the G light curve folded with the primary periodicity larger than 0.05 mag. It is therefore possible that some of the RR Lyrae stars classified as c-type may have a second periodicity not searched for and actually be doublemode RR Lyrae (RRd stars). The Gold sample contains 19 RRc stars, we searched for a secondary periodicity 6 RRc stars in the Gold sample having num_clean_epochs_ɡ < 40 and period >0.36 d, the first overtone period range where RRd stars are more often found. We conclude that V49 and V81 could be candidate RRd stars. The Gold sample includes V30. This star is classified by N88 as an RR Lyrae with an uncertain period between two most plausible values: 0.33 and 0.25 days. We adopt for V30 the longer period that is in perfect agreement with the Gaia DR3 estimation.
Among the remaining 6 variable stars without an accurate period determination from N88, source V76 is one of the 20 counter-identified RR Lyrae stars that do not meet the Gold sample criterion. These 20 stars are discussed in Section 5. Stars V14, V74, V88 and V94 are not in the vari_rrlyrae table, hence we do not have pulsation properties from Gaia but we have photometric information from the Gaia general catalogue (see Section 5 for discussion). Finally, V65 is not in the Gaia general catalogue either, but the star is included among the Type II Cepheids in the General Catalogue of Variable Stars (Samus et al. 2017).
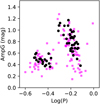 |
Fig. 3 Period-amplitude (Bailey) diagram in the G band for 164 variable stars in the area that we selected around UMi’s centre which are included in the vari_rrlyrae table. The black dots mark the 57 RR Lyrae stars of the Gold sample. |
3.2 Period amplitude and colour–magnitude diagrams
Figure 3 shows the period-amplitude diagram of the 57 RR Lyrae stars in the Gold sample (black filled circles) with respect to the sample of 164 variable stars (magenta filled circles – vari_rrlyrae table, for which periods and amplitudes are available) in the area that we selected around UMi’s centre. The position, hence pulsation properties, of the Gold sample stars correctly reflects their classifications in type: sources with shorter periods and smaller amplitudes are classified as RRc while sources classified as RRab stars are characterised by longer periods and larger amplitudes.
Identification and properties of the 57 RR Lyrae stars in the Gold sample are provided in Table A.1. The Gold sample includes 38 fundamental mode, 17 first overtone and 2 candidate double-mode RR Lyrae stars. The average period of the RRab stars is < Pab > = 0.637 ±0.062 days (average on 3 8 stars), the average period of the RRc stars is < Pc >= 0.3514 ± 0.037 days (average on 17 stars), or < Pc+d >= 0.3560 ± 0.038 days (average on 19 stars) including the candidate RRd stars.
We have used the Gold sample as reference to reclassify the known variables, to identify new RR Lyrae members of UMi (see Section 5), and to clean the galaxy CMD (see Section 6) along with the Gaia DR3 proper motions and sources belonging to UMi from the literature.
The spatial distribution of the 57 RR Lyrae stars in the Gold sample is shown by black dots in the left panel of Figure 4. All the Gold sample RR Lyrae are contained in the area enclosing 3 rh of the galaxy and have mean G magnitudes and GBP – GRP colours consistent with them being RR Lyrae members of UMi tracing the galaxy’s HB, as shown in the right panel of Fig. 4. Three sources, stars V60, V63 and V43 have bluer colours (GBP – GRP ~ 0 mag) and < GBP > magnitudes about one- half magnitude brighter than the other RR Lyrae stars. We have re-analysed their time series data confirming the pulsation periods published in DR3 but obtaining new < G >,< GBP > and < GRP > mean magnitudes (see the new pulsation characteristics and light curves for these stars in Appendix B) that correctly place the three stars within the instability strip on the HB, as shown in the right panel of Fig 4 where the 3 sources are plotted with violet filled circles on the CMD when using their revised magnitudes and colours (see Section 3.4).
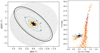 |
Fig. 4 Left panel: same as in the left panel of Fig. 1 but showing only the 57 RR Lyrae stars in the Gold sample plotted as black filled circles and using violet filled circles for V43, V60 and V63. We computed revised mean magnitudes for these three stars (see text for details). Right panel: G vs GBP – GRP CMD of UMi’s spectroscopically confirmed members and the 57 RR Lyrae stars in the Gold sample. Symbols are as in the left panel. The black crosses mark the V43, V60 and V63 positions on the CMD using the unrevised magnitudes. |
3.3 Membership confirmation based on proper motions
Proper motions published in Gaia DR3 can help to identify UMi’s members. The right panel of Fig. 5 shows the map of Gaia DR3 proper motion components for UMi’s RGB stars cross-identified from the Sestito et al. (2023), Pace et al. (2020), and Kirby et al. (2010) catalogues (blue, orange and red symbols, respectively) along with the proper motions of the whole sample of 168 variables (magenta filled circles) and the proper motions of the RR Lyrae stars in the Gold sample highlighted by black filled circles. The central panels of the figure show, from top to bottom, the proper motion maps of the three datasets separately. Finally, the left panels of Fig. 5 show the distribution of the two components of proper motions for the corresponding datasets. The proper motion distribution of the RR Lyrae stars in the Gold sample, highlighted by blue dashed lines in the bottom left plots and a blue dashed circle in the map on the right, seems to track perfectly the proper motions of UMi. In contrast, the distribution is rather broad for the whole sample of variable stars indicating that some of them are probably not members of the dSph. The distribution of RGB stars on the proper motion map as well as on the histograms also extend beyond the RR Lyrae Gold sample. We have tried to better understand the nature of this distribution in order to check whether the proper motions of RGB stars with values further away from the main concentration are reliable or not. In the left panel of Figure 6 the DR3 proper motions of UMi’s RGB stars are colour-coded according to their G magnitude showing that sources with G > 20 mag are also the furthest with respect to the main concentration of sources that is centred on the average values of UMi’s proper motions  Battaglia et al. 2022). As shown in the central panels of the same figure, these faint sources also have larger uncertainties on the proper motion components. In particular, uncertainties increase with magnitude, becoming larger at G ∼ 20 mag, which is approximately 0.5 mag fainter than the average < G > magnitude of UMi’s RR Lyrae stars, where the errors are around 0.55 mas/yr for both components. If we select RGB stars with most reliable proper motions, those with errors smaller than 0.55 mas/yr (filled circles), they are all concentrated and their distribution is totally coincident with the distribution of the Gold sample RR Lyrae stars (see right panel of Fig. 5) that, according to Gaia DR3 proper motions, are quite well positioned in the region where UMi’s member stars are located.
In the following, we use the RR Lyrae stars from the Gold sample along with RGB stars that quite solidly define the area of UMi member stars, as a proxy for identifying additional UMi members in the entire sample of 168 variable stars.
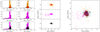 |
Fig. 5 Left panels: distribution of Gaia DR3 proper motion components for UMi RGB member stars (top panels) from Kirby et al. (2010) and Pace et al. (2020), for the whole sample of variable stars classified as RR Lyrae by Gaia (middle panels), and compared with UMi’s known RR Lyrae stars in the Gold sample (bottom panels). Central panels: Gaia DR3 proper motions maps for the three datasets shown in the left panels. The five RGB stars from Sestito et al. (2023) are marked by blue empty squares in the top central panel and in the right panel of the figure. Right panel: the proper motion map for all three datasets together. The proper motions of RR Lyrae stars included in the Gold sample are plotted with their uncertainties. The blue dashed lines in the bottom left panels and the blue dashed circle in the right panel mark the proper motion distribution range for RR Lyrae stars in the Gold sample. |
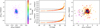 |
Fig. 6 Left panel: map of the Gaia DR3 proper motion components for member stars of UMi spectroscopically confirmed by Kirby et al. (2010), Pace et al. (2020) and Sestito et al. (2023). Sources are colour-coded according to their G magnitudes in the Gaia DR3 catalogue. Central panels: errors of the Gaia DR3 proper motion components plotted vs G magnitude for the sources in the left panel. The dashed lines show the 0.55 mas/yr threshold that we adopted to distinguish between reliable and less reliable proper motions. Right panel: Gaia DR3 proper motions of sources around UMi’s centre. The sources are colour-coded as in Figs. 2 and 5. In particular, the filled orange and red circles are RGB member stars of UMi with proper motion uncertainties smaller than 0.55 mas/yr. A lime cross marks the mean proper motions of the faint cluster Muñoz 1 according to Vasiliev & Baumgardt (2021). |
3.4 Distance determination
As a first step, we measured the distance to UMi from the Gold sample RR Lyrae stars adopting as fiducial the luminosity–metallicity relation in the G band, MG–[Fe/H], of Garofalo et al. (2022, Eq. (19)) that is based on 291 Galactic RR Lyrae stars with parallaxes published in Gaia Early DR3 (EDR3). We adopted for the interstellar extinction the value E(B–V) = 0.03 mag as traditionally used for UMi by many authors (Mateo 1998; Mighell & Burke 1999; Bellazzini et al. 2002; McConnachie 2012). This assumption is a reasonable compromise between 0.028 ± 0.001 mag and 0.032 ± 0.001 mag that we derived using Schlafly & Finkbeiner (2011) and Schlegel et al. (1998) maps covering an area of about 3 degrees around UMi centre. The observed mean G magnitudes were then dereddened using AG = 0.078 ±0.001 mag as derived from the relation AG/AV = 0.840 of Bono et al. (2019).
Several estimates of UMi average metallicity exist in the literature. We have adopted the recent estimate by Pace et al. (2020), who derived a mean metallicity of [Fe/H] = −2.13 ± 0.02 dex (with σ[Fe/H] = 0.35 ±0.01 dex dispersion) using the largest sample of stars in UMi, 892 members. This value is in excellent agreement with Kirby et al. (2011) mean metallicity of < [Fe/H] >= −2.13 ± 0.01 dex (with σ[Fe/H] = 0.34 dispersion) based on medium-resolution spectra of stars in the inner part of the galaxy. Adopting [Fe/H] = −2.13 ± 0.02 dex, we measure for UMi a distance modulus of 19.23 ± 0.11 mag (corresponding to d = 70 ± 4 kpc).The uncertainty on the distance modulus (hence distance), was obtained from error propagation considering the photometric uncertainties of the G magnitudes, the intrinsic scatter of the adopted MG –[Fe/H] relation, errors of 10−4 days in the period, the uncertainty of the AG estimation, and the uncertainty in the metallicity value. The adopted MG –[Fe/H] relation is based on metallicities in the Zinn & West (1984) scale. In studies combining spectroscopic and photometric datasets the Carretta et al. (2009) scale is widely used, due to its precision and consistency. Using transformations between the Zinn & West (1984) and Carretta et al. (2009) scales, as provided by Carretta et al. (2009), we calculated a difference of approximately 0.05 dex in the mean metallicity between the two scales. We have taken into account this offset in the computation of the distance modulus uncertainty.
Our distance modulus for UMi is in excellent agreement with the value derived by N88 [(m − M)0 = 19.24 ± 0.24 mag, corresponding to d = 70 ± 9 kpc]. In Figure 7, we have compared our distance modulus of UMi with literature estimates based on independent distance indicators collected in the NASA/IPAC Extragalactic Database (NED). We find that our result is in good agreement with the majority of the literature estimates. Our distance modulus is ∼0.26 mag longer than Cudworth et al. (1986) and Olszewski & Aaronson (1985) results. In their paper Olszewski & Aaronson (1985) noticed that their modulus is shorter than earlier values. On the other hand, Cudworth et al. (1986) estimate is based on the mean magnitude of a smaller number of RR Lyrae stars (∼40) observed in a region of UMi inner than in N88 work. The study of N88 has so far been the most complete in terms of identification and characterisation of the RR Lyrae population in UMi, therefore we consider the excellent agreement between our distance modulus and the one derived by N88 a solid proof of the validity of our results.
As a sanity check, we have plotted UMi’s Gold sample RR Lyrae stars on the Period-Wesenheit-Metallicity (PWZ) relation in the Gaia bands  , adopting the mean metallicity < [Fe/H] >= −2.13 dex, and the coefficient of the PWZ relation in Table 9 of Garofalo et al. (2022)4. Apparent Wesenheit magnitudes in the Gaia three bands were obtained from the Ripepi et al. (2019) relation:
 (1)
(1)
Here the G, GBP , and GRP mean magnitudes were taken from the vari_rrlyrae table and the appropriate λ value for RR Lyrae stars is λ = 1.922 (Garofalo et al. 2022). We then used the distance modulus of UMi derived in Sect. 3.4 (19.23 ± 0.09 mag) to scale the apparent Wesenheit magnitudes to absolute magnitudes5. Figure 8 shows the position of the Gold sample RR Lyrae on the PWZ plane, after transforming the first overtone pulsators into fundamental mode pulsators by adding +0.127 to the logarithm of the periods (Iben 1974). The solid line shows the Garofalo et al. (2022) PWZ relation with dashed lines indicating the ±3σ deviations. Three RR Lyrae stars, V43, V60 and V63, lie significantly below the PWZ relation. As noticed in Sect. 3, these stars have brighter < GBP > magnitudes and, in turn, fainter Wesenheit magnitudes than the other RR Lyrae in the Gold sample. We re-determined the intensity-averaged magnitudes of these sources from analysis of their Gaia light curves with Graphical Analyzer of Time Series (GRATIS), a private software developed at the Bologna Observatory by P. Montegriffo (see, e.g., Clementini et al. 2000). We confirmed the periods and classification published in Gaia DR3 which are also consistent with N88 results (see Appendix B.1), found new G magnitudes that do not differ significantly from those published in the vari_rrlyrae table6, while obtaining revised Wesenheit magnitudes that place the three stars within ±3σ from the PWZ relation (violet filled symbols in Fig. 8).
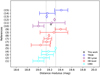 |
Fig. 7 Comparison of UMi distance modulus (grey filled circle), obtained using the Gold sample RR Lyrae stars and the MG –[Fe/H] relation, with literature measurements obtained from different methods and distance indicators: CMD (cyan), HB level (red), RR Lyrae stars (purple) and RGB Tip (blue). The dotted lines show the uncertainty (± 0.11 mag) associated with our distance modulus estimate (see text for details). References: (1) Olszewski & Aaronson (1985); (2) Kalirai et al. (2013); (3) Dolphin (2002); (4) Mighell & Burke (1999); (5) Weisz et al. (2014); (6) Irwin & Hatzidimitriou (1995); (7) Ruhland et al. (2011); (8) Webbink (1985); (9) Carrera et al. (2002); (10) Cudworth et al. (1986); (11) N88; (12) Tammann et al. (2008); (13) Frayn & Gilmore (2003); (14) Tully et al. (2013); (15) Bellazzini et al. (2002). |
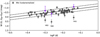 |
Fig. 8 Comparison of the Wesenheit magnitudes of UMi Gold sample RR Lyrae stars and the |

4 Anomalous Cepheids in UMi
4.1 Known ACs and variables brighter than UMi’s HB
In UMi, there are three ACs identified by van Agt (1967); Kholopov (1971) and later confirmed by N88: V6, V56 and V59. N88 added 4 new ACs (V1, V11, V62, V80) bringing to 7 the number of ACs identified in the dSph. Three further variable stars identified by N88, V19, V73 and V79, have mean magnitudes 0.20–0.27 mag brighter than UMi RR Lyrae and were classified by these authors as probable RR Lyrae stars evolved off the Zero Age HB (ZAHB; see for example Lee et al. 1990). These three sources are classified by Gaia as RR Lyrae stars and included in the DR3 vari_rrlyrae table. In particular, the G mean magnitudes of V19 (see Table A.1) and V79 (see Section 5 and Figs. 14 and 13) are perfectly consistent with the < G > magnitude defined by UMi’s Gold sample RR Lyrae stars. On the other hand, V73 is the brightest RR Lyrae in the Gold sample with G mean magnitude 0.24 mag brighter than the other stars, supporting N88’s hypothesis that the star is an evolved RR Lyrae. We note that the distance modulus of UMi obtained from the Gold sample RR Lyrae stars is almost unchanged if V73 is removed from the sample. In the selected area covering 3.5 degrees around the centre of UMi, out of a total sample of 168 variable stars classified as RR Lyrae stars in Gaia DR3, at least 43 sources have G mean magnitude ~5σ brighter than the HB level of UMi (< G >= 19.653 ± 0.081 mag, according to the mean G magnitude of the Gold sample RR Lyrae stars). These 43 variable stars with G < 19.25 mag could either be RR Lyrae belonging to the MW halo, or ACs belonging to UMi not correctly classified in Gaia DR3. We checked whether variable stars classified as CCs or ACs and published in the Gaia DR3 vari_cepheid table (Ripepi et al. 2023) are included in the area that we selected around the centre of the galaxy, but found none. We then tried to discriminate the nature of the 43 bright sources from the comparison with the  relations for ACs and CCs derived by Ripepi et al. (2023) and adopting the distance modulus of UMi obtained from the Gold sample RR Lyrae stars (Section 3.4). In Fig. 9 we show the position of the 43 bright variable stars on the
  plane. Solid lines in the upper left panels mark the relations from Ripepi et al. (2023) for first-overtone and fundamental mode ACs (ACEP 1O and ACEP F, respectively) in the MW with their uncertainties (dashed lines), and in the upper right panels the corresponding relations for Galactic CCs (CEP 1O and CEP F, respectively). The lower panels of Fig. 9 show the zoomed-in view (between 0.0 and −2.7 in
  ) of the PW relations in the upper panels. The magenta and yellow filled circles mark sources within and beyond 12rh , respectively. A grey-shaded area in the upper panels highlights the 29 brightest sources among the 43 variable stars significantly above the HB. With W(G, GBP − GRP) values brighter than −2.5 mag, these variable stars in the grey-shaded area appear to be much more luminous than the Wesenheit index of ACs and CCs at the distance of UMi, hence it is unlikely that they belong to the galaxy. This conclusion is further supported by their positions on the proper motion diagram in Fig. 10: they are distributed all over the area going from the nearest star (source_id 1643960889310752128 with pm_ra= −1.460 and pm_dec = −0.887 mas/yr) to the furthest star, outside the diagram (source_id 1646045808171028352 with pm_ra=-7.866pm_dec = −2.051 mas/yr).
The 14 bright variable sources below the grey-shaded area in large majority lie close to, or, in the best cases, well follow within the errors the  relations for ACs of Ripepi et al. (2023), as shown in the lower left panel of Fig. 9. We classify most of them as confirmed or candidate ACs belonging to UMi, a classification also confirmed from their position on the proper motion diagram in Figure 10, and the location on the spatial distribution map and the CMD shown in the right panels of Figure 11.
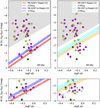 |
Fig. 9 Upper panels: |


4.2 Confirmed and candidate ACs
We comment on confirmed or candidate ACs individually here below. The first 5 sources are variable stars already studied by N88. We assigned to the remaining nine sources not in N88’s list identifiers in the form of alphabetic capital letters and V-numbers continuing N88 nomenclature of increasing number with increasing the distance from UMi centre.
V1: N88 classified this star as AC with P = 0.470 days. The source is listed as RRab star with period P = 0.878 days in the Gaia DR3 vari_rrlyrae table. This coincides with an alias period found by N88 for the star. The G band light curve of V1 (see Figure 11), is well sampled and nicely folded by the period published in the vari_rrlyrae table, that we believe is the correct period for the star. V1 is plotted in Figure 9 according to the period published in the vаri_rrlyrаe table and found to fall on the
 for fundamental mode ACs. We therefore confirm the classification of V1 as ACEP F.
V6: the source is classified as RRab star with P = 0.726 days in the Gaia DR3 vari_rrlyrae table. N88 found the same period for V6, but classified the star AC because it is too bright to be an RR Lyrae belonging to UMi. The mean G magnitude of V6 is almost 1.6 mag brighter than the mean luminosity of UMi RR Lyrae stars in the Gold sample. The star falls on the
 for first overtone ACs. Hence, also for V6 we confirm the classification as AC (ACEP 1O).
V11: N88 classified this star as AC, whereas the star is included in the vari_rrlyrae table of Gaia DR3 with a pulsation period that differs by 0.02 days from that published in N88. Based on the position close to the
 for fundamental mode ACs we confirm the classification as AC of V11.
V59: the source is classified RRab star in the DR3 vari_rrlyrae table with period in perfect agreement with that found by N88 who however classified the star AC. Based on the star location close to the
 for first overtone ACs we confirm N88 classification of V59 as AC of UMi.
V62: as for the 4 variable stars discussed above, V62 is included in the vari_rrlyrae table of Gaia DR3 with period differing by only 0.03 days from N88’s one, who, however, classified the source as AC. V62 lies close to the
 for fundamental mode ACs hence we confirm its classification as AC (ACEP F).
(A) V105: Gaia G, GBP and GRP light curves for the star (Fig. 11) are well sampled and nicely folded by the period published in the DR3 vari_rrlyrae table. The star position right on the
 for fundamental mode ACs (bottom left panel of Fig. 9), the proper motions (bottom panel of Fig. 10), as well as the position on the spatial distribution map and CMD (right panels of Figure 11), allow us to conclude that A could be a new AC belonging to UMi.
(H) V110: as for A, all properties of H lead us to classify the star as a new AC of UMi.
(B) V143: this source is located within 11 rh from UMi centre (δRA = −1.04°, δDec = 1.31°). Similarly to A and H, based on the star position near the
 relation for first overtone ACs and the star location on the proper motion diagram, also B could be a new AC member of UMi.
(D) V152: this source is classified as RR Lyrae by Gaia DR3 and other surveys, (Pan-STARRS, PS1; Sesar et al. 2017 and Zwicky Transient Facility, ZTF; Bellm et al. 2019), that also find for the star the same period published in the Gaia DR3 vari_rrlyrae table. Although the star is located well beyond 12 rh from UMi’s centre (δRA = −0.43°, δDec = 2.81°), the proper motions and the position near the
 relation for fundamental mode ACs leave the possibility open that this source may be an AC of UMi, one of the furthest we have identified.
(C) V162: as D, star C is classified RR Lyrae in Gaia DR3 as well as also in the PS1 and ZTF surveys. However, the luminosity more than 1 mag brighter than UMi’s HB rules out that it could be an RR Lyrae belonging to the galaxy. The star is also too bright to be an ACs being ~0.5 mag above 3σ from the
 relation for first overtone ACs in UMi, while it could be a fundamental mode CC in the galaxy, but this seems a rather unlikely possibility, given the very old and metal-poor population of UMi. Star C is placed within 12 elliptical half-light radii from the galaxy centre, but its proper motions are barely consistent with those of the other RR Lyrae stars in the galaxy. We think that classification as a field RR Lyrae is the most plausible for this star.
(E) V174, (F) V166 and (G) V175: these stars are among the 20 variable sources found beyond 12 times the UMi’s rh (Fig. 1). They are significantly brighter (from 1.4 mag for E to over 2 mag for G) than the mean G magnitude of the Gold sample RR Lyrae stars tracing the galaxy HB, as shown in Fig. 2. Their positions on the
 relations exclude them from being ACs of UMi. Their proper motions also show poor consistency with the proper motions of UMi’s Gold sample RR Lyrae and other member stars (Fig. 10). E and F are also classified as field RR Lyrae stars, with the same pulsation period as published in the DR3 vari_rrlyrae table, by ZTF, PS1 and the CATALINA (Drake et al. 2014) surveys. We thus conclude that these three variable stars do not belong to UMi.
I V178: like E, F and G this source is located beyond 12 rh and its proper motions are poorly consistent with those of the Gold sample RR Lyrae stars. The source light curves, folded according to the period in the DR3 vari_rrlyrae table, P = 0.7292 days, are rather noisy in all bands. We re-analysed the star time series data finding a slightly shorter period (P = 0.6869 days, logP = −1.631) and a revised Wesenheit magnitude (
 mag) that place the source closer to the
  relations of UMi’s ACs. Therefore, we do not rule out that star I could be an AC candidate in UMi.
Among variables classified by N88 as ACs, two stars, V56 and V80, are contained in the Gaia DR3 main catalogue but not in the tables of Cepheids or RR Lyrae stars. We attempted to clarify the nature of these variable sources adopting the periods in N88 (their table VII) and the mean magnitudes and astrometric information available in the DR3 main catalogue. The upper right panel of Fig. 11 shows that V56 and V80 are quite close to the centre of UMi. V80 proper motion components (upper panel of Fig. 10) are also consistent with those of the Gold sample RR Lyrae stars and the bulk of UMi’s members. On the other hand, the proper motions of V56 have rather large errors ( mas/yr and
  mas/yr) and the high RUWE7 of the astrometric solution for this star signals that they are unreliable. Thus, we cannot use them to confirm or rule out that V56 is a member of UMi. The location of V80 and V56 on the
  relations in Fig. 9, adopting the periods of N88, shows that they are not ACs belonging to UMi, but G magnitude and colour of V56 (see bottom right panel of Fig. 11) are consistent with the star being an RR Lyrae of the galaxy (see discussion in Sect. 5). Kholopov (1971) claims V80 to be a binary star, but N88 ruled out this hypothesis based on their data. The star is included in the vari_classifier table of Gaia DR3 and classified as variable AGN. We have analysed the Gaia light curves of V80 finding luminosity variations smaller than 0.2 mag in all the three bands and a light variation in the G band compatible with a very long period (P≳ 900 days). On the basis of the above evidences we have not included V56 and V80 in the list of UMi’s ACs.
To summarise, we finally classify as new ACs belonging to UMi stars: A, H, B and D, while classify star I AC candidate. Adding these sources to the five already known ACs that we have confirmed (V1, V6, V11, V59, V62) brings the total number of UMi ACs in our study to 9+1. Main characteristics for these 10 ACs are summarised in Table 2. Their G-band light curves are shown in the left and cetral panels of Figure 11.
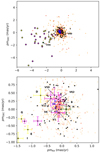 |
Fig. 10 Upper panel: proper motion diagram of UMi’s Gold RR Lyrae stars (black filled circles) and 43 variable stars significantly brighter than UMi’s HB, that are placed within (magenta filled circles) and beyond (yellow filled circles) 12 rh from the centre of the galaxy. Lower panel: zoomed-in view of the upper panel. The labelled sources are discussed in Section 4. The green filled circles mark V56 and V80, for which we do not confirm N88’s classification as ACs. |
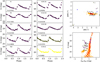 |
Fig. 11 Left and central panels: Gaia DR3 G-band light curves of ACs in UMi. Five of them were already known from N88, which we have confirmed. Four new ACs plus one AC candidate have been identified during this work. The variable stars are ordered by increasing number according to N88’s and our identifications. The magenta and yellow filled phase points mark stars within and beyond 12 times the galaxy half-light radius, respectively. The pulsation periods adopted to fold the light curves are from Gaia DR3 vari_rrlyrae table, except for (I) V178 whose light curve is folded with the period derived in our analysis of the time series data (see details in the text). Right panels: spatial distribution (top) and position on the CMD (bottom) of the 10 ACs (nine confirmed plus one candidate) with respect to the UMi members. The green filled circles mark V80 and V56, for which we do not confirm the N88 classification as ACs. |
ACs belonging to UMi that were confirmed or identified in this study.
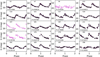 |
Fig. 12 G-band light curves for 20 RR Lyrae stars identified in UMi by N88, that are not included in the Gold sample. The sources are ordered according to the identifiers by N88 increasing from left to right and phased according to the periods listed in Cols 5 (light curves with magenta filled circles) and 7 (light curves with orchid open circles; V9, V47, and V72) of Table A.2, respectively (see discussion in Sect. 5). |
5 RR Lyrae stars in UMi: New members and known members with revised properties
As described in Section 3, 82 of the 168 variable sources identified within a radius of 3.5 degrees from UMi centre (Fig. 1) have a counterpart in the catalogue of N88. Excluding the 57 RR Lyrae in the Gold sample and the 43 bright sources discussed in Sect. 4 (that include 5 ACs from N88 incorrectly classified RR Lyrae stars in the DR3 vari_rrlyrae table), there are another 20 RR Lyrae stars identified in UMi by N88 to discuss (Section 5.1) as well as 48 variable sources classified as RR Lyrae stars in Gaia DR3 that are new potential members of UMi that we discuss in Section 5.2.
The Gaia DR3 main catalogue also contains 10 variables identified in UMi by N88, including 4 RR Lyrae stars (see Section 3.1), in addition to the 82 cross-identified ones, that are neither included in the Gaia DR3 vari_rrlyrae table nor listed as RR Lyrae stars (‘RR’) in the vari_classifier_result table, we discuss these sources in Section 5.3.
5.1 Known RR Lyrae members of UMi with revised properties
Starting from the 20 sources already classified as RR Lyrae stars of UMi by N88 we find that 18 of them are also classified as RR Lyrae in the DR3 vari_rrlyrae table, but with slightly different pulsation periods for 17 of them: |PGaia − PN88 |>0.003 days, while other 2, V9 and V47, are classified ‘RR’ in the vari_classifier_result table. Identifier, period and type of these 20 RR Lyrae stars from both N88 and the vari_rrlyrae table, or from our analysis of the DR3 light curves, are provided in Table A.2. The G-band light curves of these sources folded according to the Gaia DR3 periods available in the vari_rrlyrae table for 17 of them, and the periods derived from our analysis of the Gaia times series data with the GRATIS software for V9, V47 and V72 are presented in Fig. 12. This figure shows that periods derived from the Gaia DR3 data are accurate and phase very well the observations, allowing us to confirm that these stars are RR Lyrae as they all have periods shorter than 1.0 day and the characteristic shape of the RR Lyrae light curves in the optical band. N88 did not publish a period for V76, but the period and type published in the vari_rrlyrae table (see columns 5 and 6 of Table A.2), as well as the star mean magnitudes confirm that V76 is an RR Lyrae of UMi. For comparison, light curves folded with periods from N88 are presented in Fig. B.3. The Gaia DR3 data of 17 of the RR Lyrae stars listed in Table A.2 are not well folded by N88 periods, and for five of them (V16, V27, V72, V92 and V97) we do not even confirm the classification in type of N88. Conversely, we confirm N88 period and classification of V47, and find for V9 a rather long first overtone period, P = 0.455560 days, very much close to P = 0.455 days from N88. However, the light curves of V9 folded with the first overtone period are too noisy suggesting that the star could be a double mode RR Lyrae (RRd). The GBP and GRP light curves of V47 and V9 folded with the periods computed in this work are shown in Fig. B.4.
Having verified that the periods derived from the Gaia DR3 data of these 20 RR Lyrae stars are well constrained, we can use them along with the intensity-averaged G, GBP and GRP magnitudes published in the vari_rrlyrae table to plot the sources on the  relation for RR Lyrae stars of Garofalo et al. (2022) scaled to the distance modulus of UMi ((m-M)0 = 19.23 mag; see Sect. 3.4), shown by the green solid line in Fig. 13 along with its ±3σ deviation. We have fundamentalised the RRc stars by adding 0.127 to the logarithm of their periods. V9 and V47 are marked by violet filled circles, and plotted adopting the periods and mean magnitudes derived in our analysis. N88 suggest V72 to be a candidate double-mode RR Lyrae (RRd) even though they found a rather short first overtone period (P = 0.2035 days) for the star. V72 is classified as RRab star in the DR3 vari_rrlyrae table with a much longer period (P = 0.59755 days; see Table A.2). The SOS Cep& RRL pipeline did not search V72 for a second period because the star has only 39 phase points and the search for a second periodicity is activated only for stars with 40 or more epoch data (Clementini et al. 2023). We searched for a second periodicity the Gaia DR3 time series data of V72, but only found a period 0.00009 days shorter (P = 0.59746 days), widely confirming the period and classification as RRab star published in the DR3 vari_rrlyrae table. However, the G-band light curve of V72 is rather noisy (see Fig. 12) with residuals from the best-fit model around 0.1 mag. The scatter could be caused by Blazhko effect, but this hypothesis is difficult to confirm with the limited number of data available for the star.
The position of the 20 sources on the  plane (Fig. 13) as well as their location on the HB in the CMD (left panel of Fig. 14) indicates that they all are RR Lyrae members of the UMi dSph. This is further confirmed by the location of these 20 RR Lyrae stars within the area enclosed by three times the galaxy half light radius (bottom right panel of Fig. 14) and by their proper motion components being consistent with those of the RGB members of UMi and the RR Lyrae stars in the Gold sample (top right panel of Fig. 14).
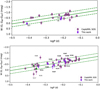 |
Fig. 13 Top panel: position of the 20 sources in Table A.2 on the |

5.2 New RR Lyrae members of UMi
We discuss here 48 sources in our initial dataset of 168 variable stars, which are classified as RR Lyrae stars in Gaia DR3 and are new potential members of UMi.
We start by rejecting V169 as an RR Lyrae member of UMi, because (i) its proper motions (pm_ra = −9.793 ± 1.375, pm_dec = −2.619 ± 1.365 mas yr−1) are not compatible with those of the dSph, and (ii) its mean G magnitude in both the vari_rrlyrae table and the main catalogue of Gaia DR3 is ∼1.2 mag fainter than the typical mean magnitude of RR Lyrae stars belonging to UMi and along with the rather red (GBP–GRP) colour place V169 in the faintest and reddest part of the CMD (Fig. 2). Identification and properties of the remaining 47 stars are provided in Table A.3. V156 and V134 are not included in the vari_rrlyrae table but are listed as ‘RR’ in the vari_classifier table. We analysed their time series data with the GRATIS package obtaining the periods and intensity-averaged G magnitudes that we provide in Table A.3, and the intensity-averaged GBP , GRP magnitudes that we label in Fig. B.5.
From our analysis, we find that V134 is an RRab star with pulsation period P = 0.691416 days. We find for V156 a period P = 0.5196468 days, which also indicates that V156 can be an RRab star. However, the surprisingly small amplitude in the G band, AmpG = 0.157 mag, makes this classification less certain. Hence, we classify the star as candidate RRab star.
For eight stars in Table A.3, (V107, V109, V114, V121, V127, V130 V150 and V157), we found the G light curves to look noisy as if they were not perfectly folded with the periods in the DR3 vari_rrlyrae table. Also for them we analysed the G time series and confirmed the classification in type of V121 (RRc), V150 (RRab) and V107 (RRab) with a very minor revision of the periods in the vari_rrlyrae table. For the latter (V107) we also suggest it is blended with a companion causing the smaller amplitude than expected for the star period. In addition, we concluded that V130 and V114 could be affected by Blazhko effect, while we reclassified V109, V127 and V157 as double-mode pulsators (RRd). They have fewer than 40 epochs in G, and hence the SOS Cep&RRL pipeline did not search the data of these three sources for a second periodicity, which we found in our analysis of the time series data, and simply classified them as RRc stars. The periods in the vari_rrlyrae table indeed correspond to the shorter periods as RRd stars. We list both primary and secondary periods of the 3 stars in Table A.3.
Figure 15 shows the G-band light curves of the new variable stars plotted with filled circles when the data are phased with the periods published in the vari_rrlyrae table (37 sources), and with empty circles if the data are folded with periods derived from our analysis of time series (10 sources).
In order to validate the classification as RR Lyrae of the new variable stars and test their membership to UMi, in the bottom panel of Fig. 13 we plot them on the  relation for RR Lyrae stars of Garofalo et al. (2022) scaled to the distance modulus of UMi [(m-M)0 = 19.23 mag]. In the figure orchid filled circles mark 37 sources with periods and G, GBP and GRP mean magnitudes from the vari_rrlyrae table, whereas violet filled circles mark 10 sources (labelled in the figure) all having periods and mean G magnitudes from our analysis of the G-band time series data, and GBP, GRP mean magnitudes from our analysis for V134 and V156; and from the vari_rrlyrae table for the other 8 stars. All sources in the bottom panel of Fig. 13, except V117, V125 and V103, are compatible with the
  relation of RR Lyrae stars (green solid line with its ±3σ deviation) thus confirming that they are RR Lyrae members of UMi. We reach the same conclusion from the CMD in the right panel of Fig. 14 showing that all RR Lyrae in this sample lie on or near to, UMi HB, and from the top right panel of Fig. 14 showing that they all also have proper motions well consistent with those of UMi spectroscopically confirmed members. The spatial distribution of this sample (bottom right panel) further supports the hypothesis that these RR Lyrae stars belong to UMi since most of them are located within the area enclosing the most peripheral boundary of the dSph determined so far (12 rh; black solid line). Only V155 and V156 lie outside this region. However, it is hard to believe that they are MW field stars which are on the HB of UMi and have proper motions that clearly indicate their belonging to the dSph. Furthermore, it is extremely difficult to find MW RR Lyrae field stars at such great distances from the centre of our Galaxy. Since their population decreases with the Galactocentric radius, they are infact quite rare at distances greater than ~50 kpc, as shown by a number of studies in the literature (Vivas & Zinn 2006; Medina et al. 2018; Garofalo et al. 2021).
On the other hand, V117, V125 and V103 are outside ±3σ from the PWZ relation of RR Lyrae stars, V125 significantly below and V103 being significantly above the green dashed lines in the bottom panel of Fig. 13. V117 and V125 also have bluer colours (GBP − GRP ~ 0) than other RR Lyrae stars on the CMD in the right panel of Fig. 14. We found that, like V43, V60 and V63 in the Gold sample, V117 and V125 have very poor GBP light curves, resulting in poorly constrained best-fit models that produce too bright intensity-averaged GBP magnitudes for the stars. In fact the intensity-averaged GBP magnitudes of V117 and V125 in the vari_rrlyrae table are much brighter than < GBP > values for the stars in the Gaia DR3 main catalogue8. V117 and V125 nicely fall near the PWZ and well within the bulk of the RR Lyrae stars on the CMD when we adopt the < GBP > values in the Gaia DR3 main catalogue (lime triangles in the bottom panel of Fig. 13 and in the right panel of Fig. 14), thus confirming that they are RR Lyrae belonging to UMi. The position of V103 and V120 on the HB of UMi (right panel of Figure 14) makes them the brightest RR Lyrae stars in the sample being about 0.3 mag more luminous than the mean G magnitude of the Gold RR Lyrae dataset. Their G mean magnitudes are based on well-sampled light curves as shown in Fig. 15. We thus suggest that V103 and V120 are likely RR Lyrae stars evolved from the ZAHB, as star V73, discussed in Section 4.
To summarise, we have found that 47 of the sources discussed in this section are RR Lyrae stars (46 confirmed and 1 candidate − V156) belonging to the UMi dSph. This sample contains: 29 RRab stars (28 confirmed and one candidate), 15 RRc and 3 RRd stars. Among them 37 are known RR Lyrae first identified by the ZTF survey, 6 were discovered by Gaia DR2 (V112, V118, V135, V140, V155 and V157) and 3 were first identified by Gaia DR3 (V103, V122 and V139).
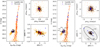 |
Fig. 14 Left panels: position of the 20 known RR Lyrae stars listed in Table A.2 on the G vs GBP−GRP CMD of UMi’s RGB members (cyan, orange, and red symbols) and the Gold sample RR Lyrae stars (black filled circles). The mean magnitudes and colours of the 20 RR Lyrae stars are from the DR3 vari_rrlyrae table (orchid filled circles) and from our analysis of the Gaia time series data for V9 and V47 (violet filled circles); Spatial location (bottom) and proper motion distribution (top) of the 20 RR Lyrae stars (orchid filled circles) using the Gaia DR3 astrometry. Right panels: same as in the left panels, but for the 47 RR Lyrae stars that we confirm to be new members of UMi (see Sect. 5.2). V103, V117, V120, V125, and V156 are discussed in the text. The lime filled triangles show V117 and V125 plotted adopting their GBP and GRP magnitudes from the Gaia DR3 main catalogue. |
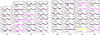 |
Fig. 15 G-band light curves of the 47 RR Lyrae stars listed in Table A.3, all of which belong to UMi. The magenta filled circles are used to display the light curves folded according to the periods provided in the Gaia DR3 vari_rrlyrae table; the magenta open circles are used instead for the light curves of the sources whose periods were re-determined from our analysis of the time series data. V155 and V156 are located beyond 12 rh; their light curves are displayed with yellow filled and yellow open circles, respectively. |
5.3 Known variable stars of UMi without or with a different classification in Gaia DR3
We list in Table A.4 other 10 variable stars identified in UMi by N88 that are neither included in the Gaia DR3 vari_rrlyrae table nor listed as RR Lyrae stars (‘RR’) in the vari_classifier_result table.
Astrometry and mean magnitudes are available for these sources in the Gaia DR3 general catalogue but no pulsation characteristics. Among them are:
V56 and V80, for which we do not confirm N88’s classification as ACs (see Sect. 4);
4 RRc stars according to N88: V12, V57, V84 and V95;
4 sources classified as variable stars by Kholopov (1971) and van Agt (1967), but not confirmed to vary (V14, V88 and V94), or to be RR Lyrae stars (V74) by N889.
The spatial distribution in the top right panel of Fig. 16, and the distribution in proper motions (bottom right panel) show that eight of these sources are unequivocally members of UMi. By adopting the periods from N88 we show that a classification as RRc stars belonging to UMi for V12, V57, V84 and V95 is plausible using the Gaia magnitudes, as they well-fit the RR Lyrae  relation fixed at UMi’s distance (top left panel of Fig. 16) and lie on the HB of UMi CMD (bottom left panel).
V57 is classified eclipsing binary (ECL) in the vari_classifier_result table. We have analysed its G, GBP and GRP DR3 time series data confirming the classification as RRc star but deriving a shorter period (P = 0.28932 days) than found by N88 (P = 0.405 days, Table A.4). The star is plotted using our revised period in Fig. 16.
N88 derived two, equally probable periods for V95 (P = 0.305/0.439 days; see Table A.4), both of which disagree with Kholopov (1971) period for this star (P = 0.234 days). V95 is plotted in the upper left panel of Fig. 12 according to N88’s shorter period, since it best places the star on the  relationship.
As discussed in Section 4, classification as RRab star of V56, adopting the Gaia DR3 magnitudes and the period in N88 (0.612 days), seems to be more likely, since the star better fits the  relation of UMi RR Lyrae stars (upper left panel of Fig. 16) than the
  for UMi Cepheids (bottom panels of Fig. 9).
In addition, according to the position on the CMD (bottom left panel of Fig. 16), V74 and V14 cannot be RR Lyrae stars, confirming N88 results.
Conversely, V88 and V94 being located on the HB could be RR Lyrae stars. But since we do not have period information from the literature or Gaia time series data for these stars we only classify them as potential RR Lyrae.
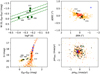 |
Fig. 16 Top left panel: positions of V12, V57, V84 and V95 on the Gaia DR3 |

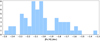 |
Fig. 17 Distribution of the photometric metallicities from Muraveva et al. (2024) for 62 RR Lyrae stars that we confirm to belong to UMi. |
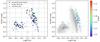 |
Fig. 18 Bailey diagrams of the RR Lyrae stars belonging to UMi. Left panel: the black filled circles mark the Gold sample RR Lyrae; the known and new RR Lyrae members of UMi confirmed in this work are plotted with teal and blue filled circles, respectively. A total of 125 sources are shown in the figure. Right panel: same as in the left panel, but with 62 UMi RR Lyrae stars with photometric metallicities from Muraveva et al. (2024) marked by filled circles colour-coded according to their metallicity, and UMi RR Lyrae members lacking a metallicity value shown by empty circles. Grey points in the background show the all-sky RR Lyrae sample published in the Gaia DR3 vari_rrlyrae table (~270 000 sources). |
6 Variables in UMi: Final sample and properties
With our analysis, we bring the total number of confirmed and candidate variable stars hosted by the UMi dSph galaxy to 139 (this number includes V12, V56 V57, V84, and V95 from Table A.4). In particular, we found 129 RR Lyrae stars, of which 47 (1 candidate and 46 confirmed RR Lyrae) are new members of UMi, and 10 ACs, of which 5 (1 candidate and 4 confirmed ACs) are also new members of the galaxy. This has allowed us to have a more complete picture of the pulsation properties of the variable star population in UMi.
We adopt for our updated list of RR Lyrae stars belonging to UMi, the photometric metallicities recently published by Muraveva et al. (2024). These authors published individual [Fe/H] values for ~134 000 RR Lyrae stars based on new P-ф31- [Fe/H] (for RRab) and P-ф31-A2- [Fe/H] (for RRc) relationships that they determined directly from the parameters (period, ф31 and A2 10) of the G-band light curves published in the Gaia DR3 vari_rrlyrae table, for RR Lyrae stars with accurate metal abundances from spectroscopy. Metallicity measurements from Muraveva et al. (2024) are available for 64 RR Lyrae stars belonging to UMi, corresponding to about 50% of the sample. They are reported in column 10 of Table A.1 and column 9 of Table A.3. The mean uncertainty of the individual metallicity estimates is around 0.48 dex, obtained by combining the dispersion of Muraveva et al. (2024) relations (0.28 and 0.21 dex for RRab and RRc stars, respectively) and the uncertainty in the period and Fourier parameter (ф31 and A2) of each source.
The metallicity distribution is shown in Fig. 17 and is based on 62 RR Lyrae stars. We dropped V107 and V130, whose ф31 and A2 parameters, hence metallicity estimates, may be unreliable, since V107 is suspected to be blended with a companion, and V130 is suspected to be affected by Blazhko.
Metallicities range from [Fe/H] = −1.30 dex (for V45) to −2.47 dex for (V150) and peak at [Fe/H] ~ − 2.0/−2.1 dex, in excellent agreement with the mean metallicity of UMi determined spectroscopically by Kirby et al. (2011); Pace et al. (2020) using different datasets and instruments. Although the metallicity information is only available for 50% of the RR Lyrae sample, this subsample seems to be rather representative of the entire RR Lyrae population in UMi. Kirby et al. (2011) and Pace et al. (2020) find a metallicity spread around 0.30 dex in UMi. The standard deviation associated with the mean metallicity of our subsample, 0.25 dex, is fairly consistent with that value. However, this standard deviation might not necessarily reflect intrinsic properties of our RR Lyrae subsample but rather simply result from the dispersion of Muraveva et al. (2024) relations and uncertainty of the period and Fourier parameters, which dominate owing to the reduced reliability of the pulsation parameters for stars at this faint magnitude level (G ~ 19.5−20).
The left panel of Fig. 18 shows the Bailey diagram of our final sample of RR Lyrae stars belonging to UMi. A total of 125 RR Lyrae stars are plotted in this figure, since we do not have and could not calculate the G amplitude for all stars listed in Table A.4, except for V57. Gold sample, known, and new RR Lyrae members of UMi are plotted with black, royal blue, and cyan filled circles, respectively. The dubious RR Lyrae star V156 is plotted in lighter blue. In the right panel of Fig. 18, we compare the G amplitudes and periods of UMi RR Lyrae stars with the Bailey diagram of the approximately 270 thousand RR Lyrae stars published in the Gaia DR3 vari_rrlyrae table (Clementini et al. 2023). Almost all UMi’s RRab stars are placed on the Oosterhoff II (Oo II) line, the locus of RR Lyrae stars with periods ~0.65 days and a low metal content ([Fe/H]~−2.0 dex). UMi RR Lyrae stars with photometric metal- licity estimates by Muraveva et al. (2024) are marked with filled circles colour-coded according to their metallicity and confirm the predominantly metal-poor content of the RR Lyrae population in this MW satellite. A few, more metal-rich RR Lyrae stars can be seen near the Oosterhoff I (Oo I) locus. With future Gaia data releases, a more complete picture of the metallicity spread in this dSph galaxy will certainly be possible.
In Sect. 3, we derived < Pab > = 0.637 ±0.062 days (average on 38 stars) and < Pc+d >= 0.3560 ± 0.038 days (average on 19 stars), and a classification as Oo II system for UMi, from the 57 RR Lyrae in the Gold sample. We can now revisit these numbers with all data at our disposal. We have periods for 125 (124 confirmed and 1 candidate) RR Lyrae members of UMi, 80 RRab and 45 RRc+d. Excluding the RRab candidate (V156) we obtain: < Pab > = 0.652 ± 0.063 days (average on 79 stars) and < Pc+d > = 0.369 ±0.042d (average on 45 stars; for V95, we adopted the period that fits the PWZ relation, P = 0.305 days, see Table A.4); excluding the RRc stars in Table A.4, the average does not change: < Pc+d > = 0.368 ± 0.043. These numbers confirm that UMi is an Oo II system. The fraction of RRc+d stars: 35% (or 34%, if we exclude 2 suspected RRd stars in the Gold sample, V49 and V81, see Sect. 3) is also closer to the typical fraction of RRc stars in Oo II systems.
Finally, Figure 19 shows UMi’s CMD in the Gaia DR3 bands, built with the spectroscopically-confirmed RGB and HB member stars from Sestito et al. (2023); Pace et al. (2020); Kirby et al. (2010) and over-plotted our final catalogue of ACs and RR Lyrae stars belonging to the galaxy. We overlaid the CMD by stellar isochrones of different age and chemical compositions from the PARSEC database (Bressan et al. 2012), to fit UMi’s stellar populations. Isochrones were corrected by adopting the distance modulus of UMi we derived from the RR Lyrae stars [(m − M)0 = 19.23 mag, Sect. 3.4] and the reddening E(GBP − GRP) = 0.043 mag, from the AV value converted into AGBP and AGRP, using relations from Bono et al. (2019). We selected isochrones with old age t = 13 Gyr and a combination of low metal abundances [Z = 0.0001, Z = 0.0002, and Z = 0.0003 ([Fe/H] =~ −1.7 dex)] to fit the predominantly old stellar population and the large number of UMi RR Lyrae stars. We found the isochrones that best reproduce both UMi extended HB and the RGB stars to be those with age t = 13 Gyr and metallicity Z = 0.0001 ([Fe/H] = ~−2.2) and Z = 0.0002 ([Fe/H] = ~−2.0) (see left panels of Fig. 19).
Our final catalogue of UMi variable stars lists 10 ACs (9 confirmed and 1 candidate). There are at least two accepted scenarios for the formation of ACs. The first scenario considers ACs to be intermediate age, metal-poor single stars produced by a 1–2 Gyr old star formation burst; the second scenario suggests that ACs are supposed to form via mass transfer in binary systems as old as the other stars in the host galaxy. We overplotted on the galaxy CMD isochrones of intermediate age (t = 1 Gyr) and low metal abundance (Z = 0.0001, Z = 0.0002, and Z = 0.0003) and found that 1 Gyr old isochrones can reproduce the location of UMi ACs reasonably well (right panels of Fig. 19). However, so far no indisputable evidence of an intermediateage population or presence of gas has been found in the UMi dSph. Carrera et al. (2002) studied UMi star formation history based on a CMD reaching 1.5 magnitudes below the main sequence (MS) turn-off (TO). They showed that UMi hosts a predominantly old stellar population formed more than 10 Gyr ago, and conclude that the blue plume extending about 2 magnitudes above the TO (see their Fig. 4) to be most likely formed by blue stragglers originating in close binary stars rather than an intermediate-age population. UMi is the only MW dSph satellite with a pure old stellar population, so far. In this framework, it seems more plausible that UMi ACs formed via mass transfer in close binaries.
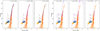 |
Fig. 19 CMD of UMi’s member stars from Sestito et al. (2023), Pace et al. (2020) and Kirby et al. (2010) (blue, orange, and red symbols, respectively), overlaid by Padua stellar isochrones (Bressan et al. 2012) for different combinations of age and metallicity. Left panels: stellar isochrones with metal abundance: Z = 0.0001, Z = 0.0002, and Z = 0.0003, and age t = 13 Gyr. Right panels: stellar isochrones with metal abundance: Z = 0.0001, Z = 0.0002, and Z = 0.0003, and age t = 1 Gyr. The filled symbols in different colours distinguish the various RR Lyrae subsamples: gold (black); known (cyan); new members (navy); and known, but not classified by Gaia DR3 as RR Lyrae stars (green). The magenta and yellow filled circles are known and new ACs belonging to UMi located within and beyond 12 rh. |
7 Muñoz 1 with Gaia DR3 data: Investigating its presence
Based on deep photometry obtained with MegaCam at CFHT, Muñoz et al. (2012) detected the second ultra-faint star cluster ever identified in the vicinity of a MW dSph, Muñoz 1. They found Muñoz 1 to be located at a distance of 45 ± 5 kpc and at a projected distance of 45′ from the centre of UMi, with which it does not seem to be associated, being separated by ~30 kpc in distance. The best-fit isochrone, from the Dartmouth database (Dotter et al. 2008) overplotted on the CMD suggested that Muñoz 1 hosts an ancient stellar population (t = 12.5 Gyr) with [Fe/H] = −1.5 dex. More recently, using Gaia EDR3 astrometry Vasiliev & Baumgardt (2021) published proper motions for 170 clusters including Muñoz 1 for which they give: < pmra >= −0.100 ± 0.203 < pmdec >= −0.020 ± 0.207 based on 5 member stars. These values are almost identical to those of the UMi dSph, as shown by the right panel of Fig. 6. We tried to find out if any RR Lyrae star in our final catalogue, which covers up to UMi’s extended halo redefined by Sestito et al. (2023), could belong to Muñoz 1.
Since Muñoz et al. (2012) do not provide coordinates of Muñoz 1 member stars we were unable to counter-identify them in the DR3 catalogue. However, adopting for the cluster the distance d = 45 or 40 kpc (corresponding to distance moduli in the Gaia G band of 18.266 or 18.010 mag, respectively) and the metallicity [Fe/H] = −1.5 dex from Muñoz et al. (2012), we estimate the mean magnitude of any potential RR Lyrae stars on the cluster HB to be G ~ 18.90 (or G ~ 18.64 mag). There are 9 RR Lyrae stars in our final catalogue within an area of 0.4 deg in radius from Muñoz 1 centre (lime cross in Figure 1): V140, V141, V132, V129, V134, V136, V137, V76 and V128. Their < G > mean magnitudes are ~0.7 (or ~1) mag fainter than Muñoz 1’s HB, while being perfectly consistent with the mean magnitude of UMi’s HB. Hence, there are no RR Lyrae stars in our catalogue that seem to belong to the cluster. We then checked whether any of the ACs or bright variable stars with G< 19.25 discussed in Sect. 4 could be RR Lyrae stars belonging to Muñoz 1. In Fig. 20 we show the CMD of UMi member stars (RGB, HB and RR Lyrae) using the same symbols and colourcoding as in Fig. 19 and highlighting with pink circles 43 bright variable sources with G< 19.25 mag.
We over-plotted on the CMD, stellar isochrones from the PARSEC dataset with fixed age t = 13 Gyr and three different metal abundances, Z = 0.0005 ([Fe/H] = ~ − 1.5 dex), Z = 0.0004 and Z = 0.0003, to trace the ancient population of Muñoz 1. Isochrones were set to d = 45 kpc in the left panel, and at d = 40kpc in the right panel. In both panels of Fig. 20 none of the bright stars marked by pink empty circles is found to lie on the HB of the isochrones we overlaid on the CMD. Only star I (V178), a candidate AC, reaches near the blue end of the Z = 0.0003 isochrone, the most metal-poor one. However, I (V178) is too blue to be an RR Lyrae of a cluster with a metallicity of Z = 0.0003 and definitely much bluer than the isochrone that best corresponds to the metallicity of Muñoz 1, the one with Z = 0.0005. But more importantly, the star’s proper motions are not compatible with those of UMi, and therefore with those of Muñoz 1. If Muñoz 1 were at the shorter distance adopted in the right panel of Fig. 20 (d = 40 kpc), and were the cluster metallicity lower than estimated in the discovery paper ([Fe/H] = −1.5 dex), star A (V105) could perhaps be an RR Lyrae beloging to Muñoz 1. However, assuming for the cluster the metallicity and distance values provided by Muñoz et al. (2012), in our catalogue of 168 variable stars identified within a radius of 3.5 degrees from UMi centre we do not find RR Lyrae stars that can be reliably attributed to the Muñoz 1.
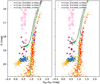 |
Fig. 20 CMD of UMi members (RGB, HB, and RR Lyrae stars) using the same symbols and colour-coding as in Fig. 19. Overlaid on the CMD are Padua stellar isochrones (Bressan et al. 2012) for a fixed age, t = 13 Gyr, and three different metal abundances (Z = 0.0003 grey, Z = 0.0004 purple, and Z = 0.0005 lime). Isochrones are fixed at a distance d = 45 kpc in the left panel and at d = 40 kpc in the right panel. The pink circles highlight 43 variable stars brighter than G =19.25 mag discussed in Sect. 4, among which are ten ACs of UMi. |
8 Discussion and conclusions
We analysed 168 variable stars classified as RR Lyrae stars in the Gaia DR3 vari_rrlyrae and vari_classifier_result tables, located within a 3.5 degree radius from the centre of the UMi dwarf spheroidal galaxy. In this study, we reclassified and characterised the known variable stars and identified new members of this Milky Way satellite.
Our analysis exploited the Gaia DR3 astrometry and photometry: (i) proper motions, (ii) Period-Wesenheit-Metallicity relations of RR Lyrae stars and Anomalous Cepheids (ACs), (iii) spatial distributions, and (iv) colour–magnitude diagrams with overlaid stellar isochrones. These tools allowed us to discriminate between RR Lyrae and ACs, and between members and non-members.
Here we summarise the steps and results of our analysis:
We built a reference sample, which we named Gold sample, that includes 57 known RR Lyrae members of UMi studied by N88 having a counterpart in the Gaia DR3 catalogue of RR Lyrae (vari_rrlyrae) and pulsation periods in agreement with the literature. From the Gold sample RR Lyrae and the MG−[Fe/H] relation published in Garofalo et al. (2022) we derived UMi’s distance modulus: (m-M)0 = 19.23 ±0.11 mag, which is in excellent agreement with previous estimates.
From our analysis, we confirm 129 sources to be RR Lyrae stars, 128 bona fide (of which 46 are new members of the galaxy) and 1 candidate (V156). We have periods for 125 of them: 80 RRab, 42 RRc and 3 RRd stars. The average period of RRab stars is < Pab > = 0.652 ± 0.063 days (average of 79 stars) and the average period of RRc+d stars is < Pc+d > = 0.369 ±0.042 days (average of 45 stars). These values qualify UMi as an Oosterhoff II system.
Additionally, we classify ten sources as Anomalous Cepheids belonging to UMi (4 new members plus 1 candidate, V178).
Six variable stars of the N88 catalogue do not have a counterpart in the Gaia DR3 vari_rrlyrae and vari_classifier_result catalogues. We included four of them, V12, V84, V95 and V57, among the 128 bona fide RR Lyrae stars of UMi. We confirmed them as RR Lyrae stars by adopting the periods from N88 and the mean magnitudes published in the Gaia DR3 main catalogue and checking their positions on the PWZ relation, on the CMD, and on the proper motions diagram. N88 do not provide period and classification for the remaining two variable sources, V88 and V94. For this reason, we have not included them among the confirmed RR Lyrae, even though their proper motions and Gaia mean magnitudes suggest that they may be RR Lyrae of UMi (see Section 5 and Figure 16).
These 129 RR Lyrae and 10 ACs are evenly distributed around the centre of UMi and extend beyond the elliptical boundary of 12 rh so far identified as the maximum spectroscopically confirmed extension of the galaxy (Sestito et al. 2023). Using the final sample of 128 bona fide RR Lyrae members, we determined UMi’s distance modulus as (m− M)0 = 19.23±0.11 mag, consistent with the distance modulus obtained from the Gold sample RR Lyrae stars, which are all placed within 5 rh from UMi’s centre.
Our updated census of RR Lyrae stars belonging to UMi could reflect the two populations that Pace et al. (2020) distinguished in terms of metallicity; however, since we have individual metallicities only for 50% of our RR Lyrae sample we cannot draw a solid conclusion. In Fig. 21 we show the spatial distribution of our final sample of RR Lyrae stars in UMi with sources colour-coded according to their individual distance moduli in the left panel, and according to their individual photometric metallicities in the right panel. Individual distances were obtained from the MG−[Fe/H] relation computed at a mean metallicity of [Fe/H] = −2.13 dex from Kirby et al. (2011); Pace et al. (2020). Individual photometric metallicities of the RR Lyrae stars were derived from the Muraveva et al. (2024) relations, and are available for about one-half the RR Lyrae stars in our catalogue. While no significant gradients or trends in distance are observed, we found a weak metallicity trend: metal-poor RR Lyrae stars [Fe/H]<−2.2 dex (purplish symbols) tend to lie further from UMi’s centre and have a lower ellipticity value, while less metal-poor stars are closer, with a higher value of ellipticity.
We explored the possibility that some RR Lyrae or ACs in the outskirts of UMi could be members of Muñoz 1, a faint cluster located at 40–45 kpc from us, with mean proper motions indistinguishable from those of UMi. Based on the distances and pulsation properties of our dataset of variables, together with CMDs and stellar isochrones properly selected so as to mimic the Muñoz 1 stellar population, we conclude that the metal content suggested for the cluster in the discovery paper (Muñoz et al. 2012) is too high for the cluster to host RR Lyrae stars with properties consistent with our dataset.
Our updated catalogue of variable stars in UMi reaches the most peripheral regions of the galaxy, and at the same time complements the sample of known variables in the galaxy inner regions, with increases by more than one-third the number of RR Lyrae stars known to be member of this dSph. This dataset represents a powerful tool for the study of the stellar populations in the outskirts of UMi and for reconstructing their origin trying to understand if they hide the signature of stellar streams and tidal stripping events from past interactions.
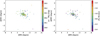 |
Fig. 21 Spatial distribution of 129 RR Lyrae in UMi (128 bona fide and 1 candidate) with sources colour-coded according to their individual distance moduli derived from the MG−[Fe/H] relation for fixed metallicity: [Fe/H] = −2.13 dex (left panel), and according to their individual photometric metallicity values from Muraveva et al. (2024) (right panel). |
Acknowledgements
We would like to thank the anonymous referee for its constructive comments, which have improved the clarity and quality of our manuscript. This work made use of data from the European Space Agency (ESA) mission Gaia (https://www.cosmos.esa.int/gaia), processed by the Gaia Data Processing and Analysis Consortium (DPAC; https://www. cosmos.esa.int/web/gaia/dpac/consortium). Funding for the DPAC has been provided by national institutions, in particular, the institutions participating in the Gaia Multilateral Agreement. Support to this study has been provided by INAF Mini-Grant (PI: Tatiana Muraveva), by the Agenzia Spaziale Italiana (ASI) through contract and ASI 2018-24-HH.0 and its Addendum 2018-24-HH.1-2022, and by Premiale 2015, MIning The Cosmos - Big Data and Innovative Italian Technology for Frontiers Astrophysics and Cosmology (MITiC; P.I.B.Garilli). This research was also supported by the International Space Science Institute (ISSI) in Bern, through ISSI International Team project 490, ‘SH0T: The Stellar Path to the H0 Tension in the Gaia, TESS, LSST, and JWST Era’ (PI: G. Clementini). This research also made use of TOPCAT (Taylor 2005) an interactive graphical viewer and editor for tabular data. This research has made use of numpy (van der Walt et al. 2011) and the Astropy library (Astropy Collaboration 2013, 2018). This research has used the VizieR tool. The original description of theVizieR service was published in Ochsenbein et al. (2000). Most of the figures in this paper were produced with Matplotlib (Hunter 2007).
Appendix A Tables of variable stars analysed in this work
Identification numbers and properties of the 57 RR Lyrae stars in the Gold sample.
Twenty RR Lyrae stars identified in UMi by N88 that are included in the Gaia DR3 vari_rrlyrae table or are classified as ‘RR’ in the DR3 vari_classifier_result table.
Known variable stars in UMi that are neither included in the Gaia DR3 vari_rrlyrae table nor classified as ‘RR’ in vari_classifier_result table.
Appendix B G, GBP and GRP light Curves
Here are collected the light curves folded with the periods that we derived in this work.
Figure B.1 shows the Gaia DR3 light curves of the RR Lyrae stars V43, V60, and V63 discussed in Section 3.4. The light curves of the candidate AC V178 (I) and the RRc star V57, discussed in Section 4, are shown in Figure B.2. The GBP and GRP light curves of the RR Lyrae stars V9 and V47, discussed in Section 5, are shown in Figure B.4 while those of RR Lyrae stars V134 and candidate V156 discussed in Section 5.2 are shown in Figure B.5.
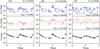 |
Fig. B.1 From top to bottom: Gaia DR3 GBP, GRP and G light curves for the Gold sample RR Lyrae stars V43, V60 and V63. All curves are folded with the periods obtained from our analysis. They are perfectly consistent with the periods published for these sources in the Gaia DR3 vari_rrlyrae table and in N88. |
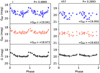 |
Fig. B.2 Gaia DR3 GBP and GRP light curves of the candidate AC V178 (I) and the RRc star V57. The periods adopted to fold the light curves are those redetermined in this work using Gaia DR3 time series (see Sec. 4). |
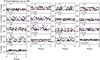 |
Fig. B.3 Gaia DR3 G-band light curves for 17 of the 20 RR Lyrae stars discussed in Sec. 5. The periods adopted to fold the light curves are those from N88 (see Col. 3 of Table A.2). |
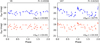 |
Fig. B.4 Gaia DR3 GBP and GRP light curves of the RR Lyrae stars V9 and V47. The periods adopted to fold the light curves are those determined in this work using the Gaia DR3 G-band time series data (see Sec. 5). |
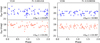 |
Fig. B.5 Same as in Fig. B.4 but for the confirmed RR Lyrae star V134 and the candidate RR Lyrae V156. The periods adopted to fold the light curves are those determined in this work using the Gaia DR3 G-band time series data (see Sec. 5.2). |
References
- Astropy Collaboration (Robitaille, T. P., et al.) 2013, A&A, 558, A33 [NASA ADS] [CrossRef] [EDP Sciences] [Google Scholar]
- Astropy Collaboration (Price-Whelan, A. M., et al.) 2018, AJ, 156, 123 [Google Scholar]
- Battaglia, G., Taibi, S., Thomas, G. F., & Fritz, T. K. 2022, A&A, 657, A54 [NASA ADS] [CrossRef] [EDP Sciences] [Google Scholar]
- Bellazzini, M., Ferraro, F. R., Origlia, L., et al. 2002, AJ, 124, 3222 [NASA ADS] [CrossRef] [Google Scholar]
- Bellm, E. C., Kulkarni, S. R., Graham, M. J., et al. 2019, PASP, 131, 018002 [Google Scholar]
- Bono, G., Iannicola, G., Braga, V. F., et al. 2019, ApJ, 870, 115 [NASA ADS] [CrossRef] [Google Scholar]
- Bressan, A., Marigo, P., Girardi, L., et al. 2012, MNRAS, 427, 127 [NASA ADS] [CrossRef] [Google Scholar]
- Carrera, R., Aparicio, A., Martínez-Delgado, D., & Alonso-García, J. 2002, AJ, 123, 3199 [NASA ADS] [CrossRef] [Google Scholar]
- Carretta, E., Bragaglia, A., Gratton, R., D’Orazi, V., & Lucatello, S. 2009, A&A, 508, 695 [NASA ADS] [CrossRef] [EDP Sciences] [Google Scholar]
- Catelan, M., & Smith, H. A. 2015, Pulsating Stars (Wiley-VCH Verlag GmbH & Co. KGaA) [Google Scholar]
- Chiti, A., Frebel, A., Simon, J. D., et al. 2021, Nat. Astron., 5, 392 [NASA ADS] [CrossRef] [Google Scholar]
- Clementini, G., Di Tomaso, S., Di Fabrizio, L., et al. 2000, AJ, 120, 2054 [Google Scholar]
- Clementini, G., Ripepi, V., Molinaro, R., et al. 2019, A&A, 622, A60 [NASA ADS] [CrossRef] [EDP Sciences] [Google Scholar]
- Clementini, G., Ripepi, V., Garofalo, A., et al. 2023, A&A, 674, A18 [NASA ADS] [CrossRef] [EDP Sciences] [Google Scholar]
- Cudworth, K. M., Olszewski, E. W., & Schommer, R. A. 1986, AJ, 92, 766 [NASA ADS] [CrossRef] [Google Scholar]
- Dolphin, A. E. 2002, MNRAS, 332, 91 [NASA ADS] [CrossRef] [Google Scholar]
- Dotter, A., Chaboyer, B., Jevremović, D., et al. 2008, ApJS, 178, 89 [Google Scholar]
- Drake, A. J., Graham, M. J., Djorgovski, S. G., et al. 2014, ApJS, 213, 9 [Google Scholar]
- Frayn, C. M., & Gilmore, G. F. 2003, MNRAS, 339, 887 [NASA ADS] [CrossRef] [Google Scholar]
- Gaia Collaboration (Vallenari, A., et al.) 2023, A&A, 674, A1 [NASA ADS] [CrossRef] [EDP Sciences] [Google Scholar]
- Garofalo, A., Tantalo, M., Cusano, F., et al. 2021, ApJ, 916, 10 [NASA ADS] [CrossRef] [Google Scholar]
- Garofalo, A., Delgado, H. E., Sarro, L. M., et al. 2022, MNRAS, 513, 788 [NASA ADS] [CrossRef] [Google Scholar]
- Hunter, J. D. 2007, Comput. Sci. Eng., 9, 90 [NASA ADS] [CrossRef] [Google Scholar]
- Iben, I. J. 1974, ARA&A, 12, 215 [NASA ADS] [CrossRef] [Google Scholar]
- Iorio, G., & Belokurov, V. 2021, MNRAS, 502, 5686 [Google Scholar]
- Irwin, M., & Hatzidimitriou, D. 1995, MNRAS, 277, 1354 [NASA ADS] [CrossRef] [Google Scholar]
- Jensen, J., Hayes, C. R., Sestito, F., et al. 2024, MNRAS, 527, 4209 [Google Scholar]
- Kalirai, J. S., Anderson, J., Dotter, A., et al. 2013, ApJ, 763, 110 [NASA ADS] [CrossRef] [Google Scholar]
- Kholopov, P. N. 1971, Peremennye Zvezdy, 18, 117 [Google Scholar]
- Kirby, E. N., Guhathakurta, P., Simon, J. D., et al. 2010, ApJS, 191, 352 [NASA ADS] [CrossRef] [Google Scholar]
- Kirby, E. N., Lanfranchi, G. A., Simon, J. D., Cohen, J. G., & Guhathakurta, P. 2011, ApJ, 727, 78 [Google Scholar]
- Lee, Y.-W., Demarque, P., & Zinn, R. 1990, ApJ, 350, 155 [Google Scholar]
- Li, X.-Y., Huang, Y., Liu, G.-C., Beers, T. C., & Zhang, H.-W. 2023, ApJ, 944, 88 [NASA ADS] [CrossRef] [Google Scholar]
- Mateo, M. L. 1998, ARA&A, 36, 435 [NASA ADS] [CrossRef] [Google Scholar]
- McConnachie, A. W. 2012, AJ, 144, 4 [Google Scholar]
- McConnachie, A. W., & Venn, K. A. 2020, AJ, 160, 124 [Google Scholar]
- Medina, G. E., Muñoz, R. R., Vivas, A. K., et al. 2018, ApJ, 855, 43 [NASA ADS] [CrossRef] [Google Scholar]
- Mighell, K. J., & Burke, C. J. 1999, AJ, 118, 366 [NASA ADS] [CrossRef] [Google Scholar]
- Muñoz, R. R., Geha, M., Côté, P., et al. 2012, ApJ, 753, L15 [CrossRef] [Google Scholar]
- Muraveva, T., Giannetti, A., Clementini, G., Garofalo, A., & Monti, L. 2024, MNRAS, submitted [arXiv:2407.05815] [Google Scholar]
- Nemec, J. M., Wehlau, A., & Mendes de Oliveira, C. 1988, AJ, 96, 528 [Google Scholar]
- Ochsenbein, F., Bauer, P., & Marcout, J. 2000, A&AS, 143, 23 [NASA ADS] [CrossRef] [EDP Sciences] [Google Scholar]
- Olszewski, E. W., & Aaronson, M. 1985, AJ, 90, 2221 [NASA ADS] [CrossRef] [Google Scholar]
- Pace, A. B., Kaplinghat, M., Kirby, E., et al. 2020, MNRAS, 495, 3022 [NASA ADS] [CrossRef] [Google Scholar]
- Prudil, Z., Kunder, A., Dékány, I., & Koch-Hansen, A. J. 2024, A&A, 684, A176 [NASA ADS] [CrossRef] [EDP Sciences] [Google Scholar]
- Riello, M., De Angeli, F., Evans, D. W., et al. 2021, A&A, 649, A3 [NASA ADS] [CrossRef] [EDP Sciences] [Google Scholar]
- Rimoldini, L., Holl, B., Gavras, P., et al. 2023, A&A, 674, A14 [NASA ADS] [CrossRef] [EDP Sciences] [Google Scholar]
- Ripepi, V., Molinaro, R., Musella, I., et al. 2019, A&A, 625, A14 [NASA ADS] [CrossRef] [EDP Sciences] [Google Scholar]
- Ripepi, V., Clementini, G., Molinaro, R., et al. 2023, A&A, 674, A17 [NASA ADS] [CrossRef] [EDP Sciences] [Google Scholar]
- Ruhland, C., Bell, E. F., Rix, H.-W., & Xue, X.-X. 2011, ApJ, 731, 119 [NASA ADS] [CrossRef] [Google Scholar]
- Samus’, N. N., Kazarovets, E. V., Durlevich, O. V., Kireeva, N. N., & Pastukhova, E. N. 2017, Astron. Rep., 61, 80 [Google Scholar]
- Sarajedini, A. 2011, in RR Lyrae Stars, Metal-Poor Stars, and the Galaxy, 5, ed. A. McWilliam, 181 [NASA ADS] [Google Scholar]
- Schlafly, E. F., & Finkbeiner, D. P. 2011, ApJ, 737, 103 [Google Scholar]
- Schlegel, D. J., Finkbeiner, D. P., & Davis, M. 1998, ApJ, 500, 525 [Google Scholar]
- Searle, L., & Zinn, R. 1978, ApJ, 225, 357 [Google Scholar]
- Sesar, B., Hernitschek, N., Mitrović, S., et al. 2017, AJ, 153, 204 [NASA ADS] [CrossRef] [Google Scholar]
- Sestito, F., Zaremba, D., Venn, K. A., et al. 2023, arXiv e-prints, [arXiv:2301.13214] [Google Scholar]
- Smith, H. A. 1995, Cambridge Astrophysics Series, 27 [Google Scholar]
- Tammann, G. A., Sandage, A., & Reindl, B. 2008, ApJ, 679, 52 [NASA ADS] [CrossRef] [Google Scholar]
- Tau, E. A., Vivas, A. K., & Martínez-Vázquez, C. E. 2024, AJ, 167, 57 [NASA ADS] [CrossRef] [Google Scholar]
- Taylor, M. B. 2005, in Astronomical Society of the Pacific Conference Series, 347, Astronomical Data Analysis Software and Systems XIV, eds. P. Shopbell, M. Britton, & R. Ebert, 29 [Google Scholar]
- Tully, R. B., Courtois, H. M., Dolphin, A. E., et al. 2013, AJ, 146, 86 [NASA ADS] [CrossRef] [Google Scholar]
- van Agt, S. L. T. J. 1967, Bull. Astron. Inst. Netherlands, 19, 275 [NASA ADS] [Google Scholar]
- van der Walt, S., Colbert, S. C., & Varoquaux, G. 2011, Comput. Sci. Eng., 13, 22 [Google Scholar]
- Vasiliev, E., & Baumgardt, H. 2021, MNRAS, 505, 5978 [NASA ADS] [CrossRef] [Google Scholar]
- Vivas, A. K., & Zinn, R. 2006, AJ, 132, 714 [Google Scholar]
- Webbink, R. F. 1985, in Dynamics of Star Clusters, 113, eds. J. Goodman, & P. Hut, 541 [NASA ADS] [Google Scholar]
- Weisz, D. R., Dolphin, A. E., Skillman, E. D., et al. 2014, ApJ, 789, 147 [Google Scholar]
- Wilson, A. G. 1955, PASP, 67, 27 [NASA ADS] [CrossRef] [Google Scholar]
- Zgirski, B., Pietrzyński, G., Górski, M., et al. 2023, ApJ, 951, 114 [NASA ADS] [CrossRef] [Google Scholar]
- Zinn, R., & West, M. J. 1984, ApJS, 55, 45 [Google Scholar]
SELECT source_id, ra, ra_error, dec, dec_error, parallax, parallax_error, phot_g_mean_mag, phot_bp_mean_mag, phot_rp_mean_mag, pmra, pmra_error, pmdec, pmdec_error FROM gaiadr3.gaia_source WHERE 1 = CONTAINS( POINT(227.24200, +67.22210), CIRCLE(ra, dec, 3.5)).
The star is also placed well beyond 12 rh from the centre of UMi (∆RA = −6.05 deg, ∆Dec = −0.54 deg).
This is the period criterion adopted by Clementini et al. (2023) to select known RR Lyrae stars and define a reference sample to validate new RR Lyrae stars in Gaia DR3.
Garofalo et al. (2022) PWZ relation is calibrated on the Gaia DR3 parallaxes of 169 Galactic field RR Lyrae stars distributed all sky, spanning the metallicity range −2.84 < [Fe/H] < 0.07 dex and luminosities from 9 to 17 mag in the G band.
We did not directly use the Gaia DR3 parallaxes of UMi’s Gold sample RR Lyrae stars to obtain the absolute Wesenheit magnitudes because at the distance (and faint magnitude) of UMi’s RR Lyrae they could be less solid.
The difference in the distance modulus of UMi using the recalculated G magnitudes would be 0.001 mag. This difference is well within the uncertainty of our distance modulus.
RUWE is the Gaia Renormalized Unit Weight Error. A description of this parameter can be found in section 14.1.2 of the Gaia Data Release 2 Documentation release 1.2. A RUWE significantly greater than 1.4 could indicate that the source is non-single or otherwise problematic for the astrometric solution. The RUWE value for V56 is 3.48.
Mean magnitudes (phot_bp_mean_mag and phot_rp_mean_mag) in the Gaia DR3 main catalogue are computed from the BP–band and RP–band mean flux applying the magnitude zero–point in the Vega scale (Riello et al. 2021).
N88 find a clear peak at P ~ 0.218 days in the periodogram of V74, but notice that the star is too red to be an RR Lyrae.
ф31 and A2 are parameters of the Fourier decomposition of the star light curve folded with period.
All Tables
Centre coordinates and structural parameters of UMi adopted in this work reported with the respective references.
Identification numbers and properties of the 57 RR Lyrae stars in the Gold sample.
Twenty RR Lyrae stars identified in UMi by N88 that are included in the Gaia DR3 vari_rrlyrae table or are classified as ‘RR’ in the DR3 vari_classifier_result table.
Known variable stars in UMi that are neither included in the Gaia DR3 vari_rrlyrae table nor classified as ‘RR’ in vari_classifier_result table.
All Figures
|
Fig. 1 Left panel: map of sources within a circle of 3.5 degrees in radius from UMi’s centre coordinates that we retrieved from the Gaia DR3 archive. The four ellipses show 3 (inner ellipse), 5, 11 and 12 times the galaxy rh (outer ellipse, black solid line) adopting the position angle ϕ, rh, and ellipticity from Sestito et al. (2023), and the centre coordinates of Irwin & Hatzidimitriou (1995) (see Table 1). A lime cross indicates the position of the cluster Muñoz 1. The magenta filled circles mark the sources classified as RR Lyrae stars in the Gaia DR3 vari_rrlyrae table that are located inside and outside 12 times the galaxy rh. Four cyan circles mark additional candidate RR Lyrae stars listed in the Gaia DR3 vari_classifier_result table. The red and orange open circles mark spectroscopically confirmed members of UMi respectively from Kirby et al. (2010) and Pace et al. (2020), the blue empty squares mark the furthest RGB members of UMi from Sestito et al. (2023). Right panel: same as in the left panel, but showing with filled circles only sources classified as RR Lyrae stars in the vari_classifier_result and vari_rrlyrae tables, colour-coded according to their mean G magnitude. |
| In the text | |
|
Fig. 2 Left: G, GBP–GRP CMD of all sources in our catalogue of ∼160 thousand objects within the area delimited by our selection around the centre of UMi. The magenta and cyan filled circles mark the RR Lyrae stars classified by Gaia DR3. The red, orange, and blue symbols mark the UMi members from Kirby et al. (2010), Pace et al. (2020), and Sestito et al. (2023), respectively. Right: zoomed-in image of the left panel. The yellow filled black circles highlight 20 sources classified as RR Lyrae by Gaia DR3, located beyond 12 times the elliptical half-light radius of the galaxy. |
| In the text | |
|
Fig. 3 Period-amplitude (Bailey) diagram in the G band for 164 variable stars in the area that we selected around UMi’s centre which are included in the vari_rrlyrae table. The black dots mark the 57 RR Lyrae stars of the Gold sample. |
| In the text | |
|
Fig. 4 Left panel: same as in the left panel of Fig. 1 but showing only the 57 RR Lyrae stars in the Gold sample plotted as black filled circles and using violet filled circles for V43, V60 and V63. We computed revised mean magnitudes for these three stars (see text for details). Right panel: G vs GBP – GRP CMD of UMi’s spectroscopically confirmed members and the 57 RR Lyrae stars in the Gold sample. Symbols are as in the left panel. The black crosses mark the V43, V60 and V63 positions on the CMD using the unrevised magnitudes. |
| In the text | |
|
Fig. 5 Left panels: distribution of Gaia DR3 proper motion components for UMi RGB member stars (top panels) from Kirby et al. (2010) and Pace et al. (2020), for the whole sample of variable stars classified as RR Lyrae by Gaia (middle panels), and compared with UMi’s known RR Lyrae stars in the Gold sample (bottom panels). Central panels: Gaia DR3 proper motions maps for the three datasets shown in the left panels. The five RGB stars from Sestito et al. (2023) are marked by blue empty squares in the top central panel and in the right panel of the figure. Right panel: the proper motion map for all three datasets together. The proper motions of RR Lyrae stars included in the Gold sample are plotted with their uncertainties. The blue dashed lines in the bottom left panels and the blue dashed circle in the right panel mark the proper motion distribution range for RR Lyrae stars in the Gold sample. |
| In the text | |
|
Fig. 6 Left panel: map of the Gaia DR3 proper motion components for member stars of UMi spectroscopically confirmed by Kirby et al. (2010), Pace et al. (2020) and Sestito et al. (2023). Sources are colour-coded according to their G magnitudes in the Gaia DR3 catalogue. Central panels: errors of the Gaia DR3 proper motion components plotted vs G magnitude for the sources in the left panel. The dashed lines show the 0.55 mas/yr threshold that we adopted to distinguish between reliable and less reliable proper motions. Right panel: Gaia DR3 proper motions of sources around UMi’s centre. The sources are colour-coded as in Figs. 2 and 5. In particular, the filled orange and red circles are RGB member stars of UMi with proper motion uncertainties smaller than 0.55 mas/yr. A lime cross marks the mean proper motions of the faint cluster Muñoz 1 according to Vasiliev & Baumgardt (2021). |
| In the text | |
|
Fig. 7 Comparison of UMi distance modulus (grey filled circle), obtained using the Gold sample RR Lyrae stars and the MG –[Fe/H] relation, with literature measurements obtained from different methods and distance indicators: CMD (cyan), HB level (red), RR Lyrae stars (purple) and RGB Tip (blue). The dotted lines show the uncertainty (± 0.11 mag) associated with our distance modulus estimate (see text for details). References: (1) Olszewski & Aaronson (1985); (2) Kalirai et al. (2013); (3) Dolphin (2002); (4) Mighell & Burke (1999); (5) Weisz et al. (2014); (6) Irwin & Hatzidimitriou (1995); (7) Ruhland et al. (2011); (8) Webbink (1985); (9) Carrera et al. (2002); (10) Cudworth et al. (1986); (11) N88; (12) Tammann et al. (2008); (13) Frayn & Gilmore (2003); (14) Tully et al. (2013); (15) Bellazzini et al. (2002). |
| In the text | |
|
Fig. 8 Comparison of the Wesenheit magnitudes of UMi Gold sample RR Lyrae stars and the |
| In the text | |
|
Fig. 9 Upper panels: |
| In the text | |
|
Fig. 10 Upper panel: proper motion diagram of UMi’s Gold RR Lyrae stars (black filled circles) and 43 variable stars significantly brighter than UMi’s HB, that are placed within (magenta filled circles) and beyond (yellow filled circles) 12 rh from the centre of the galaxy. Lower panel: zoomed-in view of the upper panel. The labelled sources are discussed in Section 4. The green filled circles mark V56 and V80, for which we do not confirm N88’s classification as ACs. |
| In the text | |
|
Fig. 11 Left and central panels: Gaia DR3 G-band light curves of ACs in UMi. Five of them were already known from N88, which we have confirmed. Four new ACs plus one AC candidate have been identified during this work. The variable stars are ordered by increasing number according to N88’s and our identifications. The magenta and yellow filled phase points mark stars within and beyond 12 times the galaxy half-light radius, respectively. The pulsation periods adopted to fold the light curves are from Gaia DR3 vari_rrlyrae table, except for (I) V178 whose light curve is folded with the period derived in our analysis of the time series data (see details in the text). Right panels: spatial distribution (top) and position on the CMD (bottom) of the 10 ACs (nine confirmed plus one candidate) with respect to the UMi members. The green filled circles mark V80 and V56, for which we do not confirm the N88 classification as ACs. |
| In the text | |
|
Fig. 12 G-band light curves for 20 RR Lyrae stars identified in UMi by N88, that are not included in the Gold sample. The sources are ordered according to the identifiers by N88 increasing from left to right and phased according to the periods listed in Cols 5 (light curves with magenta filled circles) and 7 (light curves with orchid open circles; V9, V47, and V72) of Table A.2, respectively (see discussion in Sect. 5). |
| In the text | |
|
Fig. 13 Top panel: position of the 20 sources in Table A.2 on the |
| In the text | |
|
Fig. 14 Left panels: position of the 20 known RR Lyrae stars listed in Table A.2 on the G vs GBP−GRP CMD of UMi’s RGB members (cyan, orange, and red symbols) and the Gold sample RR Lyrae stars (black filled circles). The mean magnitudes and colours of the 20 RR Lyrae stars are from the DR3 vari_rrlyrae table (orchid filled circles) and from our analysis of the Gaia time series data for V9 and V47 (violet filled circles); Spatial location (bottom) and proper motion distribution (top) of the 20 RR Lyrae stars (orchid filled circles) using the Gaia DR3 astrometry. Right panels: same as in the left panels, but for the 47 RR Lyrae stars that we confirm to be new members of UMi (see Sect. 5.2). V103, V117, V120, V125, and V156 are discussed in the text. The lime filled triangles show V117 and V125 plotted adopting their GBP and GRP magnitudes from the Gaia DR3 main catalogue. |
| In the text | |
|
Fig. 15 G-band light curves of the 47 RR Lyrae stars listed in Table A.3, all of which belong to UMi. The magenta filled circles are used to display the light curves folded according to the periods provided in the Gaia DR3 vari_rrlyrae table; the magenta open circles are used instead for the light curves of the sources whose periods were re-determined from our analysis of the time series data. V155 and V156 are located beyond 12 rh; their light curves are displayed with yellow filled and yellow open circles, respectively. |
| In the text | |
|
Fig. 16 Top left panel: positions of V12, V57, V84 and V95 on the Gaia DR3 |
| In the text | |
|
Fig. 17 Distribution of the photometric metallicities from Muraveva et al. (2024) for 62 RR Lyrae stars that we confirm to belong to UMi. |
| In the text | |
|
Fig. 18 Bailey diagrams of the RR Lyrae stars belonging to UMi. Left panel: the black filled circles mark the Gold sample RR Lyrae; the known and new RR Lyrae members of UMi confirmed in this work are plotted with teal and blue filled circles, respectively. A total of 125 sources are shown in the figure. Right panel: same as in the left panel, but with 62 UMi RR Lyrae stars with photometric metallicities from Muraveva et al. (2024) marked by filled circles colour-coded according to their metallicity, and UMi RR Lyrae members lacking a metallicity value shown by empty circles. Grey points in the background show the all-sky RR Lyrae sample published in the Gaia DR3 vari_rrlyrae table (~270 000 sources). |
| In the text | |
|
Fig. 19 CMD of UMi’s member stars from Sestito et al. (2023), Pace et al. (2020) and Kirby et al. (2010) (blue, orange, and red symbols, respectively), overlaid by Padua stellar isochrones (Bressan et al. 2012) for different combinations of age and metallicity. Left panels: stellar isochrones with metal abundance: Z = 0.0001, Z = 0.0002, and Z = 0.0003, and age t = 13 Gyr. Right panels: stellar isochrones with metal abundance: Z = 0.0001, Z = 0.0002, and Z = 0.0003, and age t = 1 Gyr. The filled symbols in different colours distinguish the various RR Lyrae subsamples: gold (black); known (cyan); new members (navy); and known, but not classified by Gaia DR3 as RR Lyrae stars (green). The magenta and yellow filled circles are known and new ACs belonging to UMi located within and beyond 12 rh. |
| In the text | |
|
Fig. 20 CMD of UMi members (RGB, HB, and RR Lyrae stars) using the same symbols and colour-coding as in Fig. 19. Overlaid on the CMD are Padua stellar isochrones (Bressan et al. 2012) for a fixed age, t = 13 Gyr, and three different metal abundances (Z = 0.0003 grey, Z = 0.0004 purple, and Z = 0.0005 lime). Isochrones are fixed at a distance d = 45 kpc in the left panel and at d = 40 kpc in the right panel. The pink circles highlight 43 variable stars brighter than G =19.25 mag discussed in Sect. 4, among which are ten ACs of UMi. |
| In the text | |
|
Fig. 21 Spatial distribution of 129 RR Lyrae in UMi (128 bona fide and 1 candidate) with sources colour-coded according to their individual distance moduli derived from the MG−[Fe/H] relation for fixed metallicity: [Fe/H] = −2.13 dex (left panel), and according to their individual photometric metallicity values from Muraveva et al. (2024) (right panel). |
| In the text | |
|
Fig. B.1 From top to bottom: Gaia DR3 GBP, GRP and G light curves for the Gold sample RR Lyrae stars V43, V60 and V63. All curves are folded with the periods obtained from our analysis. They are perfectly consistent with the periods published for these sources in the Gaia DR3 vari_rrlyrae table and in N88. |
| In the text | |
|
Fig. B.2 Gaia DR3 GBP and GRP light curves of the candidate AC V178 (I) and the RRc star V57. The periods adopted to fold the light curves are those redetermined in this work using Gaia DR3 time series (see Sec. 4). |
| In the text | |
|
Fig. B.3 Gaia DR3 G-band light curves for 17 of the 20 RR Lyrae stars discussed in Sec. 5. The periods adopted to fold the light curves are those from N88 (see Col. 3 of Table A.2). |
| In the text | |
|
Fig. B.4 Gaia DR3 GBP and GRP light curves of the RR Lyrae stars V9 and V47. The periods adopted to fold the light curves are those determined in this work using the Gaia DR3 G-band time series data (see Sec. 5). |
| In the text | |
|
Fig. B.5 Same as in Fig. B.4 but for the confirmed RR Lyrae star V134 and the candidate RR Lyrae V156. The periods adopted to fold the light curves are those determined in this work using the Gaia DR3 G-band time series data (see Sec. 5.2). |
| In the text | |
Current usage metrics show cumulative count of Article Views (full-text article views including HTML views, PDF and ePub downloads, according to the available data) and Abstracts Views on Vision4Press platform.
Data correspond to usage on the plateform after 2015. The current usage metrics is available 48-96 hours after online publication and is updated daily on week days.
Initial download of the metrics may take a while.