Open Access
Fig. 3
Download original image
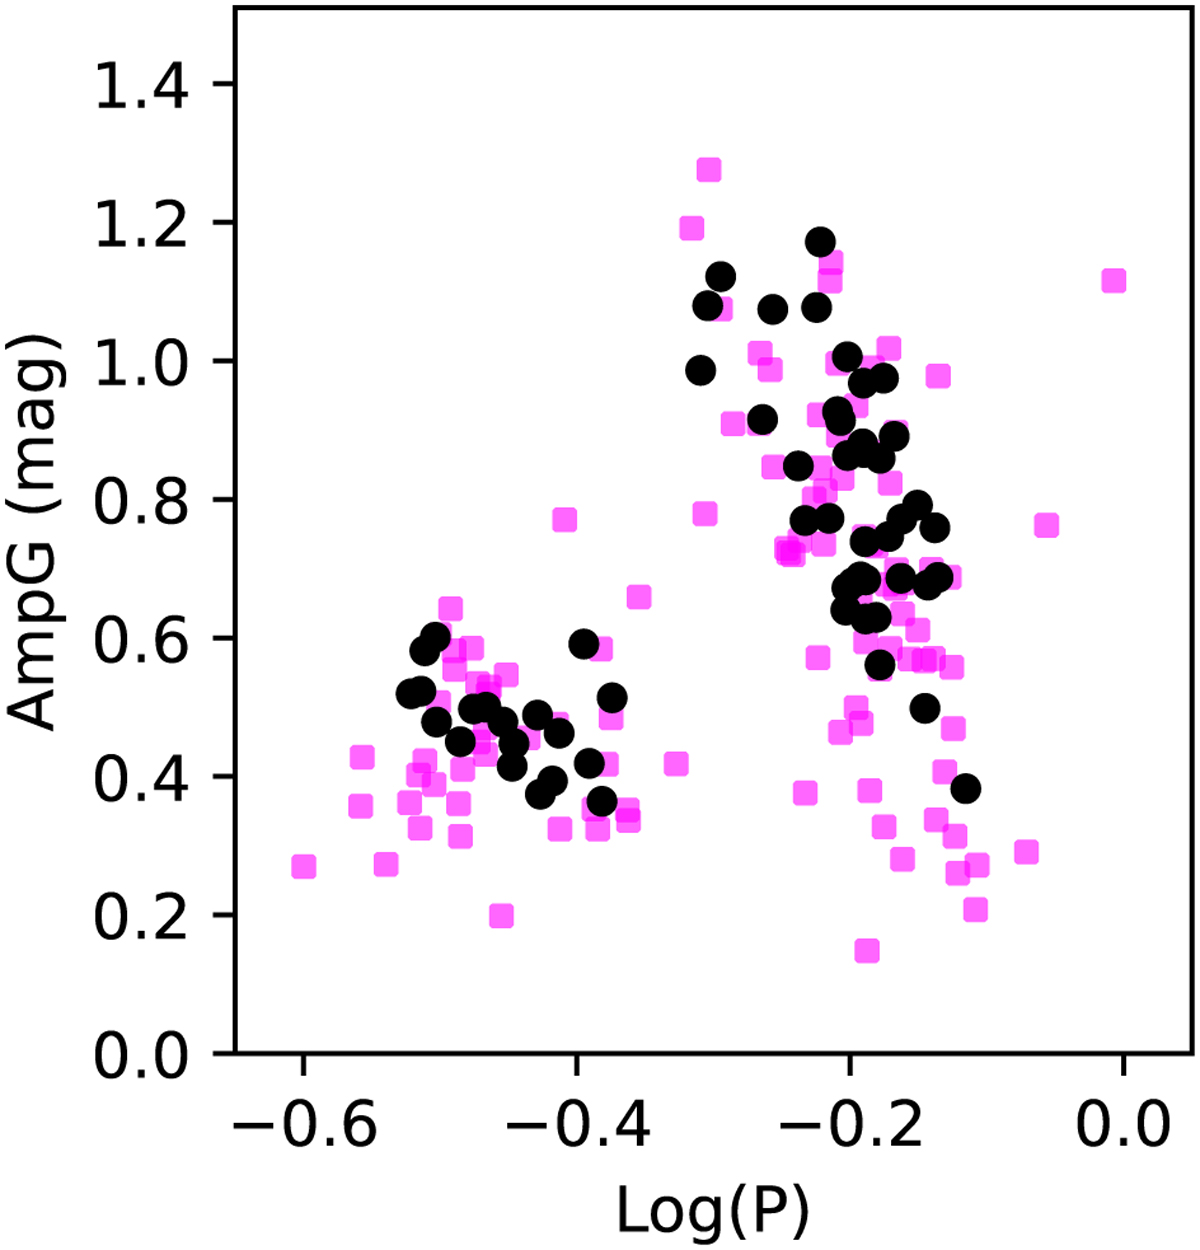
Period-amplitude (Bailey) diagram in the G band for 164 variable stars in the area that we selected around UMi’s centre which are included in the vari_rrlyrae table. The black dots mark the 57 RR Lyrae stars of the Gold sample.
Current usage metrics show cumulative count of Article Views (full-text article views including HTML views, PDF and ePub downloads, according to the available data) and Abstracts Views on Vision4Press platform.
Data correspond to usage on the plateform after 2015. The current usage metrics is available 48-96 hours after online publication and is updated daily on week days.
Initial download of the metrics may take a while.