Fig. 1
Download original image
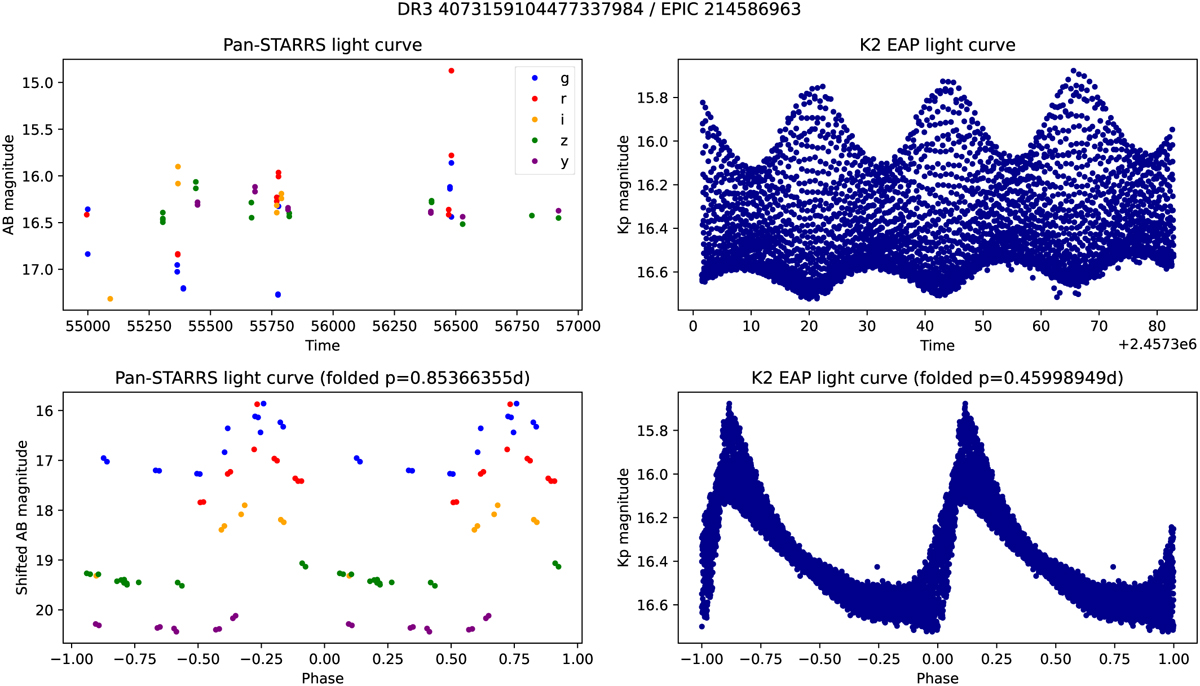
Light curve comparison for a sample RR Lyrae star. The upper left panel visualises the Pan-STARRS light curve of the star, in all five filters, and the lower left panel shows the light curve phase-folded with the period given in the (Sesar et al. 2017) catalogue. In order to make the periodicity more transparent, we shifted the AB magnitude levels of each filter’s light curve by adding 0, 1, 2, 3, 4 magnitudes to the g, r, i, z, y filter light curves. The upper right panel illustrates the K2 light curve, while the lower right panel shows the light curve phase-folded with the period that was determined by the Lomb–Scargle periodogram method.
Current usage metrics show cumulative count of Article Views (full-text article views including HTML views, PDF and ePub downloads, according to the available data) and Abstracts Views on Vision4Press platform.
Data correspond to usage on the plateform after 2015. The current usage metrics is available 48-96 hours after online publication and is updated daily on week days.
Initial download of the metrics may take a while.