Fig. 2
Download original image
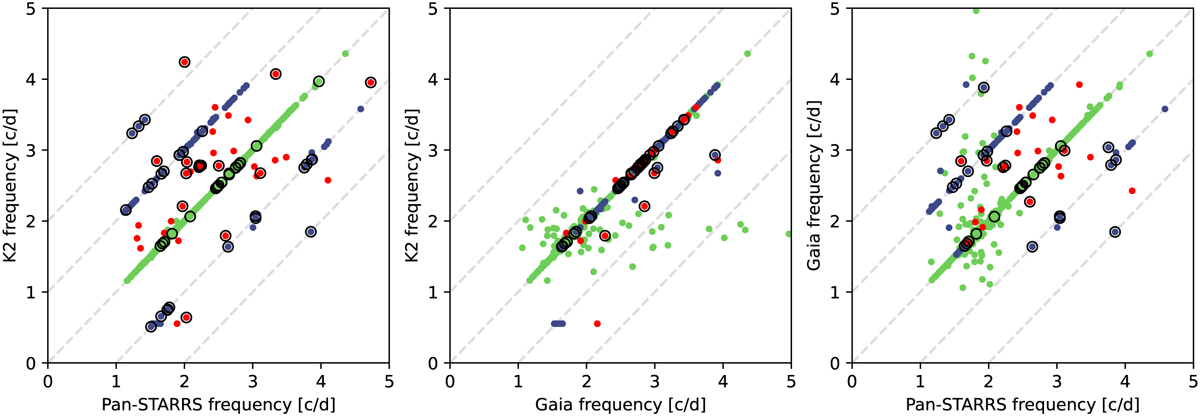
Frequency comparisons of the sample. The figure shows the comparisons of the periods determined from different datasets. For Pan-STARRS, the Sesar et al. (2017) catalogue period was used, for Gaia DR3, the Gaia RR Lyrae catalogue period was used, and for K2, our calculated values were used, which we obtained with the Lomb–Scargle periodogram method. The plot symbols are colour-coded based on the Pan-STARRS vs. K2 frequency comparison. Green dots indicate the stars that have matching frequencies, blue dots indicate the stars that have an alias of 1 or 2 cycles/day in their Pan-STARRS frequencies, and red dots signify the stars that have discrepancies between their K2 and Pan-STARRS frequencies that are not aliases. Black circles mark the stars that we found to be misclassified in the Sesar et al. (2017) catalogue.
Current usage metrics show cumulative count of Article Views (full-text article views including HTML views, PDF and ePub downloads, according to the available data) and Abstracts Views on Vision4Press platform.
Data correspond to usage on the plateform after 2015. The current usage metrics is available 48-96 hours after online publication and is updated daily on week days.
Initial download of the metrics may take a while.