Fig. 4
Download original image
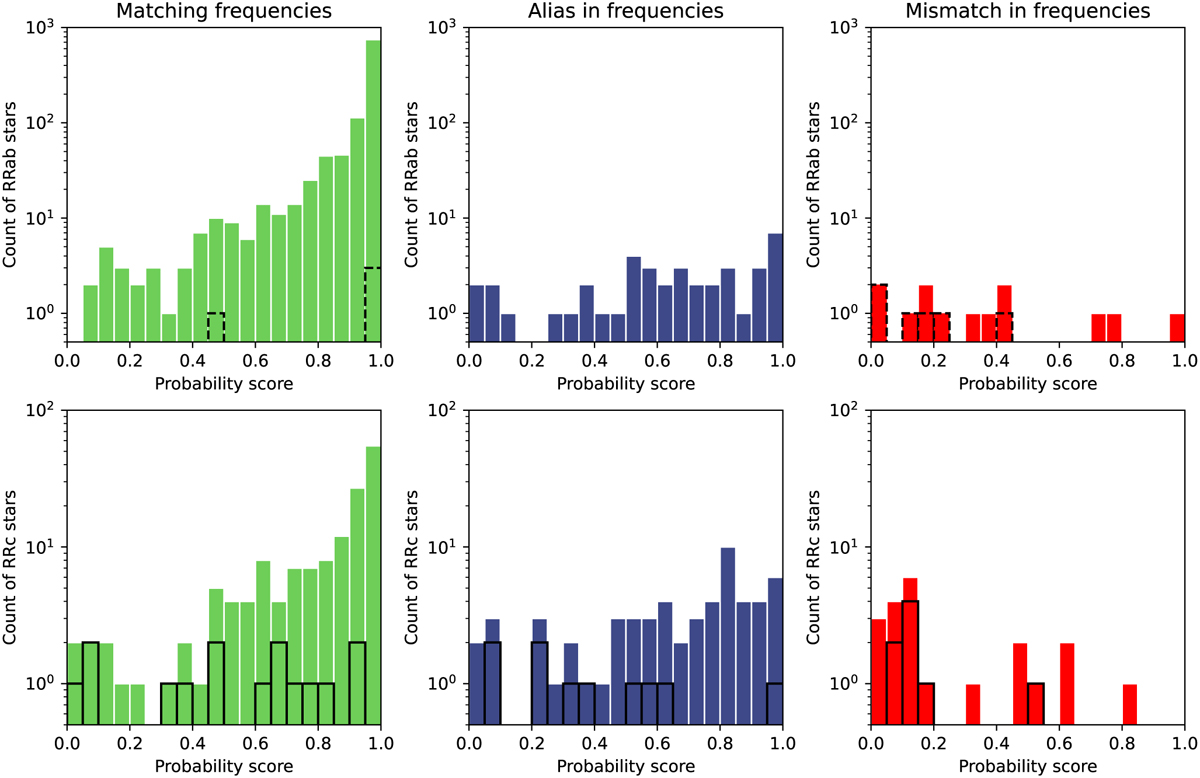
RR Lyrae classification probability score distribution of the crossmatched sample. The classification probability score of each star was given in the Sesar et al. (2017) catalogue. The color green refers to the stars with matching frequencies from K2 and Pan-STARRS, blue denotes stars that have an alias in their frequency from Pan-STARRS, and red is for the stars that have a difference in their frequencies. The dot-edged black columns show the number of misclassified stars within each bin.
Current usage metrics show cumulative count of Article Views (full-text article views including HTML views, PDF and ePub downloads, according to the available data) and Abstracts Views on Vision4Press platform.
Data correspond to usage on the plateform after 2015. The current usage metrics is available 48-96 hours after online publication and is updated daily on week days.
Initial download of the metrics may take a while.