| Issue |
A&A
Volume 689, September 2024
|
|
|---|---|---|
| Article Number | A284 | |
| Number of page(s) | 14 | |
| Section | Stellar structure and evolution | |
| DOI | https://doi.org/10.1051/0004-6361/202450432 | |
| Published online | 20 September 2024 | |
Skipping a beat: Discovery of persistent quasi-periodic oscillations associated with pulsed fraction drop of the spin signal in M51 ULX-7
1
Dipartimento di Fisica, Università degli Studi di Roma “Tor Vergata”, Via della Ricerca Scientifica 1, I-00133 Rome, Italy
2
INAF – Osservatorio Astronomico di Roma, Via Frascati 33, I-00078 Monte Porzio Catone, (RM), Italy
3
Dipartimento di Fisica, Università degli Studi di Roma “La Sapienza”, piazzale Aldo Moro 5, I-00185 Roma, Italy
4
INAF – Osservatorio Astronomico di Brera, Via E. Bianchi 46, I-23807 Merate, (LC), Italy
5
Astrophysics Sub-department, Department of Physics, University of Oxford, Denys Wilkinson Building, Keble Road, Oxford OX1 3RH, UK
6
INAF/IASF Palermo, Via Ugo La Malfa 153, I-90146 Palermo, Italy
7
Cahill Center for Astrophysics, California Institute of Technology, 1216 East California Boulevard, Pasadena, CA I-91125, USA
8
INAF – Osservatorio Astronomico di Cagliari, Via della Scienza 5, I-09047 Selargius, (CA), Italy
9
European Space Astronomy Centre (ESAC), ESA, Camino Bajo del Castillo s/n, Villanueva de la Cañada, I-28692 Madrid, Spain
10
INFN – Roma Tor Vergata, Via della Ricerca Scientifica 1, I-00133 Rome, Italy
11
Department of Physics and Astronomy, University of Southampton, Highfield, Southampton SO17 1BJ, UK
12
Scuola Universitaria Superiore IUSS Pavia, Palazzo del Broletto, piazza della Vittoria 15, I-27100 Pavia, Italy
13
INAF, Istituto di Astrofisica Spaziale e Fisica Cosmica, Via Alfonso Corti 12, I-20133 Milano, Italy
14
INAF – Osservatorio Astronomico di Brera, Via Brera 28, I-20121 Milano, Italy
15
Centre for Astrophysics Research, University of Hertfordshire, College Lane, Hatfield AL10 9AB, UK
16
Centre for Extragalactic Astronomy & Dept of Physics, Durham University, South Road, Durham DH1 3LE, UK
17
INAF – Osservatorio Astronomico di Padova, Vicolo dell’Osservatorio 5, I-35122 Padova, Italy
Received:
18
April
2024
Accepted:
12
July
2024
Abstract
Context. The discovery of pulsations in (at least) six ultraluminous X-ray sources (ULXs) has shown that neutron stars can accrete at (highly) super-Eddington rates, challenging the standard accretion theories. M51 ULX-7, with a spin signal of P ≃ 2.8 s, is the pulsating ULX (PULX) with the shortest known orbital period (Porb ≃ 2 d) and has been observed multiple times by XMM-Newton, Chandra, and NuSTAR.
Aims. We report on the timing and spectral analyses of three XMM-Newton observations of M51 ULX-7 performed between the end of 2021 and the beginning of 2022, together with a timing re-analysis of XMM-Newton, Chandra, and NuSTAR archival observations.
Methods. We investigated the spin signal by applying accelerated search techniques and studied the power spectrum through the fast Fourier transform, looking for (a)periodic variability in the source flux. We analysed the energy spectra of the 2021–2022 observations and compared them to the older ones.
Results. We report the discovery of a recurrent, significant (> 3σ) broad complex at mHz frequencies in the power spectra of M51 ULX-7. We did not detect the spin signal, setting a 3σ upper limit on the pulsed fraction of ≲10% for the single observation. The complex is significantly detected also in five Chandra observations performed in 2012.
Conclusions. M51 ULX-7 represents the second PULX for which we have a significant detection of mHz-QPOs at super-Eddington luminosities. These findings suggest that one should avoid using the observed QPO frequency to infer the mass of the accretor in a ULX. The absence of spin pulsations when the broad complex is detected suggests that the mechanism responsible for the aperiodic modulation also dampens the spin signal’s pulsed fraction. If true, this represents an additional obstacle in the detection of new PULXs suggesting an even larger occurrence of PULXs among ULXs.
Key words: accretion / accretion disks / stars: neutron / pulsars: individual: M51 ULX-7 / galaxies: individual: M51
Corresponding author; This email address is being protected from spambots. You need JavaScript enabled to view it. .
© The Authors 2024
 Open Access article, published by EDP Sciences, under the terms of the Creative Commons Attribution License (https://creativecommons.org/licenses/by/4.0), which permits unrestricted use, distribution, and reproduction in any medium, provided the original work is properly cited.
This article is published in open access under the Subscribe to Open model. This email address is being protected from spambots. You need JavaScript enabled to view it. to support open access publication.
1. Introduction
First detected by the Einstein mission at the end of the 1970s in nearby galaxies (Fabbiano 1989), ultraluminous X-ray sources (ULXs) are off-nuclear, point-like, accreting objects whose X-ray luminosity (under the assumption of isotropic emission) is in excess of 1039 erg s−1 (see Kaaret et al. 2017; Fabrika et al. 2021; King et al. 2023; Pinto & Walton 2023, for recent reviews), that is the Eddington luminosity (LEdd ≃ 1.3 × 1038M/M⊙ erg s−1, where M is the accretor mass) of a ∼10 M⊙ black hole (BH). Historically, their extreme X-ray luminosity (which can be as high as 1042 erg s−1) was explained within the context of sub-Eddington accretion onto intermediate-mass BHs (IMBHs, with MBH ≃ 102–106 M⊙; see e.g. Colbert & Mushotzky 1999). In this scenario, ULXs would be scaled-up versions of the Galactic BH binaries (GBHBs). For these systems, the presence of quasi-periodic oscillations (QPOs) at 0.1–15 Hz (type-C QPOs) in the power density spectrum (PDS) has been proposed to provide a tool for an indirect estimate of the BH mass through timing analysis (Casella et al. 2005, 2008). QPOs in the mHz range have been detected in the PDSs of various ULXs: under the assumption that these QPOs are the low-frequency equivalent of type-C QPOs seen in GBHBs, the derived masses are consistent with those expected from IMBHs (see e.g. Strohmayer et al. 2007; Strohmayer & Mushotzky 2009; Pasham et al. 2015).
Back in the early 2000s, it was proposed that ULXs could represent a class of stellar-mass, super-Eddington accretors, both NSs and BHs (King et al. 2001; Poutanen et al. 2007; Zampieri & Roberts 2009). This possibility received a first confirmation when Bachetti et al. (2014) detected coherent pulsations with period Pspin ≃ 1.37 s in the X-ray flux of M82 X-2, clearly identifying this source as an accreting, spinning, magnetic neutron star (NS) with LX ≳ 1039 erg s−1, that is a pulsating ULX (PULX). The subsequent discovery of other extragalactic PULXs (Fürst et al. 2016; Israel et al. 2017a,b; Carpano et al. 2018; Sathyaprakash et al. 2019; Rodríguez Castillo et al. 2020) has shown that accreting compact objects can exceed LEdd by up to a factor 500.
Only 6 extragalactic PULXs mostly emitting at super-Eddington luminosities are currently known out of more than 1800 (confirmed and candidates) ULXs (Walton et al. 2022; Tranin et al. 2024), but the hypothesis that the population of NS-powered ULXs is higher is supported by both spectral and timing results (as well as other 6 known NSs which exhibited ≥1039 erg s−1 outbursts for short periods, see King et al. 2023 and references therein). Rodríguez Castillo et al. (2020) noted that, if one considers only the ULXs for which we have enough statistics to detect spin pulsations with similar properties, the ratio of (confirmed and unknown) PULXs to the whole (confirmed and candidates) ULX population is ≳25%. Additionally, Koliopanos et al. (2017), Pintore et al. (2017), and Walton et al. (2018) found that PULX X-ray spectra are practically indistinguishable from the X-ray spectra of many ULXs, suggesting a larger population of ULXs powered by accreting NSs. The super-Eddington nature of these systems is supported by the magnitude of the decay of the orbit of M82 X-2 (Bachetti et al. 2022) and by the magnitude of the spin-up rate of NGC 5907 ULX-1 (Israel et al. 2017b). The discovery of pulsations from M82 X-2 has also shown that, when interpreting the mHz-QPOs of ULXs as proxy of the accretor mass, the association with type-C QPOs is not always valid: Feng et al. (2010) found a QPO in the PDS of the PULX M82 X-2 (source X42.3+59 in their article) at a frequency νQPO ≃ 3–4 mHz, which led them to identify M82 X-2 as an IMBH with a mass of ∼12 000–43 000 M⊙.
M51 ULX-7 (ULX-7 hereafter) has been identified as a PULX when Rodríguez Castillo et al. (2020) discovered coherent pulsations at a period Pspin ≃ 2.8 s and a spin-up rate Ṗspin ≃ −2.24 × 10⁻¹⁰ s s−1. It is also one of the four PULXs, together with NGC 7793 P13 (Fürst et al. 2018, 2021), M82 X-2 (Bachetti et al. 2022), and NGC 5907 ULX-1 (Israel et al. 2017a; Belfiore et al. 2024), with a confirmed orbital solution (Porb ≃ 2 d, projected semi-major axis ax sin i ≃ 28 lt-s, Rodríguez Castillo et al. 2020) and with a massive (> 8 M⊙) companion star. The source flux shows periodic dips, associated with the orbital periods, suggesting a system inclination angle of i ∼ 60° (Hu et al. 2021; Vasilopoulos et al. 2021). The X-ray flux shows a super-orbital modulation, a common property among (P)ULXs (see e.g. Lin et al. 2015; Fürst et al. 2018; Weng & Feng 2018). Initially detected by Swift at a period of ≃38 d (Vasilopoulos et al. 2020; Brightman et al. 2020), it has since evolved towards a 44 d-long period (Brightman et al. 2022). This evolution, together with an inclination of the disk components dependent on the super-orbital phase, supports the scenario of a precessing disk.
In this paper, we report the detection of a QPO-like modulation in the X-ray flux of ULX-7 in three different XMM-Newton observations performed in 2021/2022. These findings represent the first unambiguous detection of QPOs in this source (with tens of cycles sampled) over a baseline of about one month. ULX-7 is therefore the second PULX for which we have the detection of a QPO at super-Eddington luminosities.
The article is structured as follows: in Sect. 2 we describe the observations analysed in this article and the data processing techniques that we applied. In Sect. 3, we report on the results of our timing and spectral analyses. We discuss our results and the possible nature of this quasi-periodic modulation in Sect. 4, while we draw our conclusions in Sect. 5.
2. Observations and data reduction
The M51 field has been observed 45 times with relatively deep, pointed X-ray observations, including 14 observations from XMM-Newton (Jansen et al. 2001), 27 from Chandra (Weisskopf et al. 2000), and 4 from NuSTAR (Harrison et al. 2013). For our analysis, we excluded those observations during which ULX-7 was not detected or detected with less than 100 counts. We also excluded observations lasting less than 20 ks, to ensure the detection of a significant number of cycles of the modulation highlighted above, and observations whose PDSs were dominated by Chandra dithering, which introduces spurious signals at Pspurious ≃ 700–1000 s1 (see e.g. Sec. 2.3 of Nichols et al. 2010). In Table 1 we list the remaining 27 observations (12 from XMM-Newton, 14 from Chandra, and 1 from NuSTAR) we analysed and discuss in this work. We used the Chandra position ( ,
,  , J2000; Kuntz et al. 2016) to convert the event arrival times to the barycentre of the Solar System and extract source events for both XMM-Newton and Chandra. Unless otherwise stated, in this work the reported errors correspond to 1σ (68.3%) confidence ranges.
X-ray observations log.
2.1. XMM-Newton
As part of the XMM-Newton Large Program “Too B or not too B” (LP hereafter), we observed the field of view of M51, with ULX-7 on-axis, three times between November 2021 and January 2022, for a total (nominal) exposure time of about 390 ks. The XMM-Newton observations with ObsID 0883550101, 0883550201, and 0883550301 have not yet been presented elsewhere. Hereafter, we refer to observations 0883550101, 0883550201, and 0883550301 as observations A, B, and C, respectively. ULX-7 was detected in every observation in the three CCD cameras, with the EPIC PN (Strüder et al. 2001) operated in Full Frame mode (time resolution δt = 73.4 ms) and both EPIC MOS (Turner et al. 2001) in Small Window mode (time resolution δt = 0.3 s for the central CCD) to resolve the 2.8 s-long spin pulsations. We used SAS (Gabriel et al. 2004) v21.0.0 with the latest XMM-Newton calibrations and applied standard data reduction procedures to prepare the raw data for both timing and spectral analysis. We selected only the events with PATTERN ≤ 4 from the EPIC PN data and events with PATTERN ≤ 12 from the EPIC MOS data . We considered events in the 0.3–10 keV band for both our timing and spectral analysis. Considering the presence of nearby sources, we selected events for both timing and spectral analysis from a circular region with 20″-radius centred on the source position. To properly take into account the diffuse emission in the proximity of ULX-7 and a close chip gap, the background was estimated from an annular region centred on the source position and with inner and outer radii equal to 21″ and 39″, respectively. There are X-ray sources within this region, which were excluded from the event selection. Such a small inner radius is usually not recommended for the background region, due to the XMM-Newton point spread function. We verified that the contamination from the source is acceptable by considering other circular background regions further away from ULX-7. We found that both the background-subtracted light curve count rates and the spectra parameters are consistent with the ones produced using the annular region. Since the latter better describes the diffuse emission surrounding ULX-7, we preferred our initial choice for the annular background region.
We extracted the high energy (E > 10 keV) light curves of the entire field of view to verify the presence of high-background particle flares. To correct for the high-flaring background our observations were affected by, we adopted two different criteria for the timing and spectral analysis. In the first case, considering that the background does not affect the search for the spin signal and to avoid introducing too many gaps in the light curve, we removed only the particle flares at the beginning and/or at the end of the observation. The effective exposure time of our three observations is then reduced to 117.0, 114.1, and 127.1 ks, respectively. The event arrival times were barycentred to the source coordinates using the SAS task barycen. The data for timing analysis were background-corrected by the means of the SAS task epiclccorr. For the spectral analysis of observations 0883550201 and 0883550301, we further removed high background intervals occurring in the midst of the observations. As a consequence, the net exposure time for the spectral analysis is further reduced to 72.0, 101.5, and 102.6 ks during observation 0883550201 for the EPIC PN, EPIC MOS1, and EPIC MOS2 data, respectively. In observation 0883550301, the net exposure is 93.3, 121.3, and 122.9 ks for the EPIC PN, EPIC MOS1, and EPIC MOS2 data, respectively. We discarded the spectra of observation 0883550101 due to a particularly high particle flare contamination. We created response matrices and ancillary files with the SAS tasks rmfgen and arfgen. Spectra were binned with a minimum of 25 counts per energy bin to allow for fits with a χ2 statistics. We followed the same data reduction procedure (PATTERN selection, background filtering, barycentric correction, and energy spectra extraction) for the archival XMM-Newton observations reported in Table 1.
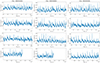 |
Fig. 1. PN+MOS light curve of ULX-7 in the 0.3–10 keV band in the three observations of our LP (bin time of 100 s). Each column corresponds to a different observation, while each row shows 32 ks-long chunks of the corresponding observation. From left to right: observations A, B, C. |
2.2. Chandra
We downloaded the latest version of the archival data of the M51 field observations. For the data reduction of Chandra observations, we employed the Chandra Interactive Analysis of Observations (CIAO) software v4.15 (Fruscione et al. 2006) and v4.10.7 of the calibration database. We reprocessed the data with the task chandra_repro and we applied the barycentric correction with axbary. We then used the wavdetect script to verify that ULX-7 had been detected during the observation and to estimate the source extraction region. We extracted the source events by the means of the task dmcopy. We considered events in the 0.5–10 keV band for our timing analysis. The radius of the source extraction region depends on the observation, but we verified that it was always smaller than 5″. Therefore, we evaluated the background using an annular region centred on ULX-7 and with inner (outer) radius 5″(20″) for all the observations.
2.3. NuSTAR
For the data reduction of the NuSTAR observation of ULX-7, we followed Brightman et al. (2022). We used nupipeline with saacalc=3 saamode=OPTIMIZED tentacle=yes to produce cleaned and calibrated events of observation 60501023002, resulting in a net exposure time of 162.0 ks. We selected these settings to account for enhanced background during passages of the South Atlantic Anomaly. We extracted source events in a circular region with a radius of 30″, while background events were extracted from a circular region on the same chip with a radius of 100″. We applied the barycentric correction to the event times of arrival using the barycorr task.
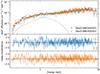 |
Fig. 2. Energy spectra of ULX-7. Top panel: simultaneous fit of the two PN+MOS spectra from observations B (blue) and C (orange) with the double-disk model. Bottom panels: residuals of the fit in units of standard deviation. Spectra of each colour include PN, MOS1 and MOS2 data (not summed) from the same observation. |
3. Data analysis and results
3.1. Timing analysis
We first produced the 0.3–10 keV PN+MOS light curves for each XMM-Newton LP observation, with a bin time of 100 s. We report the three light curves in Fig. 1, where each column corresponds to a different observation. A recurring, ks-long flaring feature is clearly visible in all three light curves. To study its evolution in energy, we considered a soft 0.3–1.5 keV band and a hard 1.5–10 keV band and produced the corresponding light curves following the same procedure. We chose to divide the two bands at 1.5 keV for several reasons. First of all, with this choice, each band includes approximately half of the detected events. Secondly, as one can see from Fig. 2, it is also approximately the energy at which the curvature of the energy spectra changes, suggesting that the hard component is starting to dominate the emission. The soft (hard) band, therefore, allows us to probe the outer (inner) regions of the disk.
We computed the hardness ratio HR = Ch/Cs, where Ch (Cs) is the count rate in the hard (soft) band. The time evolution of the hardness ratio is consistent with it being constant in time. Other choices for the soft/hard band (0.3–1/1–10 keV, 0.3–2/2–10 keV) show the same trend, suggesting that the available data do not allow us to identify a spectral evolution.
In Fig. 3 we report the 0.3–10 keV power density spectra (PDSs) corresponding to each of the three LP observations, generated with the powspec task in the XRONOS package (Stella & Angelini 1992), included in the HEASOFT v6.32.12. The PDSs were computed with a bin time of 5 s for two reasons: 1) to have a range of frequencies where we could constrain the white noise component of the fit and 2) to avoid cutting the right shoulder of the broad feature, which extends up to ∼0.01 Hz. For these PDSs, we adopted the Leahy normalization (Leahy et al. 1983) and a logarithmic rebin factor of 1.20 (i.e. each bin is 20% larger than the previous one). A broad feature in the (sub-)mHz range, likely associated with the flare-like activity in the light curves, is present in each PDS. We converted the PDSs in XSPEC format to fit them with XSPEC (Arnaud 1996) v12.13.1, included in the same HEASOFT distribution.
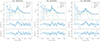 |
Fig. 3. PDSs in the 0.3–10 keV band of the LP observations A (left), B (centre), C (right). Panel a: PDS with the components used for the fit. Panel b: residuals of the model without the second Lorentzian. Panel c: residuals of the final model with two Lorentzians. For each observation, we combined data from both PN and MOS cameras. The PDSs are computed using the Leahy normalization. The model we used to fit the PDSs is described by Equation (1). |
We used the χ2 statistics to estimate the best-fit parameters. We modelled the complex in the mHz range with two Lorentzians, to better describe both the broad shoulder at higher frequencies and the sharper peak at lower frequencies. To model the whole PDS we also considered a constant in order to account for the white noise component that dominates at frequencies ν ≳ 0.1 Hz and a power-law for the red noise component dominant at frequencies ν ≲ 1 × 10⁻⁵ Hz. The final model used to fit the PDSs is described by the following equation:
 (1)
(1)
where P(ν) is the power P at the frequency ν, the first two terms on the right-hand side describe the white and red noise, respectively, and the summation describes the two Lorentzians. νi is the centroid frequency of the Lorentzian and Δνi its full width at half maximum (FWHM). In all our fits we found that the white-noise constant and the red-noise, power-law index are consistent with the expected values (using the Leahy normalization) of constWN = 2 and −2 ≲ ΓRN ≲ −1, respectively (see e.g. van der Klis 1989).
Best-fit parameters for the XMM-Newton PDSs from LP observations.
To estimate the significance of the Lorentzians we used two different, independent methods: the F-test as implemented in XSPEC (see e.g. Strohmayer et al. 2007; Strohmayer & Mushotzky 2009) and a procedure similar to the one described in Motta et al. (2015). For the latter, we converted the PDSs to the square fractional rms normalization (Belloni & Hasinger 1990) and computed the integral of the power of each Lorentzian. In Motta et al. (2015), they computed the ratio of the integral over the associated negative 1σ error (see footnote 6 in the original work). To take into account any possible non-Gaussianity in the errors, for each Lorentzian component we computed the negative Nσ error for which each integral was consistent with 0. We will first describe the results obtained with the F-test and then those obtained with the Nσ method.
For the F-test, we started from a model with only white and red noise. We found that this model results in unacceptable fits for every observation. We then added a Lorentzian to model the broad shoulder and computed its significance. We found that the fit strongly requires the broad shoulder, with a 4.8σ, 5.5σ, and 6.5σ significance in observation A, B, and C, respectively. With the available data, we cannot exclude that the broad feature is actually an unresolved sum of harmonics, given the highly non-sinusoidal shape of the modulation (see e.g. Angelini et al. 1989). The inclusion of a second Lorentzian to model the sharper peak with respect to the previous model is not strictly required, with a 2.9σ, 2.5σ, and 2.8σ significance in observation A, B, and C, respectively. However, we note that if we add the second Lorentzian we consistently obtain better residuals at ≃0.5 mHz (see lower panels of Fig. 3).
It is known that the F-test may provide incorrect results in the case of lines (Protassov et al. 2002). By using the integral approach described above, we found that both Lorentzians (the broad shoulder and the sharper peak) are significant. The broad shoulder is detected with a 3.6σ, 5.0σ, and 4.3σ significance in observation A, B, and C, respectively. The sharper peak is detected at similar confidence levels, with a 3.6σ, 3.2σ, and 4.3σ significance in observation A, B, and C, respectively. Thus, we conclude that we detect both features with a significance ≥3σ.
The results of our fits regarding the two Lorentzians, together with the corresponding rms fractional variability, are shown in Table 2 for the three observations (A, B, and C) separately. Given the little variability shown by the Lorentzians among the three observations, we also fitted the three PDSs simultaneously (A+B+C). A feature in the PDS is usually defined as a QPO when its quality factor Q = ν/Δν is Q ≳ 2. In our case, the low-frequency feature centred at νQPO ≃ 0.5 mHz can be classified as a QPO, since QQPO ≳ 2 in every observation (and up to 10). The high-frequency feature, on the other hand, always has Qbroad < 2, therefore we refer to this component as a broad shoulder, or simply as a broad feature. The rms fractional variability of each component is rmsQPO ≃ 30% and rmsbroad ≃ 40%, respectively, and appears stable among the observations. In Table 2 we also reported for each component the characteristic frequency  (see e.g. Section 2 of Ingram & Motta 2019). Although the flare-like activity could lead us to describe the feature as quasi-periodic flarings (QPFs), we opted for the terminology used for other ULXs and classified themas QPOs.
To study the energy evolution of these features, we computed the PDSs in the soft (0.3–1.5 keV) and hard (1.5–10 keV) band. We report the results of our fits in Table 2. In the case of observation A, we adopted a geometric rebin of 30%, due to poorer statistics (this observation is highly affected by particle flares). The values found for the different parameters are consistent among the different energy bands.
We looked for the presence of the 2.8-s spin signal by using acceleration algorithms and also including a first-period derivative component (see Rodríguez Castillo et al. 2020 for more details), but we found no peak associated with a periodic signal, within a reasonable period interval (see below the range for Pexp), in any of the three PDSs. To derive an upper limit on the pulsed fraction PF of the spin signal, we started from the timing solutions of Brightman et al. (2022) (P = 2.78674(4) s, the last time ULX-7 spin signal was detected, on 2019 July 12) and Rodríguez Castillo et al. (2020) (P ≃ 2.79771475(25) s, on 2018 June 14). From these values, we derived a secular spin period derivative Ṗ ≃ −3.23(1) × 10−10 s s−1. In the search we considered a conservative value of |Ṗ| < 10−8 s s−1. The expected spin signal period is, therefore, in the 2.78458 < Pexp < 2.7889 s. Finally, we followed the procedure described by Israel & Stella (1996) to compute the frequency-dependent detection threshold and the 3σ upper limit on PFrange in the 0.350–0.374 Hz range (equivalent to the 3σ confidence range on νexp), obtaining PFrange ≲ 10%. The single trial PF upper limit on a sinusoidal signal at νexp is PFsingle ≲ 6%.
We then searched for other occurrences of this mHz-complex in the PDSs of the archival X-ray observations we selected according to the criteria outlined in Sect. 2. The timing analysis of NuSTAR observation 60501023002 was already performed by Brightman et al. (2022): neither ULX-7 spin signal nor the mHz-QPOs were detected during this observation.
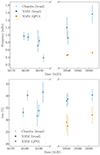 |
Fig. 4. Long-term evolution of the broad complex parameters. Top panel: evolution of the centroid frequency ν. Bottom panel: evolution of the fractional rms. Cross markers represent the values for the broad feature in Chandra data, while blue circles and orange squares represent the values for the broad feature and the candidate QPO, respectively, in the latest XMM-Newton observations. For Chandra we considered events in the 0.5–10 keV band, while for XMM-Newton events in the 0.3–10 keV band. |
In Table 1 we highlighted the observations for which the complex at mHz range has a significance ≥3σ. We found 5 consecutive Chandra observations, performed between 2012 September 9 and 2012 September 23, during which it was detected. We report the details of our analysis of the Chandra observations in Appendix A. For these observations, only one Lorentzian was required by the fit. Given the low quality factor we derive for the Lorentzian (see Table A.1), we associated it with the broad feature. In Fig. 4 we show the evolution of the centroid frequency and the fractional rms of the broad feature and the QPO. Both the frequency and the rms show little variability between the two epochs, albeit separated by almost 10 years.
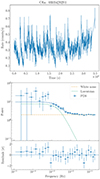 |
Fig. 5. Timing analysis of XMM-Newton observation 0303420201. Top figure: PN+MOS light curve of ULX-7. The bin time is 100 s, as in the three LP light curves. Bottom figure: ULX-7 PDS in the 0.3–10 keV band (top panel) and residuals of the white noise plus single Lorentzian model used for this observation (bottom panel). We combined data from PN and MOS cameras. The PDS is computed using the Leahy normalization. |
We also confirmed a different type of variability, first reported by Earnshaw et al. (2016), in an archival XMM-Newton observation (ObsID 0303420201), for which we show the 0.3–10 keV light curve and the associated PDS with a logarithmic rebin factor of 1.32 in the top and bottom panel of Fig. 5, respectively. In this case, we found that red noise at the low-frequency end of the PDS was not required by the fit. Instead, we fitted the low-frequency tail of the PDS with a Lorentzian centred at 0, finding a width Δν = 4.2−1.1+1.2 mHz (χ2/d.o.f. = 14/24).
3.2. Spectral analysis
We analysed ULX-7 spectra from observations B and C with the XSPEC package (Arnaud 1996) also used for the fitting of the PDSs. We stress again that we excluded observation A for our spectral analysis due to particularly high particle flare contamination. For the computation of the absorption column densities, we adopted the element abundances and cross sections of Wilms et al. (2000) and Verner et al. (1996), respectively. The uncertainties reported for the parameters of the considered spectral models represent a 90% confidence range. We computed the absorbed and unabsorbed fluxes in the 0.3–10 keV band using the pseudo-model CFLUX. To derive the unabsorbed luminosities, we considered a distance from the source of 8.58 Mpc (McQuinn et al. 2016).
We modelled the spectra with two absorbed multi-temperature disk black bodies (following the approach of previous works, e.g. Gúrpide et al. 2021 and Brightman et al. 2022) using the XSPEC component DISKBB (Mitsuda et al. 1984). For the absorption, we considered two separate TBABS components for the Galactic and intrinsic column densities. The former was fixed to 3.3 × 1020 cm−2 (HI4PI Collaboration 2016), while the latter was left free to vary. At first, we fitted the two spectra separately and found the best-fit parameters consistent with each other, indicative of the same spectral state. Hence, we fitted them simultaneously, to increase the precision on the best-fit parameters. This latter fit resulted in a χ2/d.o.f. = 607.21/651 and a null hypothesis probabilty n.h.p. = 0.889, with best-fit temperatures of the two disks of ∼0.3 keV and ∼2.7 keV, respectively. All best-fit results are reported in Table 3. Both temperatures are consistent with those found for other ULXs (e.g., Gúrpide et al. 2021). A check for intercalibration issues between the cameras, with a multiplicative renormalisation constant in the model, led to non-significant differences in the best-fit parameters, nor in the goodness of the fit.
LP observations best-fit spectral parameters.
We tested the hypothesis of a third spectral component at higher energies, as observed in some ULXs (see e.g. Walton et al. 2018). Following Brightman et al. (2022), who analysed simultaneous XMM-Newton+NuSTAR observations of ULX-7, we added a cutoff power law to the spectral model (CUTOFFPL). Due to the lack of data at energies above 10 keV, we froze the power law photon index and cutoff energy to the best-fit values of Brightman et al. (2022) of Γ = 0.8 and Ecut = 8.1 keV, respectively. This new fit did not significantly improve the statistics compared to the previous one (χ2/d.o.f. = 607.21/650 and n.h.p. = 0.884), with an upper limit on the power law normalisation of 8 × 10⁻⁶ photons keV−1 cm−1 s−1. Hence, we decided to keep just the two thermal components. Rodríguez Castillo et al. (2020) reached an identical conclusion for previous observations of ULX-7 when only XMM-Newton data were available. In general, the cutoff power law is needed only when data above 10 keV are available and in the case of a NS accretor this component is associated with the emission from the accretion column (see e.g. Walton et al. 2018). We report the spectra of observations B and C, together with the double-disk model resulting from the simultaneous fit of the two observations, in Fig. 2.
For purpose of comparison with Rodríguez Castillo et al. (2020), we also fitted the spectra with a black body spectrum (BBODYRAD) in place of the harder multi-temperature black body component. Also in this case, we first verified that the best-fit parameters were consistent between the two observations and successively we fitted tying all of them together. We obtained an intrinsic absorption of (5.2−1.2+1.3)×1020 cm−2, a disk black body temperature of 0.48 ± 0.03 keV, and a black body temperature of 1.47 ± 0.05 keV. The best-fit statics are χ2/d.o.f. = 609.66/651 and n.h.p. = 0.875. All values are consistent with the results of the phase-resolved spectroscopy of Rodríguez Castillo et al. (2020), but specifically, the black body temperatures are more consistent with the phases of minimum and raise/decay of the source.
We also noticed marginal evidence for excess residuals at about 1 keV during observation B (see Fig. 2, middle panel). Those residuals are common to ULXs and are interpreted as blended, unresolved spectral lines caused by disk outflows at fractions of the speed of light (see e.g. Middleton et al. 2015) thanks to their unambiguous identification in high-resolution X-ray spectra (see e.g. Pinto et al. 2016; Pinto & Walton 2023).
To check for significant spectral differences between different phases of the aperiodic modulation, we extracted the spectra in two different intensity intervals. We defined a “peak” phase whenever the background-subtracted count rate was higher than 0.2 and 0.07 counts s−1 in the PN and MOS1/2 camera, respectively, and a “no-peak” phase whenever the count rate was lower. We chose these values since they are a good match to the plateau which can be seen sometimes between a peak and the subsequent minimum in the light curve.
We fitted the spectra of the observations with the double-disk model used above, first individually and then together. The results of our fits are reported in Table 4. We found no significant difference in the spectral shape, with the best-fit parameters being consistent with each other within the error bars between the two phases. There is a systematic shift in the normalisations, especially in the soft disk component, albeit barely significant, but this is expected given the choice of the phases based on the count rate. We also computed the unabsorbed flux in the 0.3–10 keV band of the soft and hard disk components separately and in both the peak and no-peak phases. We derived Fpeaksoft = (1.77 ± 0.07)×10−13 erg cm−2 s−1 and Fno − peaksoft = (1.01 ± 0.03)×10−13 erg cm−2 s−1 for the soft disk in the two phases, while for the hard disk we derived Fpeakhard = (6.68 ± 0.16)×10−13 erg cm−2 s−1 and Fno − peakhard = (4.12 ± 0.07)×10−13 erg cm−2 s−1. Both components increase their flux in the peak phase of a factor ∼1.7, suggesting that the overall shape of the spectrum remains unaltered.
LP observations best-fit spectral parameters during peak/no-peak phases.
The spectral analysis of the archival observations showing the broad variability feature has been already performed by Earnshaw et al. (2016). Their results show that ULX-7 has always been detected at a super-Eddington luminosity (few 1039 erg s−1) in all those observations during which the broad feature in the PDS is detected. They also found that the spectrum of observation 0303420201 (the one showing the different type of variability) can be well described (χ2/d.o.f. = 172.3/182) by a single power-law component with spectral index Γ ≃ 1.45. The same model, when applied to observations A, B, and C, results in a worse reduced χ2 and structured residuals are visible, leading us to rule out the model. With the available data, however, we cannot assess a significant variation in the spectral state. We found that the spectrum in observation 0303420201 can be described equally well (χ2/d.o.f. = 166.9/179) by our double disk model, with parameters consistent with the ones found in observations A, B, and C. Moreover, other models (such as a blackbody plus power-law model) work equally well for observation 0303420201, suggesting that the statistics are not robust enough to favour one model over the others.
4. Discussion
The detection of a broad complex in the mHz-range of the PDSs of the 2021–2022 XMM-Newton observations marks ULX-7 as the second PULX showing QPOs at super-Eddington luminosities. Moreover, it is the first time this feature is detected in multiple observations over more than one month of baseline, suggesting that, when present, these QPOs are rather stable. By inspecting archival Chandra observations, spanning two weeks in 2012 (marked with a dagger in Table 1), we significantly (> 3σ) detected QPOs with similar properties. It is interesting to note that, even though the two epochs are separated by more than 10 years, the QPOs seem to show very little variation in both the centroid frequency and the fractional rms. Furthermore, observation 0303420201 is the only observation out of 25 during which a flat-top noise best describes the low-frequency variability centred at 0 Hz (see also Earnshaw et al. 2016). The flickering pattern shown by the light curve during this observation was recently noticed also by Kovačević et al. (2022), who suggested a quasi-periodic origin. However, with the available data, we cannot tell whether ULX-7 was observed in a different state or the difference in the PDS arises from the shorter length of the observation (36 ks, compared to our three 130 ks-long observations).
Feng et al. (2010) reported a similar (lack of) evolution in the QPO of M82 X-2. They detected a 3-mHz QPO in three different Chandra observations, performed in 2005, 2007, and 2008, respectively. For our discussion, we do not consider the two XMM-Newton observations analyzed by Feng et al. (2010) since, as already pointed out by the authors in their original work, XMM-Newton does not have the angular resolution needed to resolve M82 X-2 and M82 X-1 and contamination is always present. For the same reasons, caution is needed when interpreting the tentative detection of 8-mHz QPOs in M82 X-2 with XMM-Newton reported by Caballero-García et al. (2013). The centroid frequency νQPO, the FWHM Δν, and the fractional rms are all consistent with each other among the three Chandra observations analyzed by Feng et al. (2010). The presence of a mHz-QPO with little to no evolution among different epochs, therefore, might represent an interesting property of the PULXs when at super-Eddington luminosities. Given the small sample, we emphasize that at the moment this is only a (tantalizing) hypothesis, to be confirmed by searching for QPOs in other PULXs. To draw a comparison with other super-Eddington pulsars, the Galactic PULX Swift J0243.6+6124 shows QPOs at ≃30–40 mHz only when in the sub-Eddington regime (Wilson-Hodge et al. 2018; Chhotaray et al. 2024). This fact could indicate that PULXs consistently observed at super-Eddington luminosities (such as M82 X-2 and ULX-7) and PULXs showing shorter outbursts at these luminosity levels (such as Swift J0243.6+6124) behave differently.
Although we restricted our analysis to ULX-7 observations where QPOs have a significance > 3σ, it is worth mentioning that other Chandra and XMM-Newton observations show similar variability in both the light curves and the PDSs. The light curve of Chandra observation 354 shows two cycles of a modulation at ≃7620 s (Liu et al. 2002), later confirmed by Yoshida et al. (2010), while XMM-Newton observation 0112840201 shows a modulation at a different period (≃5900 s, Dewangan et al. 2005). Besides, Chandra observation 23474 shows 4 cycles of a 10-ks long modulation. In all these observations the significance of the modulation is below the 3σ threshold. For most of them, however, the low significance probably arises from the short length of the observations themselves (typically ≲50 ks), during which very few cycles of the modulation can be probed. 6 out of 8 observations where QPOs were significantly detected are longer than 100 ks.
4.1. Comparison with other sources and possible explanations
The flare-like activity shown in the three light curves of Fig. 1 is reminiscent of the heartbeat shown by 4XMM J111816.0–324910 (J1118, see Motta et al. 2020) and of the quasi-periodic “whispers” shown by 4XMM J140314.2+541806 (J1403, see Urquhart et al. 2022). Both sources are ULXs and they both show QPOs at super-Eddington luminosities, the former at a centroid frequency νQPO ≃ 0.4 mHz and the latter at νQPO ≃ 1.5 mHz, but neither of them are known to host a pulsar. In the case of J1118, the PDS showed a structured feature, composed of different peaks at 0.3–0.7 mHz, with a low-frequency shoulder at 0.2 mHz. The striking similarity with the heartbeat shown by the Galactic BH binary GRS 1915+105 (see the ρ class variability in Belloni et al. 2000) suggests that limit-cycle instability driven by Lightman-Eardley radiation pressure instability (Lightman & Eardley 1974) is the source of the modulation. For J1403 several models have been proposed to explain the QPOs: Lense-Thirring precession of an outflow from the inner regions of the disk (Middleton et al. 2019, M19 hereafter); marginally stable He burning from matter accreted on different regions of the surface of the NS (Heger et al. 2007); Lightman-Eardley instability again; beating between the NS spin frequency and the Keplerian frequency (νQPO = νorb − νspin) at the inner radius of a disk extending down to the magnetospheric radius Rm, smaller than the corotation radius Rco in order to accrete matter onto the NS. This last model was also proposed to explain the mHz-QPOs seen during super-Eddington flares of LMC X-4 (Moon & Eikenberry 2001). LMC X-4 is a high-mass X-ray binary (HMXB) that shows parameters similar to ULX-7, with a binary period ≈1.4 d, hosting a NS spinning with a period of ≈13.5 s, spin–up/–down phases at a rate up to |Ṗ| ≤ 10−10 s s−1, and a superorbital period ≈30.5 d (see Molkov et al. 2017; Moon & Eikenberry 2001; Urquhart et al. 2022, and references therein).
The Lightman-Eardley instability is hard to reconcile with the differences we see in ULX-7 with respect to J1118. ρ class variability is characterized by a more stable variability pattern than the one we see in the ULX-7 light curves. Besides, we do not see the expected spectral variation in the different phases of the modulation. Our spectral analysis of ULX-7 observations shows no clear evolution in the spectral parameters between the peaks and the valleys of the modulation, apart from a (barely significant) change in the absorption column nH, which is higher at the peak of the modulation. J1118, on the other hand, shows a clear evolution among the different phases of the modulation. A higher column density could be the sign of outflows/winds from a slim disk. The presence of winds in ULXs is well established (see e.g. Pinto et al. 2016; Pinto & Kosec 2023) and excess residuals at ≃1 keV during observation B can be interpreted as an unresolved wind (Middleton et al. 2015). Similar winds from slim disks are also observed in Galactic sources at (super-)Eddington luminosities, such as V404 Cyg (King et al. 2015; Motta et al. 2017). In this scenario, the flares would correspond to quasi-periodic phases where the disk is puffed up and launching the wind, while the out-of-flare emission corresponds to phases when the disk is thinner and not outflowing. This sort of quasi-periodic behaviour would explain the flaring we see in the light curve and the presence of a broad shoulder accompanying the QPOs. It could also explain why, compared with J1118, the flares are less regular and show a higher degree of diversity among different cycles. A similar scenario was invoked to explain the quasi-periodic dipping observed on 5–10 ks timescales (matching our findings) in the soft/supersoft source NGC 247 ULX-1 (Alston et al. 2021).
Theoretical works on He burning models predicts higher QPOs frequencies (∼10 mHz) and a higher rms at lower energies, which we do not detect. Therefore, we will not discuss this possibility any further. Two possible alternative scenarios for the observed QPOs remain to be discussed: Lense-Thirring precession (M19) and the beat frequency model (BFM; see e.g. Lamb et al. 1985; Angelini et al. 1989). We first need to compute magnetospheric and corotation radius for ULX-7:
 (2)
(2)
 (3)
(3)
where P is the spin period of ULX-7 in seconds, B12 its magnetic dipolar field strength in units of 1012 G, L39 its luminosity in units of 1039 erg s−1, R6 its radius in units of 106 cm, and M1.4 its mass in units of 1.4 M⊙. ξ is a parameter that takes into account the geometry of the accretion flow and in the case of an accretion disk is ≈0.5 (Ghosh & Lamb 1979; Wang 1987; Campana et al. 2018). From our spectral analysis, we know that the 0.3–10 keV luminosity of ULX-7 is LX ≃ 5.3 × 1039 erg s−1. We assume for the radius and mass R6 ≃ M1.4 ≃ 1, which are considered typical values for a NS, and for the spin period P ≈ 2.78 s. If we plug these values into Eq. (3), we obtain Rco ≃ 3.3 × 108 cm. In the BFM, a QPO frequency of νQPO ≈ 1 mHz would correspond to a disk (truncated by the magnetosphere) whose inner radius Rin is only slightly smaller than Rco. For simplicity, we can assume Rm ≈ Rin ≈ Rco. From Eq. (2), we derive a magnetic dipolar field B ≃ 1.3 × 10¹⁴ G, inconsistent with previous estimates (1012 G ≲ B ≲ 1013 G, see Rodríguez Castillo et al. 2020). Another problem with the BFM scenario is that with Rm ≈ Rco we would expect frequent drops in the X-ray luminosity (which we do not detect in ULX-7), since even a small fluctuation in the accretion rate would lead to Rm > Rco and therefore to the propeller regime. Additionally, a disk’s inner radius so close to the corotation radius would require a high level of fine-tuning.
For the Lense-Thirring scenario, on the other hand, we follow M19, particularly the values reported in their Table 1. In their work, the mHz-QPOs originated from a precessing inflow with period Pinflow and they can be linked with the period of a precessing wind Pwind. The latter is set equal to the superorbital period we observe in various PULXs, including ULX-7, which shows a superorbital period of ≈44 d (Brightman et al. 2022). We can scale the values reported in the first two columns of Table 1 of M19 by the observed superorbital period. By doing so, we find that the frequencies we observe for ULX-7 are consistent with the ones expected for a NS-ULX with a high fraction of energy dissipated to launch the winds (ϵ = 0.95 case). ULX-7’s QPO frequency could therefore arise from Lense-Thirring precession of the inner accretion flow. The detection of winds from ULX-7 with a precessing period equal to the superorbital period could further strengthen the hypothesis, particularly if they show up mainly during the observations with QPOs rather than pulsations detected.
Problems with this interpretation arise once we consider the temperature of the cold component of the disk (Tsph in M19) and the Pwind/Pinflow ratio. According to M19, the two quantities can help constrain the magnetic field of the accreting NS powering the PULX (see Fig. 2 in their work). In brief, given Tsph, the higher Pwind/Pinflow, the lower the magnetic field (see orange curve in Fig. 2 of M19). With Tsph = kTsoft ≃ 0.3 keV (from the spectral analysis of observations B and C) and Pwind/Pinflow ≃ 3800 (assuming Pwind ≃ 44 d and Pinflow ≃ 1 ks), ULX-7 would have an unrealistically low magnetic field B ≪ 109 G. Whilst it is difficult to reconcile such a low field strength with the fact that we see pulsations from the NS, Pwind/Pinflow is highly sensitive to assumed parameters related to the wind-launching (Middleton et al. 2018, 2019) which may yet permit higher field strengths as a solution.
4.2. QPOs and pulsed fraction of the spin signal
One interesting feature of the 2021–2022 XMM-Newton observations is the non-detection of ULX-7 2.8-s spin pulsations. For this part of the discussion, we will only consider XMM-Newton observations, since Chandra time resolution (3.14 s in the analysed observations) is not good enough to detect the ULX-7 spin signal. PULXs are known to show transient pulsations, even within the same observation (see e.g. Bachetti et al. 2020, and observation B in Fig. 4 of Rodríguez Castillo et al. 2020). Nevertheless, our analysis did not detect the spin pulsations in any intervals of the three observations. Given the high spin derivative Ṗ typical of PULXs, which can change from observation to observation, we could only compute the 3σ upper limit on the PF considering the single observations. The single-trial value we derived of ≃6% is consistent with the minimum PF detected in 2018 by Rodríguez Castillo et al. (2020), suggesting that, if present, we should have detected the spin pulsations. One could argue that the lack of pulsations may be due to the source being in a different spectral state. The 2021–2022 XMM-Newton observations were all performed at the peak of the super-orbital modulation and our spectral analysis in Sect. 3.2 confirms that we observed ULX-7 in a similar state to the 2018 XMM-Newton campaign. All the spectral parameters are consistent between the two epochs, with only a 6% difference in the 0.3–10 keV observed luminosity (with respect to 2018 pointing A having a similar flux level). Interestingly, the only difference between the two sets of observations is the presence of the QPOs in 2021–2022. In 2018 the PDSs showed no significant features at the mHz-range. Moreover, after comparison with Table 1 of Rodríguez Castillo et al. (2020), we conclude that the QPOs are not present in any of the XMM-Newton observations in which the spin pulsations were detected; vice versa, when the QPOs were detected, we do not detect the spin signal. We therefore suggest that, whatever mechanism is responsible for the QPOs, is also responsible for a significant decrease in the pulsed fraction of the spin pulsations, but at the same time does not produce a significant change in the spectral state of the source.
The detection of mHz-QPOs in both M82 X-2 and ULX-7 has profound implications for the ULX population as a whole. First of all, it demonstrates that this feature is not exclusive to BH-powered ULXs. The derivation of the mass of the accreting BH from the frequency of the QPOs, therefore, must be treated with extreme caution. Heil et al. (2009) already pointed out that, if the ULX state is different from the sub-Eddington accretion state, mass estimates from the QPO frequencies and PDS features are unreliable. Similarly, Poutanen et al. (2007) had noted that QPOs at mHz-range are also known for Galactic BHs like Cygnus X-1 (Vikhlinin et al. 1994) and GRS 1915+105 (Morgan et al. 1997), weakening the association of mHz-QPOs in ULXs with type-C QPOs. Lastly, Middleton et al. (2011) reanalysed XMM-Newton observations of NGC 5408 X-1 (one of the ULXs showing mHz-QPOs) and demonstrated that both timing and spectral analysis do not support the IMBH scenario proposed by Strohmayer et al. (2007). Nevertheless, even after these works and the discovery of PULXs, the vast majority of works on ULXs showing QPOs assumes (IM)BH accretors (see e.g. Atapin et al. 2019; Majumder et al. 2023, and references therein).
If QPOs are indeed a PULX signature, they might represent an additional element to single out a candidate PULXs. It is interesting to note, for example, that among the ULXs showing QPOs, there is also IC 342 X-1 (Agrawal & Nandi 2015), later identified as a PULX candidate by Pintore et al. (2017) based on its hard energy spectrum. Another ULX that shows a similar combination is M74 X-1, with flaring activity in the light curve, high variability among different observations, and mHz-QPOs in the PDS (Krauss et al. 2005). The downside is that, apparently, the presence of the QPOs is concurrent with a significant decrease in the pulsed fraction of the spin pulsations. The detection of the spin signal from a PULX is notoriously a difficult task, often involving the use of accelerated search techniques to compensate for the PDS loss of power (at the spin frequency) caused by the huge spin-up of these sources together with orbital Doppler effects (see e.g. the analysis and discussion in Rodríguez Castillo et al. 2020). A QPO could further hinder the process of detecting spin signals.
5. Conclusions
We have reported on the discovery of persistent QPOs in the mHz-range in three XMM-Newton observations of M51 ULX-7 performed in 2021–2022. Concurrently, we did not detect the 2.8 s-long spin signal, with a 3σ upper limit on the pulsed fraction PF ≲ 10%. These findings represent the second time QPOs are detected in a PULX at super-Eddington luminosities, the first being M82 X-2. We searched for other occurrences of the mHz-feature in M51 ULX-7 archival observations of XMM-Newton, Chandra, and NuSTAR and found other 5 Chandra observations during which the mHz-feature is significantly (> 3σ) detected. Our spectral analysis of the 2021–2022 XMM-Newton observations shows that the source was observed in a similar state with respect to the 2018 XMM-Newton observations when the spin pulsations were first detected (Rodríguez Castillo et al. 2020).
We considered different models proposed to explain similar variability patterns in other ULXs. A disk puffing up and launching winds with a quasi-periodic recurrence could explain the flaring-like light curve and the broad feature in the PDS. Another viable explanations for the mHz-QPOs is Lense-Thirring precession of an outflow from the inner regions of the disk. We note, however, that the latter need a high level of fine-tuning in the case of M51 ULX-7. Regardless of the correct scenario, the detection of mHz-QPOs from both M82 X-2 and M51 ULX-7 further confirms that one should avoid constraining the mass of the accretor in the ULX from the observed QPO frequency. The QPOs from both PULXs show little to no evolution in different epochs: more detections from other PULXs are needed to confirm that this is a properties of PULXs at super-Eddington luminosities.
In conclusion, we suggest that the presence of mHz-QPOs might also be a common feature of PULXs. However, the drop of the pulsed fraction when QPOs are present further complicates the detection of spin pulsations. This could also mean that the fraction of PULXs over the whole ULX population could be even higher than estimated and that the phenomenology of PULXs is more complex than previously thought. New observations targeting known as well as candidate PULXs will help us better understanding these new phenomena and testing our hypothesis.
Acknowledgments
We thank the anonymous referee for the useful comments. This study is based on observations obtained with XMM–Newton, a European Space Agency (ESA) science mission with instruments and contributions directly funded by ESA Member States and National Aeronautics and Space Administration (NASA). The scientific results reported in this article are based in part on data obtained from the Chandra Data Archive and observations made by the Chandra X-ray Observatory and published previously in cited articles. MI is supported by the AASS Ph.D. joint research programme between the University of Rome “Sapienza” and the University of Rome “Tor Vergata”, with the collaboration of the National Institute of Astrophysics (INAF). GLI acknowledges financial support from the Italian Ministry for University and Research, through grant 2017LJ39LM (UNIAM). CS acknowledges funding from the Italian Space Agency, contract ASI/INAF n. I/004/11/4. RA and GLI acknowledge financial support from INAF through grant “INAF-Astronomy Fellowships in Italy 2022 - (GOG)”. GLI, GARC, CP, FP, AT, AW, and PE acknowledge support from PRIN MUR SEAWIND (2022Y2T94C) funded by NextGenerationEU and INAF Grant BLOSSOM. TPR acknowledges support from STFC as part of the consolidated grant ST/X001075/1. DJW also acknowledges support from STFC (individual grant ST/Y001060/1).
References
- Agrawal, V. K., & Nandi, A. 2015, MNRAS, 446, 3926 [NASA ADS] [CrossRef] [Google Scholar]
- Alston, W. N., Pinto, C., Barret, D., et al. 2021, MNRAS, 505, 3722 [NASA ADS] [CrossRef] [Google Scholar]
- Angelini, L., Stella, L., & Parmar, A. N. 1989, ApJ, 346, 906 [NASA ADS] [CrossRef] [Google Scholar]
- Arnaud, K. A. 1996, ASP Conf. Ser., 101, 17 [Google Scholar]
- Atapin, K., Fabrika, S., & Caballero-García, M. D. 2019, MNRAS, 486, 2766 [NASA ADS] [CrossRef] [Google Scholar]
- Bachetti, M., Harrison, F. A., Walton, D. J., et al. 2014, Nature, 514, 202 [NASA ADS] [CrossRef] [Google Scholar]
- Bachetti, M., Maccarone, T. J., Brightman, M., et al. 2020, ApJ, 891, 44 [Google Scholar]
- Bachetti, M., Heida, M., Maccarone, T., et al. 2022, ApJ, 937, 125 [NASA ADS] [CrossRef] [Google Scholar]
- Belfiore, A., Salvaterra, R., Sidoli, L., et al. 2024, ApJ, 965, 78 [NASA ADS] [CrossRef] [Google Scholar]
- Belloni, T., & Hasinger, G. 1990, A&A, 227, L33 [NASA ADS] [Google Scholar]
- Belloni, T., Klein-Wolt, M., Méndez, M., van der Klis, M., & van Paradijs, J. 2000, A&A, 355, 271 [Google Scholar]
- Brightman, M., Earnshaw, H., Fürst, F., et al. 2020, ApJ, 895, 127 [Google Scholar]
- Brightman, M., Bachetti, M., Earnshaw, H., et al. 2022, ApJ, 925, 18 [NASA ADS] [CrossRef] [Google Scholar]
- Caballero-García, M. D., Belloni, T., & Zampieri, L. 2013, MNRAS, 436, 3262 [CrossRef] [Google Scholar]
- Campana, S., Stella, L., Mereghetti, S., & de Martino, D. 2018, A&A, 610, A46 [NASA ADS] [CrossRef] [EDP Sciences] [Google Scholar]
- Carpano, S., Haberl, F., Maitra, C., & Vasilopoulos, G. 2018, MNRAS, 476, L45 [NASA ADS] [CrossRef] [Google Scholar]
- Casella, P., Belloni, T., & Stella, L. 2005, ApJ, 629, 403 [Google Scholar]
- Casella, P., Ponti, G., Patruno, A., et al. 2008, MNRAS, 387, 1707 [NASA ADS] [CrossRef] [Google Scholar]
- Chhotaray, B., Jaisawal, G. K., Nandi, P., et al. 2024, ApJ, 963, 132 [CrossRef] [Google Scholar]
- Colbert, E. J. M., & Mushotzky, R. F. 1999, ApJ, 519, 89 [NASA ADS] [CrossRef] [Google Scholar]
- Dewangan, G. C., Griffiths, R. E., Choudhury, M., Miyaji, T., & Schurch, N. J. 2005, ApJ, 635, 198 [NASA ADS] [CrossRef] [Google Scholar]
- Earnshaw, H. M., Roberts, T. P., Heil, L. M., et al. 2016, MNRAS, 456, 3840 [NASA ADS] [CrossRef] [Google Scholar]
- Fabbiano, G. 1989, ARA&A, 27, 87 [NASA ADS] [CrossRef] [Google Scholar]
- Fabrika, S. N., Atapin, K. E., Vinokurov, A. S., & Sholukhova, O. N. 2021, Astrophys. Bull., 76, 6 [NASA ADS] [CrossRef] [Google Scholar]
- Feng, H., Rao, F., & Kaaret, P. 2010, ApJ, 710, L137 [CrossRef] [Google Scholar]
- Fruscione, A., McDowell, J. C., Allen, G. E., et al. 2006, SPIE Conf. Ser., 6270, 62701V [Google Scholar]
- Fürst, F., Walton, D. J., Harrison, F. A., et al. 2016, ApJ, 831, L14 [Google Scholar]
- Fürst, F., Walton, D. J., Heida, M., et al. 2018, A&A, 616, A186 [Google Scholar]
- Fürst, F., Walton, D. J., Heida, M., et al. 2021, A&A, 651, A75 [NASA ADS] [CrossRef] [EDP Sciences] [Google Scholar]
- Gabriel, C., Denby, M., Fyfe, D. J., et al. 2004, ASP Conf. Ser., 314, 759 [Google Scholar]
- Ghosh, P., & Lamb, F. K. 1979, ApJ, 234, 296 [Google Scholar]
- Gúrpide, A., Godet, O., Koliopanos, F., Webb, N., & Olive, J. F. 2021, A&A, 649, A104 [NASA ADS] [CrossRef] [EDP Sciences] [Google Scholar]
- Harrison, F. A., Craig, W. W., Christensen, F. E., et al. 2013, ApJ, 770, 103 [Google Scholar]
- Heger, A., Cumming, A., & Woosley, S. E. 2007, ApJ, 665, 1311 [NASA ADS] [CrossRef] [Google Scholar]
- Heil, L. M., Vaughan, S., & Roberts, T. P. 2009, MNRAS, 397, 1061 [CrossRef] [Google Scholar]
- HI4PI Collaboration (Ben Bekhti, N. et al.) 2016, A&A, 594, A116 [NASA ADS] [CrossRef] [EDP Sciences] [Google Scholar]
- Hu, C.-P., Ueda, Y., & Enoto, T. 2021, ApJ, 909, 5 [NASA ADS] [CrossRef] [Google Scholar]
- Ingram, A. R., & Motta, S. E. 2019, New A Rev., 85, 101524 [NASA ADS] [CrossRef] [Google Scholar]
- Israel, G. L., & Stella, L. 1996, ApJ, 468, 369 [Google Scholar]
- Israel, G. L., Belfiore, A., Stella, L., et al. 2017a, Science, 355, 817 [NASA ADS] [CrossRef] [Google Scholar]
- Israel, G. L., Papitto, A., Esposito, P., et al. 2017b, MNRAS, 466, L48 [NASA ADS] [CrossRef] [Google Scholar]
- Jansen, F., Lumb, D., Altieri, B., et al. 2001, A&A, 365, L1 [NASA ADS] [CrossRef] [EDP Sciences] [Google Scholar]
- Kaaret, P., Feng, H., & Roberts, T. P. 2017, ARA&A, 55, 303 [Google Scholar]
- King, A. R., Davies, M. B., Ward, M. J., Fabbiano, G., & Elvis, M. 2001, ApJ, 552, L109 [NASA ADS] [CrossRef] [Google Scholar]
- King, A. L., Miller, J. M., Raymond, J., Reynolds, M. T., & Morningstar, W. 2015, ApJ, 813, L37 [NASA ADS] [CrossRef] [Google Scholar]
- King, A., Lasota, J. P., & Middleton, M. 2023, New A Rev., 96, 101672 [NASA ADS] [CrossRef] [Google Scholar]
- Koliopanos, F., Vasilopoulos, G., Godet, O., et al. 2017, A&A, 608, A47 [NASA ADS] [CrossRef] [EDP Sciences] [Google Scholar]
- Kovačević, M., Pasquato, M., Marelli, M., et al. 2022, A&A, 659, A66 [NASA ADS] [CrossRef] [EDP Sciences] [Google Scholar]
- Krauss, M. I., Kilgard, R. E., Garcia, M. R., Roberts, T. P., & Prestwich, A. H. 2005, ApJ, 630, 228 [CrossRef] [Google Scholar]
- Kuntz, K. D., Long, K. S., & Kilgard, R. E. 2016, ApJ, 827, 46 [Google Scholar]
- Lamb, F. K., Shibazaki, N., Alpar, M. A., & Shaham, J. 1985, Nature, 317, 681 [NASA ADS] [CrossRef] [Google Scholar]
- Leahy, D. A., Elsner, R. F., & Weisskopf, M. C. 1983, ApJ, 272, 256 [Google Scholar]
- Lightman, A. P., & Eardley, D. M. 1974, ApJ, 187, L1 [Google Scholar]
- Lin, L. C.-C., Hu, C.-P., Kong, A. K. H., et al. 2015, MNRAS, 454, 1644 [NASA ADS] [CrossRef] [Google Scholar]
- Liu, J.-F., Bregman, J. N., Irwin, J., & Seitzer, P. 2002, ApJ, 581, L93 [NASA ADS] [CrossRef] [Google Scholar]
- Majumder, S., Das, S., Agrawal, V. K., & Nandi, A. 2023, MNRAS, 526, 2086 [Google Scholar]
- McQuinn, K. B. W., Skillman, E. D., Dolphin, A. E., Berg, D., & Kennicutt, R. 2016, ApJ, 826, 21 [NASA ADS] [CrossRef] [Google Scholar]
- Middleton, M. J., Roberts, T. P., Done, C., & Jackson, F. E. 2011, MNRAS, 411, 644 [NASA ADS] [CrossRef] [Google Scholar]
- Middleton, M. J., Walton, D. J., Fabian, A., et al. 2015, MNRAS, 454, 3134 [Google Scholar]
- Middleton, M. J., Fragile, P. C., Bachetti, M., et al. 2018, MNRAS, 475, 154 [NASA ADS] [CrossRef] [Google Scholar]
- Middleton, M. J., Fragile, P. C., Ingram, A., & Roberts, T. P. 2019, MNRAS, 489, 282 [NASA ADS] [CrossRef] [Google Scholar]
- Mitsuda, K., Inoue, H., Koyama, K., et al. 1984, PASJ, 36, 741 [NASA ADS] [Google Scholar]
- Molkov, S., Lutovinov, A., Falanga, M., Tsygankov, S., & Bozzo, E. 2017, MNRAS, 464, 2039 [NASA ADS] [CrossRef] [Google Scholar]
- Moon, D.-S., & Eikenberry, S. S. 2001, ApJ, 549, L225 [NASA ADS] [CrossRef] [Google Scholar]
- Morgan, E. H., Remillard, R. A., & Greiner, J. 1997, ApJ, 482, 993 [NASA ADS] [CrossRef] [Google Scholar]
- Motta, S. E., Casella, P., Henze, M., et al. 2015, MNRAS, 447, 2059 [NASA ADS] [CrossRef] [Google Scholar]
- Motta, S. E., Kajava, J. J. E., Sánchez-Fernández, C., et al. 2017, MNRAS, 471, 1797 [NASA ADS] [CrossRef] [Google Scholar]
- Motta, S. E., Marelli, M., Pintore, F., et al. 2020, ApJ, 898, 174 [NASA ADS] [CrossRef] [Google Scholar]
- Nichols, J. S., Henden, A. A., Huenemoerder, D. P., et al. 2010, ApJS, 188, 473 [Google Scholar]
- Pasham, D. R., Cenko, S. B., Zoghbi, A., et al. 2015, ApJ, 811, L11 [NASA ADS] [CrossRef] [Google Scholar]
- Pinto, C., & Kosec, P. 2023, Astron. Nachr., 344, e20220134 [NASA ADS] [Google Scholar]
- Pinto, C., & Walton, D. J. 2023, ArXiv e-prints [arXiv:2302.00006] [Google Scholar]
- Pinto, C., Middleton, M. J., & Fabian, A. C. 2016, Nature, 533, 64 [Google Scholar]
- Pintore, F., Zampieri, L., Stella, L., et al. 2017, ApJ, 836, 113 [Google Scholar]
- Poutanen, J., Lipunova, G., Fabrika, S., Butkevich, A. G., & Abolmasov, P. 2007, MNRAS, 377, 1187 [NASA ADS] [CrossRef] [Google Scholar]
- Protassov, R., van Dyk, D. A., Connors, A., Kashyap, V. L., & Siemiginowska, A. 2002, ApJ, 571, 545 [NASA ADS] [CrossRef] [Google Scholar]
- Rodríguez Castillo, G. A., Israel, G. L., Belfiore, A., et al. 2020, ApJ, 895, 60 [Google Scholar]
- Sathyaprakash, R., Roberts, T. P., Walton, D. J., et al. 2019, MNRAS, 488, L35 [NASA ADS] [CrossRef] [Google Scholar]
- Stella, L., & Angelini, L. 1992, ASP Conf. Ser., 25, 103 [NASA ADS] [Google Scholar]
- Strohmayer, T. E., Mushotzky, R. F., Winter, L., et al. 2007, ApJ, 660, 580 [NASA ADS] [CrossRef] [Google Scholar]
- Strohmayer, T. E., & Mushotzky, R. F. 2009, ApJ, 703, 1386 [NASA ADS] [CrossRef] [Google Scholar]
- Strüder, L., Briel, U., Dennerl, K., et al. 2001, A&A, 365, L18 [Google Scholar]
- Tranin, H., Webb, N., Godet, O., & Quintin, E. 2024, A&A, 681, A16 [NASA ADS] [CrossRef] [EDP Sciences] [Google Scholar]
- Turner, M. J. L., Abbey, A., Arnaud, M., et al. 2001, A&A, 365, L27 [CrossRef] [EDP Sciences] [Google Scholar]
- Urquhart, R. T., Soria, R., Di Stefano, R., et al. 2022, MNRAS, 511, 4528 [CrossRef] [Google Scholar]
- van der Klis, M. 1989, NATO ASI Ser. C, 262, 27 [NASA ADS] [Google Scholar]
- Vasilopoulos, G., Lander, S. K., Koliopanos, F., & Bailyn, C. D. 2020, MNRAS, 491, 4949 [Google Scholar]
- Vasilopoulos, G., Koliopanos, F., Haberl, F., et al. 2021, ApJ, 909, 50 [Google Scholar]
- Verner, D. A., Ferland, G. J., Korista, K. T., & Yakovlev, D. G. 1996, ApJ, 465, 487 [Google Scholar]
- Vikhlinin, A., Churazov, E., Gilfanov, M., et al. 1994, ApJ, 424, 395 [NASA ADS] [CrossRef] [Google Scholar]
- Walton, D. J., Fürst, F., Heida, M., et al. 2018, ApJ, 856, 128 [NASA ADS] [CrossRef] [Google Scholar]
- Walton, D. J., Mackenzie, A. D. A., Gully, H., et al. 2022, MNRAS, 509, 1587 [Google Scholar]
- Wang, Y. M. 1987, A&A, 183, 257 [Google Scholar]
- Weisskopf, M. C., Tananbaum, H. D., Van Speybroeck, L. P., & O’Dell, S. L. 2000, SPIE Conf. Ser., 4012, 2 [Google Scholar]
- Weng, S.-S., & Feng, H. 2018, ApJ, 853, 115 [Google Scholar]
- Wilms, J., Allen, A., & McCray, R. 2000, ApJ, 542, 914 [Google Scholar]
- Wilson-Hodge, C. A., Malacaria, C., Jenke, P. A., et al. 2018, ApJ, 863, 9 [Google Scholar]
- Yoshida, T., Ebisawa, K., Matsushita, K., Tsujimoto, M., & Kawaguchi, T. 2010, ApJ, 722, 760 [NASA ADS] [CrossRef] [Google Scholar]
- Zampieri, L., & Roberts, T. P. 2009, MNRAS, 400, 677 [NASA ADS] [CrossRef] [Google Scholar]
Appendix A: Timing analysis of Chandra observations
We followed the same steps described in Sect. 3.1 for the timing analysis of the archival Chandra observations. We summarise here the main points, for the ease of the discussion.
We computed the 0.5–10 keV PDSs with the XRONOS task powspec. We used a bin time of 3.14 s, equal to Chandra time resolution, and close to the 5 s bin time used for the XMM-Newton observations. We adopted a logarithmic rebin factor of 1.20 for the three longer observations (ObsIDs 13813, 13812, and 13814). The two shorter observations (ObsIDs 15496 and 13815) needed a logarithmic rebin factor of 1.30 for a better fit due to poorer statistics. This is probably a consequence of the shorter exposure times.
We converted the PDSs in XSPEC format. We found that a single Lorentzian was sufficient for a good fit of the (sub-)mHz feature in the Chandra PDSs. To model the whole PDSs, we considered again a constant and a power-law component to account for the white and red noise, respectively. The final model used to fit the Chandra PDSs is described by the following equation:
 (A.1)
(A.1)
where P(ν) is the power P at the frequency ν, the first two terms on the right-hand side describe the white and red noise, respectively, and the last term is the Lorentzian. ν0 is the centroid frequency and Δν its full width at half maximum. The only difference from Equation (1) is the absence of the summation term, as we are considering just one Lorentzian component instead of two.
We found that the white-noise constant and the red-noise, power-law index values are consistent with the ones expected using the Leahy normalization (constWN = 2, −2 < ΓRN < −1, see van der Klis 1989). For observations 15496 and 13812, the fit does not require the power-law component and the continuum of the PDS can be described by the white-noise component only.
We report the results of our fits in Tab. A.1. The broad-feature parameters show little to no evolution between the Chandra and the XMM-Newton observations (Tab. 2). However, while in the longer observations those parameters are more similar to those found for the broad component, in the two shorter observations (ObsIDs 15496 and 13815) the centroid frequencies are closer to those shown by the QPO at 0.5 mHz. Nevertheless, with the available data, we could not tell if this difference is due to an evolution of the feature itself or the intrinsic resolutions of the respective PDSs.
Best-fit parameters for the Chandra PDSs showing the broad feature.
All Tables
All Figures
|
Fig. 1. PN+MOS light curve of ULX-7 in the 0.3–10 keV band in the three observations of our LP (bin time of 100 s). Each column corresponds to a different observation, while each row shows 32 ks-long chunks of the corresponding observation. From left to right: observations A, B, C. |
| In the text | |
|
Fig. 2. Energy spectra of ULX-7. Top panel: simultaneous fit of the two PN+MOS spectra from observations B (blue) and C (orange) with the double-disk model. Bottom panels: residuals of the fit in units of standard deviation. Spectra of each colour include PN, MOS1 and MOS2 data (not summed) from the same observation. |
| In the text | |
|
Fig. 3. PDSs in the 0.3–10 keV band of the LP observations A (left), B (centre), C (right). Panel a: PDS with the components used for the fit. Panel b: residuals of the model without the second Lorentzian. Panel c: residuals of the final model with two Lorentzians. For each observation, we combined data from both PN and MOS cameras. The PDSs are computed using the Leahy normalization. The model we used to fit the PDSs is described by Equation (1). |
| In the text | |
|
Fig. 4. Long-term evolution of the broad complex parameters. Top panel: evolution of the centroid frequency ν. Bottom panel: evolution of the fractional rms. Cross markers represent the values for the broad feature in Chandra data, while blue circles and orange squares represent the values for the broad feature and the candidate QPO, respectively, in the latest XMM-Newton observations. For Chandra we considered events in the 0.5–10 keV band, while for XMM-Newton events in the 0.3–10 keV band. |
| In the text | |
|
Fig. 5. Timing analysis of XMM-Newton observation 0303420201. Top figure: PN+MOS light curve of ULX-7. The bin time is 100 s, as in the three LP light curves. Bottom figure: ULX-7 PDS in the 0.3–10 keV band (top panel) and residuals of the white noise plus single Lorentzian model used for this observation (bottom panel). We combined data from PN and MOS cameras. The PDS is computed using the Leahy normalization. |
| In the text | |
Current usage metrics show cumulative count of Article Views (full-text article views including HTML views, PDF and ePub downloads, according to the available data) and Abstracts Views on Vision4Press platform.
Data correspond to usage on the plateform after 2015. The current usage metrics is available 48-96 hours after online publication and is updated daily on week days.
Initial download of the metrics may take a while.