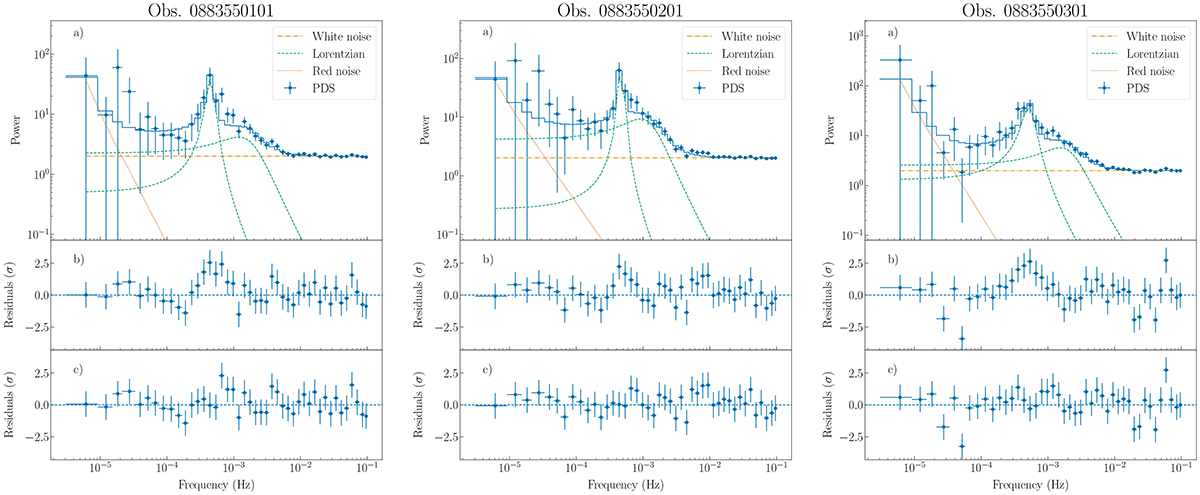
Fig. 3.
Download original image
PDSs in the 0.3–10 keV band of the LP observations A (left), B (centre), C (right). Panel a: PDS with the components used for the fit. Panel b: residuals of the model without the second Lorentzian. Panel c: residuals of the final model with two Lorentzians. For each observation, we combined data from both PN and MOS cameras. The PDSs are computed using the Leahy normalization. The model we used to fit the PDSs is described by Equation (1).
Current usage metrics show cumulative count of Article Views (full-text article views including HTML views, PDF and ePub downloads, according to the available data) and Abstracts Views on Vision4Press platform.
Data correspond to usage on the plateform after 2015. The current usage metrics is available 48-96 hours after online publication and is updated daily on week days.
Initial download of the metrics may take a while.