Open Access
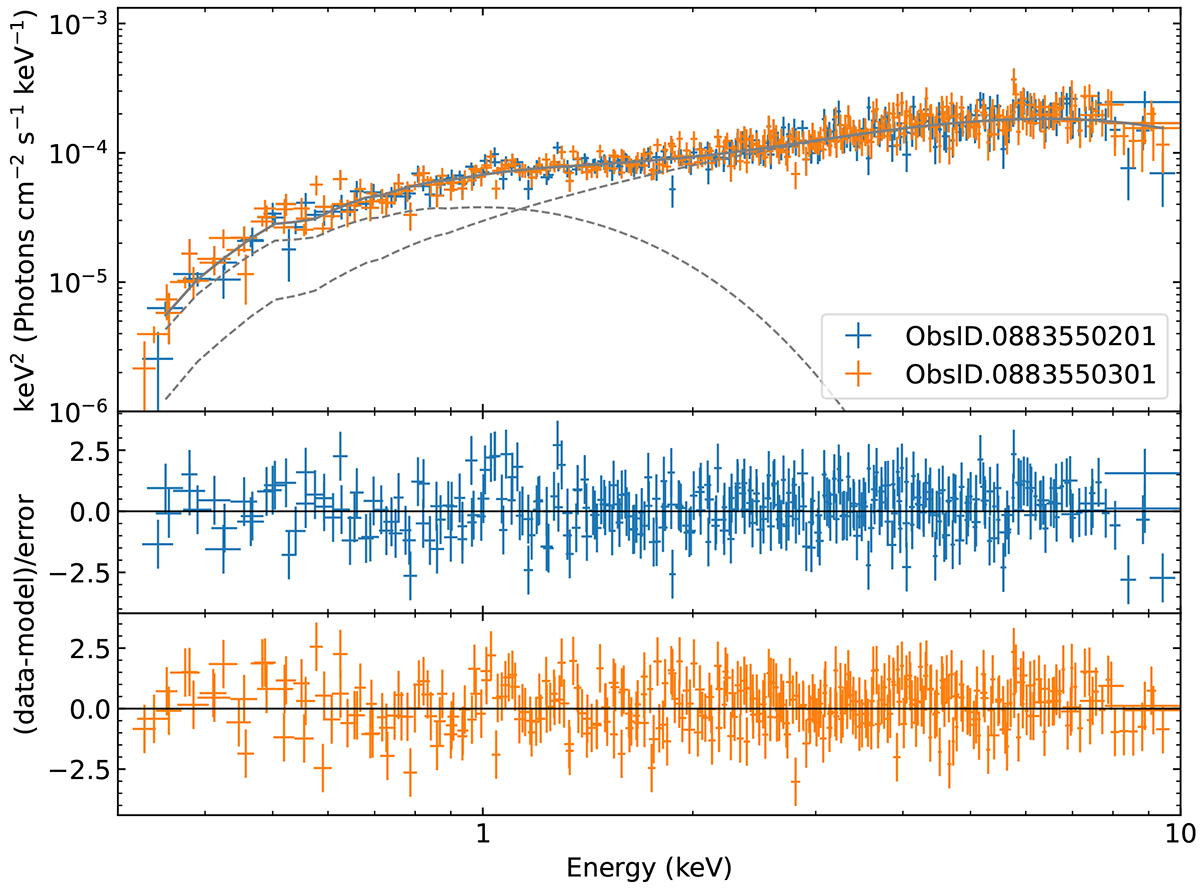
Fig. 2.
Download original image
Energy spectra of ULX-7. Top panel: simultaneous fit of the two PN+MOS spectra from observations B (blue) and C (orange) with the double-disk model. Bottom panels: residuals of the fit in units of standard deviation. Spectra of each colour include PN, MOS1 and MOS2 data (not summed) from the same observation.
Current usage metrics show cumulative count of Article Views (full-text article views including HTML views, PDF and ePub downloads, according to the available data) and Abstracts Views on Vision4Press platform.
Data correspond to usage on the plateform after 2015. The current usage metrics is available 48-96 hours after online publication and is updated daily on week days.
Initial download of the metrics may take a while.