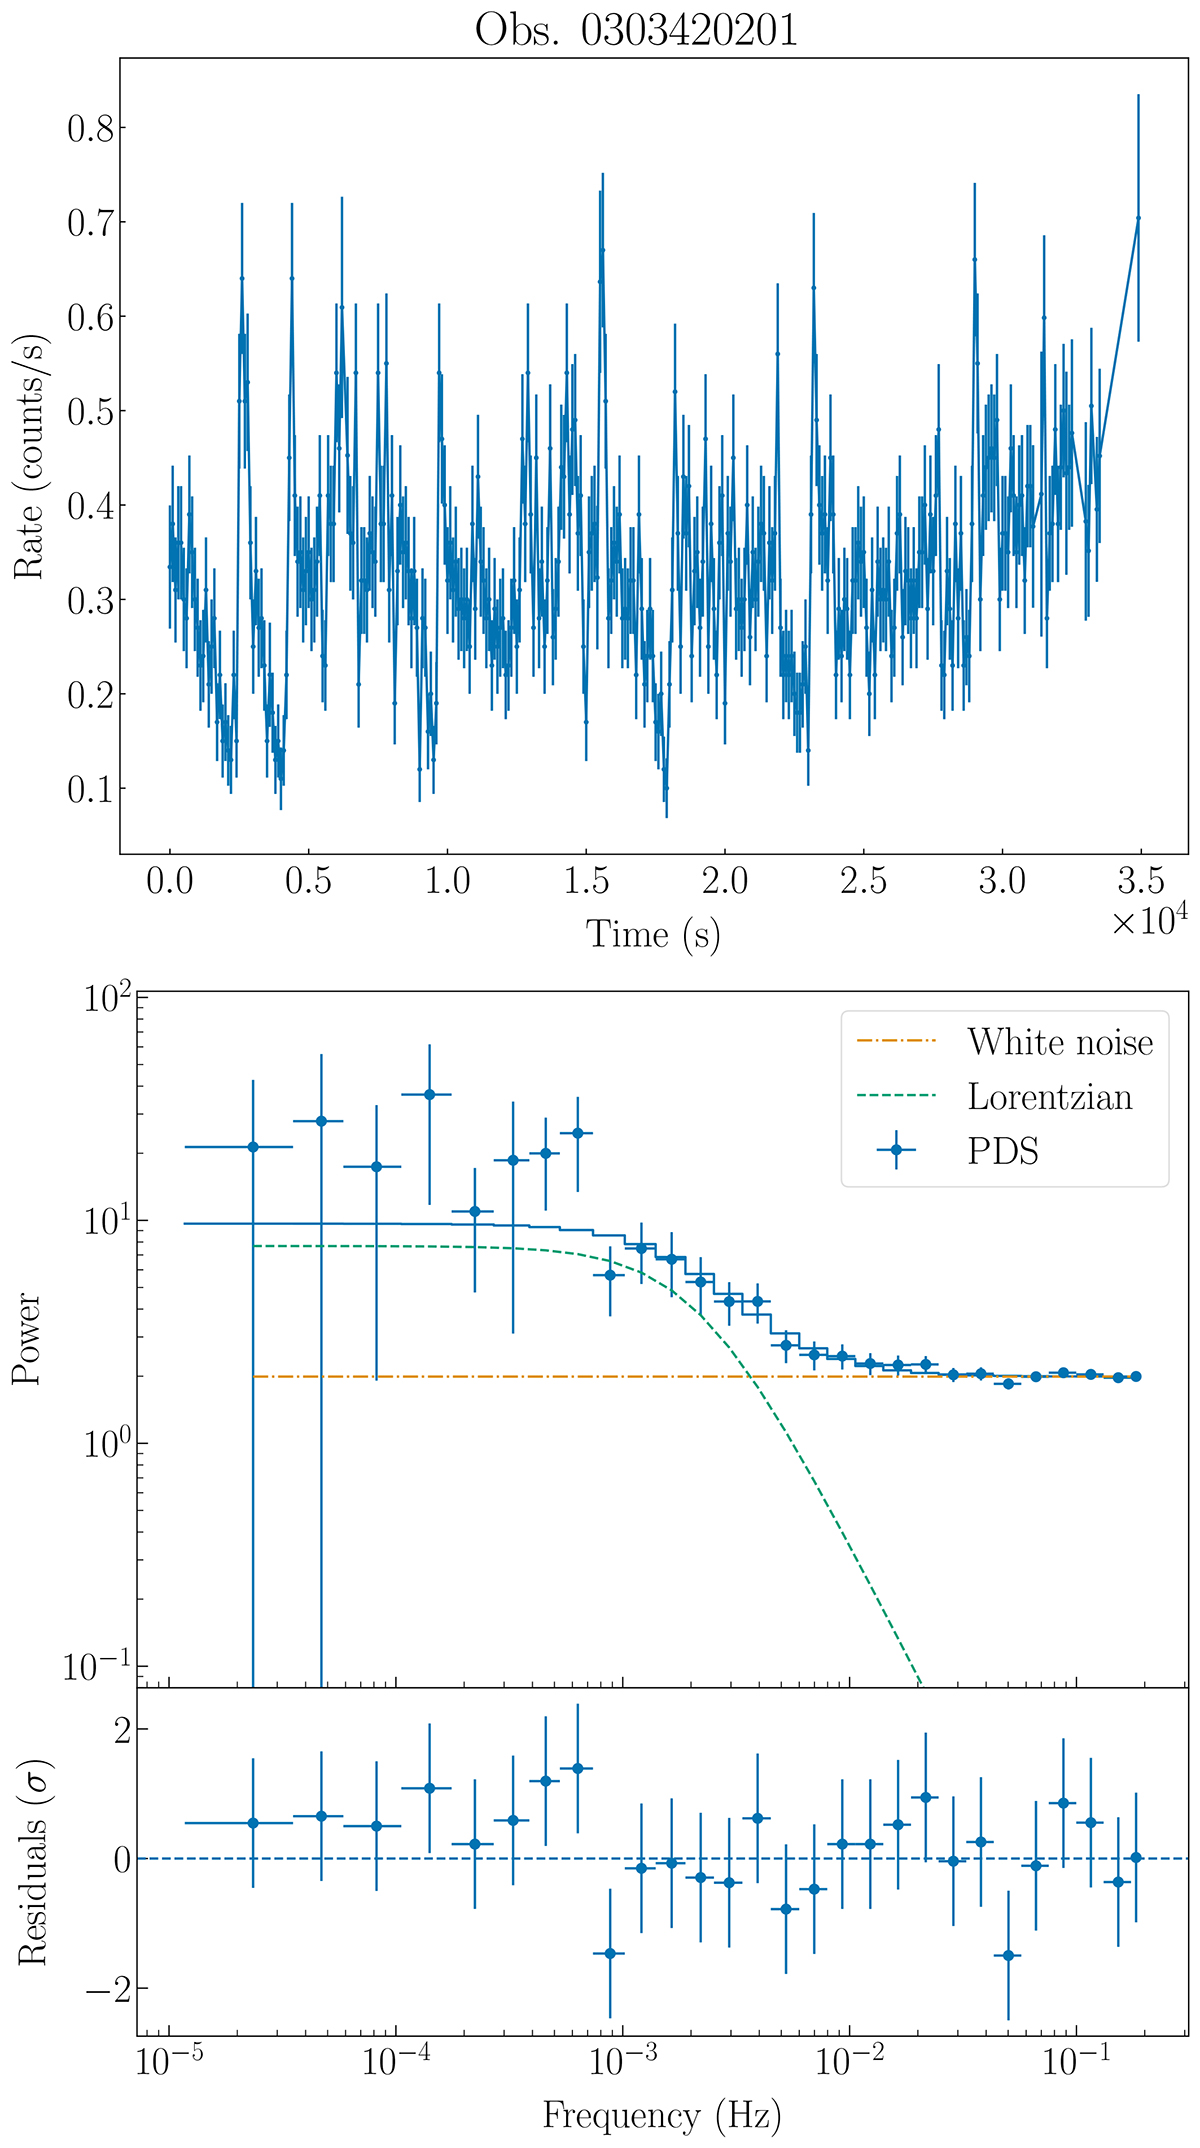
Fig. 5.
Download original image
Timing analysis of XMM-Newton observation 0303420201. Top figure: PN+MOS light curve of ULX-7. The bin time is 100 s, as in the three LP light curves. Bottom figure: ULX-7 PDS in the 0.3–10 keV band (top panel) and residuals of the white noise plus single Lorentzian model used for this observation (bottom panel). We combined data from PN and MOS cameras. The PDS is computed using the Leahy normalization.
Current usage metrics show cumulative count of Article Views (full-text article views including HTML views, PDF and ePub downloads, according to the available data) and Abstracts Views on Vision4Press platform.
Data correspond to usage on the plateform after 2015. The current usage metrics is available 48-96 hours after online publication and is updated daily on week days.
Initial download of the metrics may take a while.