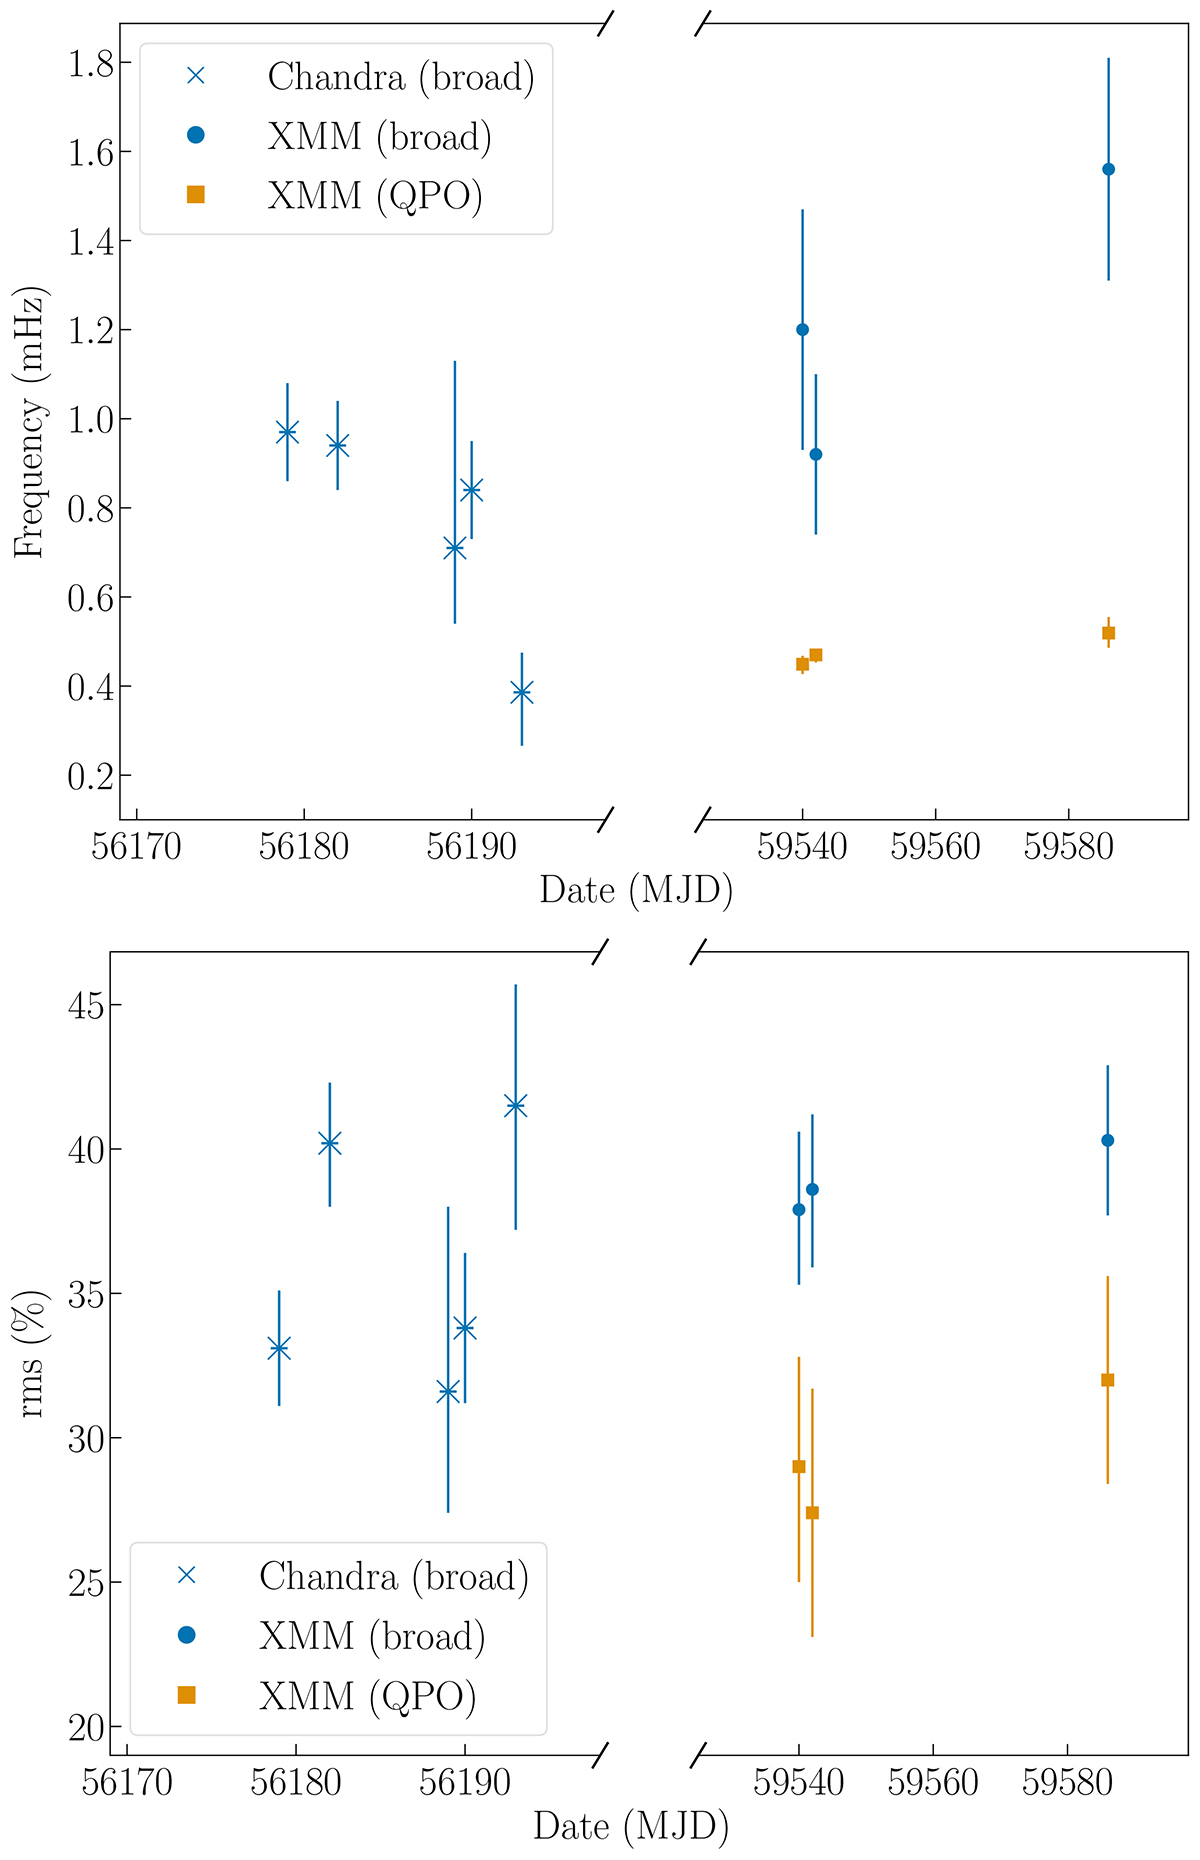
Fig. 4.

Download original image
Long-term evolution of the broad complex parameters. Top panel: evolution of the centroid frequency ν. Bottom panel: evolution of the fractional rms. Cross markers represent the values for the broad feature in Chandra data, while blue circles and orange squares represent the values for the broad feature and the candidate QPO, respectively, in the latest XMM-Newton observations. For Chandra we considered events in the 0.5–10 keV band, while for XMM-Newton events in the 0.3–10 keV band.
Current usage metrics show cumulative count of Article Views (full-text article views including HTML views, PDF and ePub downloads, according to the available data) and Abstracts Views on Vision4Press platform.
Data correspond to usage on the plateform after 2015. The current usage metrics is available 48-96 hours after online publication and is updated daily on week days.
Initial download of the metrics may take a while.


