| Issue |
A&A
Volume 689, September 2024
|
|
|---|---|---|
| Article Number | A158 | |
| Number of page(s) | 12 | |
| Section | Stellar structure and evolution | |
| DOI | https://doi.org/10.1051/0004-6361/202348307 | |
| Published online | 09 September 2024 | |
Unveiling the nature of two dwarf novae: CRTS J080846.2+313106 and V416 Dra
1
Institute of Astrophysics, Pontificia Universidad Católica de Chile, Av. Vicuña MacKenna 4860, 7820436 Santiago, Chile
2
Indian Institute of Astrophysics, Koramangala, Bangalore 560 034, India
3
Millennium Institute of Astrophysics, Nuncio Monseñor Sótero Sanz 100, Providencia, Santiago, Chile
4
Centre for Extragalactic Astronomy, Department of Physics, Durham University, South Road, Durham DH1 3LE, UK
5
Leibniz-Institut für Astrophysik Potsdam, An der Sternwarte 16, 14482 Potsdam, Germany
6
Aryabhatta Research Institute of Observational Sciences, Manora Peak, Nainital 263001, India
7
Instituto de Astrofísica, Universidad Andres Bello, Fernandez Concha 700, Las Condes, Santiago RM, Chile
8
Department of Sciences, Amrita School of Physical Sciences, Amrita Vishwa Vidyapeetham, Coimbatore, TamilNadu 641112, India
Received:
18
October
2023
Accepted:
7
July
2024
Abstract
We present the analysis of optical photometric and spectroscopic observations of two non-magnetic cataclysmic variables, namely CRTS J080846.2+313106 and V416 Dra. We find CRTS J080846.2+313106 to vary with a period of 4.9116 ± 0.0003 h, which was not found in earlier studies and which we provisionally suggest is the orbital period of the system. In both long-period systems, the observed dominant signal at the second harmonic of the orbital frequency and the orbital modulation during quiescence are suggestive of ellipsoidal variation from changing aspects of the secondary, with an additional contribution from the accretion stream or hotspot. However, during the outburst, the hotspot itself is overwhelmed by the increased brightness, which is possibly associated with the accretion disc. The mid-eclipse phase for V416 Dra occurs earlier and the width of the eclipse is greater during outbursts compared to quiescence, suggesting an increased accretion disc radius during outbursts. Furthermore, from our investigation of the accretion disc eclipse in V416 Dra, we find that a total disc eclipse is possible during quiescence, whereas the disc seems to be partially obscured during outbursts, which further signifies that the disc may grow in size as the outburst progresses. The optical spectra of CRTS J080846.2+313106 and V416 Dra are typical of dwarf novae during quiescence, and they both show a significant contribution from the M2-4V secondary. The light curve patterns, orbital periods, and spectra observed in the two systems look remarkably similar, and seem to resemble the characteristics of U Gem-type dwarf novae.
Key words: accretion / accretion disks / novae / cataclysmic variables / stars: individual: CRTS J080846.2+313106 / stars: individual: V416 Dra
Corresponding author; This email address is being protected from spambots. You need JavaScript enabled to view it. , This email address is being protected from spambots. You need JavaScript enabled to view it. .
© The Authors 2024
 Open Access article, published by EDP Sciences, under the terms of the Creative Commons Attribution License (https://creativecommons.org/licenses/by/4.0), which permits unrestricted use, distribution, and reproduction in any medium, provided the original work is properly cited.
This article is published in open access under the Subscribe to Open model. This email address is being protected from spambots. You need JavaScript enabled to view it. to support open access publication.
1. Introduction
Cataclysmic variables (CVs) are semi-detached binaries consisting of a primary white dwarf (WD) accreting material from a main sequence secondary companion (Warner 1995). CVs are broadly classified into two categories: non-magnetic CVs and magnetic CVs. In the absence of strong magnetic fields, the conservation of angular momentum forces accreting material to form an accretion disc around the WD, where viscous forces cause it to slowly move inwards and to finally settle on the surface of the compact object. In optical light, this disc is usually the dominant source of radiation. The accretion disc can suffer recurrent episodes of instability known as dwarf nova outbursts, which increase the luminosity of the system, typically by 2–8 mag over timescales ranging from days to decades. Each outburst lasts for several days to weeks. Among dwarf novae, U Gem subtypes typically have normal outbursts that last less than two weeks and have a typical amplitude of 2–5 mag (Warner 1995). These systems are commonly found above the 2–3 h period gap. The outbursts in U Gem sometimes exhibit a pattern where a long outburst follows a short outburst after a significant time duration. This suggests the possibility of a bimodal outburst distribution, as observed in other dwarf novae (van Paradijs 1983; Szkody & Mattei 1984; Ak et al. 2002). The alternation of long and short outbursts in the CVs above the period gap has been shown to be a natural consequence of the mass-transfer fluctuations (Buat-Ménard et al. 2001). On the other hand, SU UMa dwarf novae, which belong to another subtype, lie below the period gap and exhibit super-outbursts in addition to the normal outbursts, which uniquely display super-humps with periods closely aligned with the orbital period of the system (Vogt 1974; Warner 1975, 1995; Osaki 1996). Super-outbursts typically have a longer duration, lasting approximately 12–20 days, with a typical amplitude of around 3–5 mag. In contrast, normal outbursts last several days, with an amplitude typically around 2–3 mag.
We selected two poorly studied dwarf novae, CRTS J080846.2+313106 (hereafter J0808) and V416 Dra, from the catalogue of Ritter & Kolb (2003, update RKcat7.24, 2016, RK1) for a detailed investigation. J0808 was identified as a CV by Szkody et al. (2004) based on the optical spectrum obtained by the Sloan Digital Sky Survey (SDSS) in the year 2002. The SDSS spectrum obtained during a likely dwarf nova outburst revealed broad absorption lines along with weak emissions in the core. Moreover, 9 h photometric observations showed a modulation with an amplitude of 0.04 mag, which suggests an ambiguous period of 6 h. Later, Han et al. (2020) confirmed its identification as a CV based on a Large Sky Area Multi-Object Fiber Spectroscopic Telescope (LAMOST; Cui et al. 2012) spectrum. This source has a somewhat uncertain parallax. Accordingly, Gaia’s Data Release 3 (DR3) gives a distance to J0808 of  pc, using the Generalized Stellar Parametrizer from Photometry (GSP-Phot) method (Fouesneau et al. 2023).
V416 Dra was spectroscopically identified as a dwarf nova in the Hamburg Quasar Survey (Hagen et al. 1995). Aungwerojwit et al. (2006) investigated V416 Dra using photometric and spectroscopic observations. Their analysis revealed eclipsing photometric light curves, allowing them to determine the orbital period of V416 Dra to be 272.317 ± 0.001 min. They found a radial velocity amplitude of 128.0 ± 9.6 km s−1. A high orbital inclination was also proposed, based on the presence of double-peaked Balmer emission lines and the detection of eclipses in the light curves. In their spectroscopic observations, strong emission lines were observed for a few epochs and broad absorption troughs were seen for other epochs, which is typical of a dwarf nova during quiescence and outburst. Additionally, they hinted that V416 Dra might be a Z Cam-type dwarf nova. For this source, using the well-defined Gaia DR3 parallax directly (Vallenari et al. 2023), we obtain a distance of  pc.
pc.
The light curve morphologies, orbital period, and specific class of J0808, factors that are needed to probe the nature of this system, remain unknown. Moreover, an ambiguous classification of V416 Dra encouraged us to revisit its properties in detail. Therefore, with the aim to ascertain their true nature, we carried out detailed analyses of these two systems using the publicly available extensive photometric Transiting Exoplanet Survey Satellite (TESS; Ricker et al. 2015) observations as well as ground-based spectroscopic observations. The paper is organised as follows. In Sect. 2 we summarise the optical observations and describe our data reduction process. Section 3 contains our analyses and results. Finally, we present a discussion and a summary in Sects. 4 and 5, respectively.
2. Observations and data reduction
2.1. TESS, CRTS, AAVSO, and ZTF observations
A detailed log of the TESS observations for both sources is given in Table A.1. The cadence for both sources was 2 min. However, data were also available at a 20 s cadence in sectors 71 and 72 for J0808 and in sector 73 for V416 Dra. The J0808 and V416 Dra data are stored in the Mikulski Archive for Space Telescopes (MAST) data archive2 with identification numbers ‘TIC 165818951’ and ‘TIC 229791903’, respectively. TESS consists of four cameras, each with a field of view of 24 × 24 degree2, which are aligned to cover 24 × 96-degree2 strips of the sky called ‘sectors’ (see Ricker et al. 2015, for details). TESS bandpass extends from 600 to 1000 nm, with an effective wavelength of 800 nm. Data taken during an anomalous event had quality flags greater than 0 in the FITS file data structure, and thus we considered only the data with the ‘QUALITY flag’ = 0. In the case of J0808, the pre-search data-conditioned simple aperture photometry (PDCSAP) shows abrupt changes in flux for sectors 44 and 47. To inspect this unexpected behaviour of light curves, we further checked simple aperture photometry (SAP) light curves for all four sectors. We have found that the PDCSAP and SAP light curves are similar for sectors 45 and 46; however, they are different from each other for sectors 44 and 47. Thus, to examine this discrepancy, we checked the light curve variations by downloading the target pixel files and found that the brightness of the object in the target pixel file aligns with the SAP light curves of both sectors, unlike the PDCSAP light curves. Furthermore, to determine which light curve to use, we also compared both the SAP and PDCSAP light curves with the available simultaneous Zwicky Transient Facility (ZTF3; Bellm 2019; Graham et al. 2019; Dekany et al. 2020) g- and r-band photometry for sector 44. However, no ZTF-g/r observations are available to compare TESS observations of sector 47. Following this approach, we find that the SAP flux of sector 44 agrees well with the ZTF data rather than the PDCSAP flux. PDCSAP and SAP flux discrepancies were also seen in V416 Dra for sectors 21, 22, 23, 26, 50, 54, 55, 57, 59, and 60. After carefully examining their target pixel files and comparing the TESS magnitudes with the simultaneous ground-based ZTF g/r-band photometry, we find that the SAP flux values are more suitable than the PDCSAP flux values for all these sectors. Consequently, we elected to use the SAP flux values for further analysis of J0808 and V416 Dra.
We also utilised the V-band data of J0808 from the Catalina Schmidt Survey (CSS4; Drake et al. 2009; Larson et al. 2003) for our analysis. Furthermore, the optical photometric data of J0808 and V416 Dra were collected from the American Association of Variable Star Observers (AAVSO5; Kloppenborg 2022) in the CV (unfiltered data with a V-band zero point) and V (Johnson V) bands to represent the long-term variability of both sources. The ZTF observations of J0808 and V416 Dra were also acquired in the ZTF-g, ZTF-r, and ZTF-i filters. All these long-term light curves of J0808 and V416 Dra are easily accessible online.
2.2. Optical spectroscopy
The spectroscopic observations of both sources were obtained using the 2.01 m Himalayan Chandra Telescope (HCT) at Indian Astronomical Observatory, Hanle, which is equipped with the Hanle Faint Object Spectrograph and Camera. The observing log for each observation is given in Table A.1. For all epochs, the observations were taken using a slit width of 1.92 arcsec and a Gr7 (3800–6840 Å) grism with a resolving power of 1330. During each observing run, spectrophotometric standard stars and FeAr arc lamps were also observed for flux and wavelength calibration, respectively. The data for both sources are available on Zenodo6. Slit loss corrections were applied to the 17 December 2018 and 26 November 2022 spectra of J0808, and 21 April 2023 and 20 May 2023 spectra of V416 Dra, using the existing ZTF photometry corresponding to these epochs of spectroscopic observations. However, for the 25 November 2022 spectrum of J0808 and 21 March 2023 spectrum of V416 Dra, the spectroscopic flux matched with the ZTF-r/g photometric flux, and hence no correction was applied. Extinction correction was also applied to the spectra of each epoch using a standard extinction law with RV = 3.1 (Schlafly & Finkbeiner 2011). The spectra were extracted using standard tasks in IRAF7 and reduced flux-calibrated spectra were used for further analysis.
3. Analysis and results
3.1. CRTS J080846.2+313106
3.1.1. Light curve morphology and power spectra
Long-term light curves of J0808 were obtained from the CRTS, AAVSO, ZTF, and TESS observations, which are shown in Fig. 1a. The brightness of the system changes approximately in the range between 20 and 14 mag. The CRTS V light curve indicates an average V ∼ 19 mag and an outburst amplitude of ∼3–4 mag. The CRTS V dataset appears to detect 13 outbursts; however, the source brightness drops from maximum light on timescales of approximately 5 and 8 days, according to AAVSO V (from JD 2456255.50 to JD 2456260.47) and CV (from JD 2459328.33 to JD 2459336.47) data, respectively. During ZTF observations, eleven outbursts appear to be visible, with one long outburst accompanying one small outburst. The short outbursts were observed after approximately 100 days of long outbursts. The shaded pink regions in Fig. 1a correspond to the TESS observations. To probe J0808 in more detail, we closely inspected its TESS light curves independently. The full TESS light curve is shown in Fig. 1b, which shows two types of outbursts that can be distinguished by the amplitude and duration of the outbursts. A long outburst was observed with a duration of ∼11.3 days in sector 44. Subsequently, the system is found to be in a quiescent state. Approximately 106 days after the first outburst, the system undergoes another one, this time with a duration of ∼2.5 days in sector 47. The amplitude of this outburst is somewhat smaller than the amplitude of the outburst observed in sector 44. After approximately 629 days, again this system was observed from TESS for approximately 50 days, but no outburst was detected during this period.
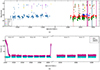 |
Fig. 1. (a) Long-term light curve of J0808. The pink shaded regions correspond to the TESS observations in each sector. The three vertical lines (red, blue, and green) represent the successive epochs of the spectroscopic observations. (b) Zoomed-in view of the TESS observations of J0808, displaying two outbursts. The solid blue line represents the smoothed light curve found using the LOESS fit. The light green line is the detrended light curve after subtracting the smoothed light curve. |
Extensive TESS observations display statistically improved quiescence light curves, which offers a potential opportunity to measure its system parameters. Here, our first motive is to measure an orbital period of the system. To determine the orbital period of the system, the data must be detrended by removing the long-term trends, such as the outburst profile. Thus, we used locally weighted regression (LOESS; Cleveland 1979) with a smoothing span of 0.005 to smooth the light curves. Then, the smooth curves were subtracted from the original light curves to obtain the light curves with the outbursts removed. The LOESS fit and the detrended light curve are also shown in Fig. 1b. To search for the periodic signals in the light curve, we adopted the Lomb-Scargle (LS; Lomb 1976; Scargle 1982) periodogram algorithm to the combined set of all sectors detrended light curves, which is shown in Fig. 2a. Two prominent peaks, corresponding to periods 4.9116 ± 0.0003 h and 2.45586 ± 0.00008 h, are observed in the power spectrum. We provisionally identify the derived period of ∼4.9116 h as the orbital period (PΩ) of J0808 and the ∼2.45586 h period as the second harmonic of the orbital period (P2Ω). We also performed an LS periodogram analysis for the quiescent (from BJD 2459514.5319488 to BJD 2460285.5864469) and outburst (from BJD2459500.4000170 to BJD 2459511.7247343 in sector 44, and from BJD 2459604.0007540 to BJD 2459606.9451476 in sector 47) time spans. The LS power spectrum obtained from the quiescent light curves is shown in the top panel of Fig. 2b. Similar to the combined power spectrum, two prominent signals at PΩ and P2Ω are observed in the quiescent power spectrum. However, only PΩ is observed in the power spectrum obtained from the duration of the outburst phases (see the bottom panel of Fig. 2b).
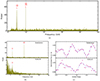 |
Fig. 2. (a) LS periodogram of J0808 obtained using the combined set of the detrended light curves from all sectors in Fig. 1b. The strongest signals correspond to the frequencies Ω and 2Ω and are marked. (b) Zoomed-in view of the LS power spectra to show interesting peaks in the the quiescent time span (from BJD 2459514.5319488 to BJD 2460285.5864469) and the outburst time span (from BJD 2459500.4000170 to BJD 2459511.7247343 in sector 44, and from BJD 2459604.0007540 to BJD 2459606.9451476 in sector 47). (c) Orbital-phase-folded TESS light curves obtained from the quiescent and outburst durations with phase bins of 0.05. |
To study the phased light curve variations, we folded the TESS light curves during both states using an arbitrary zero time BJD = 2453480.776245071 (chosen so that the deeper minimum falls at phase 0.5), and our derived orbital period of 4.9116 h. Phase-folded light curves were obtained for the duration of the quiescent and outburst phases with a phase bin of 0.05 along with a sum of two best-fit functions, a sine and a cosine, and are shown in Fig. 2c. The light curve pattern is distinct in both quiescence and eruption states. The quiescent profile exhibits double-peaked orbital modulations, with the maxima occurring near phases 0.2–0.4 and 0.7–0.9, and minima during conjunctions at phases 0 and 0.5. The peak in the light curve near phases 0.7–0.9 is higher than the peak near phases 0.2–0.4. The presence of a double-peaked pulse profile is also evident from the power spectrum, where along with orbital frequency a strong significant peak is observed at its second harmonic. However, a broad minimum appears filled with emission during the eruption phase.
3.1.2. Optical spectroscopy
Optical spectra of J0808 exhibit a flat continuum and strong Balmer emission lines from Hα to Hδ during each epoch of observations. No broad Balmer absorption seems to be present in its spectrum. The observed wealth of spectral features resembles a typical spectrum of dwarf novae during quiescence. Figure 3 shows the optical spectra of J0808 for epochs 17 December 2018 and 25–26 November 2022. The identification, flux, equivalent width (EW), and full width at half maximum (FWHM) of the principal emission lines of J0808 were obtained through a single-Gaussian fitting and are given in Table 1, where the error associated with each parameter corresponds to the standard deviation obtained from multiple spectral measurements with slight changes in the continuum fit. The flux ratio of HeI (5875 Å)/Hα is measured to be approximately 0.2, which appears to be consistent with what is typically observed in dwarf novae (e.g. Szkody 1981; Williams & Ferguson 1982; Thorstensen & Taylor 2001; Breedt et al. 2012). Similar to Szkody et al. (2004) and Han et al. (2020), strong emission lines are detected in the presented observations but with variable flux and EW values.
 |
Fig. 3. Optical spectra of J0808 for three epochs of observations. The orbital phase and epoch of observation is mentioned in each panel. |
Identification, flux, EW, and FWHM for emission features in the spectra of J0808 and V416 Dra for the indicated measurement epochs.
To estimate the secondary star contribution, we used K- and M-type dwarf spectra from the Pickles (1998) library. We scaled and subtracted them from our observed mean spectrum, resulting in acceptable cancellation of the late-type features that are commonly seen in M2-4V stars. This seems to agree with the expected M2.5 donor, as predicted by Knigge et al. (2011) for the observed orbital period of J0808.
3.2. V416 Dra
3.2.1. Light curve morphology and power spectra
Figure 4 displays the long-term light curve of V416 Dra that was obtained from the AAVSO, ZTF, and TESS observations. TESS observations are represented by the light blue shaded regions. The system brightness seems to vary between 18 and 13 mag. Multiple outbursts, including one large amplitude outburst followed by a series of much shorter or slightly fainter short outbursts, are observable in the long-term light curve. For TESS observations, data spanning a total of 26 sectors are available to support the study of V416 Dra. The TESS light curves of V416 Dra for all 26 sectors are shown in Fig. 5, which reveals outburst as well as quiescent phase light curves. These light curves exhibit eclipses (see Fig. 6). The TESS light curves display a total of 30 outbursts, featuring two distinct types: broad and large-amplitude outbursts, as well as short outbursts with smaller amplitudes and sharp peaks. Among these, eleven are long outbursts, while the rest are short outbursts. The overall shape of the long outbursts appears to vary slightly across observational epochs. After the initial rise, long outbursts in sectors 14, 17, 20, 26, and 60 either remain steady or decrease for approximately 1 to 1.5 days before increasing again. The long outburst in sectors 52 and 57, on the other hand, occurs in four stages: an initial rise followed by approximately one day of stability, then a subsequent increase followed by roughly three days of stability, a subsequent decline with another day of stability, and finally return to quiescence. All these long-outbursts are observed with a duration of ∼13 days. However, short outbursts occurred with a duration of ∼6 days but varying amplitudes. The time duration between short outbursts, as well as between short and long outbursts, is approximately 20 days.
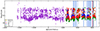 |
Fig. 4. Long-term light curve of V416 Dra. The light blue shaded regions correspond to the TESS observations in each sector. The three vertical lines (red, blue, and green) represent successive epochs of spectroscopic observations. |
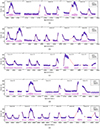 |
Fig. 5. TESS light curves of V416 Dra for all 26 sectors that display outbursts and quiescence features. The solid red line represents the smoothed light curve using the LOESS fit. The light pink line is the detrended light curve by subtracting the smoothed light curve. |
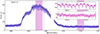 |
Fig. 6. Zoomed-in view of the full TESS light curve of V416 Dra for sector 14, with insets displaying the pink shaded regions. These insets highlight the presence of eclipses during outbursts and quiescent periods. |
As discussed in Sect. 3.1.1, the LS analysis was used to find the periodicity from the detrended light curves or the data from which the trend of outbursts was removed using a LOESS fit. The LS power spectrum obtained using the combined set of all sectors detrended light curves is shown in the top panel of Fig. 7. The power spectrum contains nine equidistant prominent peaks. The first peak, with a period of 4.5386 ± 0.0002 h, agrees well with the period given by Aungwerojwit et al. (2006), which is the orbital period of the system. We also detected higher harmonics of the orbital frequency due to the non-sinusoidal light curve shape through each orbit, which are marked in the power spectrum and are given in Table 2. In addition, to search for the super-humps, we also performed LS periodogram analyses for the combined set of long outbursts, short outbursts, and quiescent phases separately, and obtained similar orbital frequency and their harmonics in each power spectrum (see Fig. 7). Moreover, we also segmented the data into sections corresponding to individual long-outbursts, quiescent, and short outburst phases across all sectors, and performed power spectral analysis for each section. Nevertheless, no other periodic pattern was observed near the orbital frequency region during these time spans.
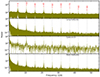 |
Fig. 7. Top panel: LS periodogram of V416 Dra obtained from the combined detrended light curves from all sectors. The significant signals corresponding to the frequency Ω, as well as its harmonics, are marked. The other three panels show the LS power spectra obtained by utilising data during the long outburst, quiescent, and short outburst periods. |
Periods corresponding to the dominant peaks in the power spectrum of V416 Dra obtained from the combined set of detrended light curves from all sectors.
3.2.2. The eclipse profile
We explored the phased light curve variation of V416 Dra during its binary motion. Light curves obtained from the combined TESS observations during quiescent phases are folded using the zero epoch given by Aungwerojwit et al. (2006) and our derived TESS orbital period. The folded light curve derived for the duration of the quiescent phases with bins of width 0.001 is shown in Fig. 8. Most notably, there is an increase in fluxes during quiescence at phases 0.2–0.4 and 0.7–0.9, and the minimum at 0.0 is deeper than the minimum at 0.5. A bright hump feature preceding the eclipse was also observed by Aungwerojwit et al. (2006) in the light curves of V416 Dra.
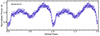 |
Fig. 8. Orbital-phase-folded light curve of V416 Dra obtained from the combined data of all sectors in the quiescent durations with phase bins of 0.001. |
To observe the characteristics of the eclipse profile for the duration of the short-outburst and long-outburst phases, we divided each light curve into sections comprising five successive orbital cycles within these phases. Similar to the approach as described above for quiescence, the folded light curves corresponding to these phases were extracted with bins of width 0.05. Similar to Aungwerojwit et al. (2006), the eclipse depth and profile appear to have changed from quiescence to eruption. We have found that as the brightness increases during outbursts in each light curve, the brightness outside the eclipse becomes much less pronounced or remains relatively flat, and the eclipse feature is V-shaped and symmetrical, as is usual for an eclipsing dwarf nova in outburst (see Baptista et al. 2000). Additionally, peaks emerge at orbital phases 0.2–0.4 and 0.7–0.9 in the folded light curve as the system approaches quiescence. For example, Fig. 9 shows the phased light curves corresponding to short and long-outbursts obtained from sectors 20, 26, and 57, which clearly demonstrate that over the course of the outburst, brightness becomes more uniform.
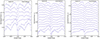 |
Fig. 9. Orbital-phase-folded light curves of V416 Dra obtained using the five successive segmented orbital cycles of the short and long outburst phases of sectors (from left to right) 20, 26, and 57, which are plotted in order of increasing time from the bottom up. For improved visibility, each successive light curve is vertically shifted by increments of 0.1 of the normalised flux. |
Subsequently, the phase-folded and binned eclipse profiles obtained from the segmented five successive orbital cycles during both outburst and quiescent episodes were fitted using a Gaussian model, which allowed us to determine the mid-eclipse phase and eclipse phase width for each sector data. For example, Fig. 10 shows the mid-eclipse phase and eclipse phase width for TESS light curves of sectors 14, 15, 41, and 52, which include short, long, and quiescent episodes. We have found that the phase of the mid-eclipse is centred near 0.0 during quiescence, whereas the phase of the mid-eclipse occurs earlier during outbursts (short and long) compared to quiescence. Also, during outbursts, the eclipse phase width is greater compared to quiescence. The average eclipse width at half maximum (Δϕ) during quiescence and outburst is 0.082 ± 0.005 and 0.124 ± 0.009, respectively, implying that the eclipse duration in quiescence is less than that in outburst.
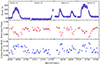 |
Fig. 10. The top panel presents the TESS light curves of V416 Dra for sectors 14, 15, 41, and 52. The middle and lower panels present the mid-eclipse phase and eclipse phase width, derived by fitting the mean eclipse-phased profile obtained from five successive eclipses of these sectors’ light curves. |
Furthermore, we derived the orbital inclination (i) of the binary system by using the equation given by Eggleton (1983),
 (1)
(1)
where R2 is the volume radius of the secondary star and a is the binary separation. R2/a depends only on the mass ratio (q) as
 (2)
(2)
The coefficients C and D are given by Eggleton (1983) as 0.49 and 0.6, respectively, for a spherical Roche lobe. However, in the case of CVs, the Roche lobe of the secondary is not spherical, having the largest size as ‘seen’ from the WD and the smallest in the polar direction. Therefore, we used the coefficients C = 0.4990 and D = 0.5053, as described by Andronov & Andrych (2014), assuming a significantly more accurate model for its elliptical projection onto the celestial sphere. Adopting a Δϕ of 0.082 and a mass ratio q of 0.5, assuming an average mass of the WD in CVs of approximately 0.8 M⊙ (Zorotovic et al. 2011; Pala et al. 2020) and an expected secondary mass of approximately 0.4 M⊙ (Knigge et al. 2011), the orbital inclination is estimated to be i ∼76°.
We also performed an analysis of the accretion disc eclipses by comparing the circularization radius of the disc to the donor radius as reported by Court et al. (2020). The circularization radius can be calculated using the equation given by Frank et al. (2002),
 (3)
(3)
Adopting an expected average mass ratio q of 0.5, the Roche lobe donor radius (R2) and circularization radius (Rcirc) of the disc are 0.35a and 0.17a, respectively. Additionally, we estimated the size of the accretion disc and the half chord of the donor by combining the expected values for q, i, and Δϕ with Eqs. (4) and (5) of Dhillon et al. (1991). Using Δϕ ∼ 0.124 during outburst, q = 0.5, and i = 76°, we estimate a disc radius and half chord radius of 0.43a and 0.25a, respectively.
3.2.3. Optical spectroscopy
Figure 11 displays strong hydrogen Balmer emission lines from Hα to Hδ, as well as HeI (5875 Å) emission line in the optical spectra obtained during three distinct epoch observations of V416 Dra. The flux ratio of HeI (5875 Å)/Hα is measured to be around 0.1. The observed optical spectra resemble the spectrum obtained by Aungwerojwit et al. (2006). Similar to Aungwerojwit et al. (2006), double-peaked Balmer emission lines are observed in all observed spectra. Identification, flux, EW, and FWHM of the principal emission lines of V416 Dra are given in Table 1. Similar to J0808, the comparison with the Pickles (1998) template spectra suggests that V416 Dra also exhibits a secondary of spectral type M2-4V, which seems consistent with the spectral type of M2.9 predicted by Knigge et al. (2011) for the observed PΩ = 4.5386 h.
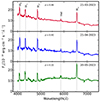 |
Fig. 11. Optical spectra of V416 Dra for three epochs of observations. The orbital phase and epoch of observation is noted in each panel. |
4. Discussion
4.1. J0808
The observed long outburst following the short outburst after a long hiatus reveals J0808 to be a U Gem-type dwarf nova (see van Paradijs 1983; Szkody et al. 2004). A photometric period of 4.9116 ± 0.0003 h is detected from the TESS observations, which we provisionally suggest is the orbital period of this system. This derived period differs from the orbital period of U Gem (the class prototype) by only ∼0.66 h, lending further credence to J0808 being a U Gem type.
Furthermore, J0808 displays a double-peaked orbital pulse profile during quiescence, with unequal minima and maxima. The observed double-humped features suggest that these variations are the result of an ellipsoidal modulation of the secondary (Warner 1995). This is further evident from the detection of the dominant power at 2Ω, which reinforces the strong contribution from the secondary star due to its ellipsoidal modulation. The different sizes of maxima and minima features in J0808 suggest the existence of a second light source or an additional contribution from the accretion stream or hot spot in the system. The two maxima are the result of maximum visibility of the Roche-deformed sides of the secondary star at orbital phases 0.2–0.4 and 0.7–0.9, where an additional contribution from the accretion stream or hot spot could be partially obscured and unobscured, respectively. The shallow and deeper minima represent the inferior and superior conjunctions of the secondary. At superior conjunction, the most probable obstruction between the observer and the combined light of the secondary and the additional source is a faint accretion disc. The variability shape is different during outburst as compared to quiescence. The deeper minimum phase of quiescence seems filled in with emission during the outburst, while the shallower minimum phase of quiescence becomes deeper and wider. The deeper minimum phase during the outburst is likely caused by the secondary eclipsing the component of the system from which the outburst originates.
4.2. V416 Dra
The presence of long outbursts, along with frequent short outbursts, suggests that V416 Dra also belongs to the category of U Gem-type dwarf novae. The short outbursts exhibit a rapid rise followed by an exponential type decay. However, most of the long outbursts show an initial increase in brightness (similar to the short outbursts) followed by a plateau lasting less than one and a half days. Subsequently, there is a further rise in brightness, followed by a gradual decrease in flux (see Fig. 5). This observed pattern of behaviour is commonly referred to as a ‘precursor’, which has been consistently observed in all super-outbursts of SU UMa-type CVs (e.g. Still et al. 2010; Barclay et al. 2012). However, after the emergence of high cadence data, Cannizzo (2012) and Ramsay et al. (2012) suggested that these precursors are common to long outbursts from accreting CVs in general. The observed embedded precursors in V416 Dra support the findings of Cannizzo (2012) and Ramsay et al. (2012) that long outbursts in dwarf novae above the period gap appear to be triggered by short outbursts. In this context, when the material in the outer radii of the accretion disc becomes ionised, a normal or short outburst is thought to generate a super or long outburst. The long-baseline TESS observations allow the orbital period to be unambiguously determined as 4.5386 ± 0.0002 h, which is consistent with the previously reported value. The observed orbital period, along with the lack of detection of any super-hump period during long outbursts, resembles the characteristics of U Gem-type dwarf novae.
The orbital modulation of V416 Dra reveals eclipse features, with noticeable variations in eclipse profiles when the system switches between outburst and quiescence. Similar to J0808, a characteristic of ellipsoidal variation of the secondary is also evident in the observed light curve of V416 Dra during quiescence, with an additional contribution from the accretion stream or hot spot. The dominant 2Ω signal also strengthens the evidence for ellipsoidal modulation of the secondary. The deeper minimum during quiescence exhibits the occultation of the WD and bright hotspot. The increase in flux just preceding the eclipse at orbital phase 0.7–0.9 is associated with the hotspot where the accretion stream from the donor star hits the accretion disc and is seen approximately face-on (see Wood et al. 1986). A similar pattern is observed in other eclipsing CVs such as V447 Lyr, KIS J192748.53+444724.5, Z Cha, and IPHAS J051814.34+294113.2 (Ramsay et al. 2012; Scaringi et al. 2013; Court et al. 2019; Han et al. 2021). In these systems, the disc becomes larger and hotter during outburst, resulting in deeper eclipse depths compared to out-of-eclipse flux. Unlike in quiescence, the flat out-of-eclipse feature and V-shaped eclipse observed during V416 Dra outburst suggest that the optical light is dominated by the accretion disc. Consequently, the secondary star becomes less visible, and the bright spot makes a significantly smaller contribution to the total optical flux as compared to quiescence, and/or the hotspot emitting region has changed from a small, compact region to a larger structure over the disc. This is also evident from the derived mid-eclipse phase and width of the eclipse during outburst and quiescence episodes. The phase of the mid-eclipse occurs earlier during outbursts compared to quiescence, and the width of the eclipse is greater during an outburst. This further suggests that the accretion disc has a larger radius during outburst compared to during quiescence. Moreover, the Roche lobe-filling donor radius is estimated to be larger than the circularization radius of the disc, indicating that the accretion disc in quiescence is likely to be completely obscured. To investigate the possibility of a total eclipse of the disc during the outburst, we also estimated the size of the accretion disc and the half chord and found that the disc radius during the outburst is larger than the half chord of the donor, implying that the donor star covers a significant fraction of the disc during the outburst. This also suggests that the disc grows in size as the outburst progresses, driven by the presence of high-viscosity material associated with the outburst. Conversely, the disc radius contracts during quiescence due to the accretion of low angular momentum material (Smak 1971; Lasota 2001).
5. Summary
We have carried out detailed analyses of J0808 and V416 Dra using optical photometry and spectroscopy. The observed outbursts and the absolute G-band magnitude of approximately +7.4 are typical of non-magnetic CVs (Warner 1987). The light curve behaviour, orbital periods, and spectra of the two systems show remarkable similarity, and both appear to fall into the category of U Gem-type systems. Additionally, they appear to mirror the characteristics of the rare type dwarf nova CW 1045+525 (Tappert et al. 2001). To summarise, we find the following characteristics for J0808 and V416 Dra:
-
For the first time, an unambiguous period of 4.9116 ± 0.0003 h is detected for J0808, which appears to be the orbital period of the system. This orbital period places it above the period gap in the distribution of CV orbital periods.
-
In both long-period systems, the observed dominant 2Ω signal and the orbital modulation during quiescence suggest ellipsoidal modulation from the changing aspect of the secondary, with an additional contribution from the accretion stream or hot spot. However, during the outburst, the hotspot itself is overwhelmed by the increased brightness, which is possibly associated with the accretion disc.
-
The mid-eclipse phase for V416 Dra starts earlier and the eclipse phase width widens during outbursts compared to quiescence, implying a larger accretion disc radius during outbursts. This is supported by our study of the accretion disc eclipse of V416 Dra, which suggests a total disc eclipse in quiescence, while a significant fraction of the disc appears to be eclipsed during outbursts, indicating a possible growth in disc size during the outburst phase.
-
Optical spectra of J0808 and V416 Dra are typical of dwarf novae during quiescence. The lack of HeII (4686 Å) in the spectra of both systems rules out the possibility that they are magnetic CVs or nova-like variables, or that they contain any hot optically thick discs. Additionally, both stars exhibit a significant contribution from an M2-4V secondary.
-
The photometric and spectroscopic results obtained from the two systems are very similar, and seem to resemble the characteristics of U Gem-type dwarf novae.
Image Reduction and Analysis Facility (IRAF) was distributed by the National Optical Astronomy Observatory, which was managed by the Association of Universities for Research in Astronomy (AURA) under a cooperative agreement with the National Science Foundation.
Acknowledgments
We thank the anonymous referee for the careful reading of the manuscript and giving us constructive comments and suggestions that improved the manuscript considerably. AJ acknowledges support from the Centro de Astrofisica y Tecnologias Afines (CATA) fellowship via grant Agencia Nacional de Investigacion Desarrollo (ANID), BASAL FB210003. Support for MC is provided by ANID’s FONDECYT Regular grant #1171273; ANID’s Millennium Science Initiative through grants ICN12_009 and AIM23-0001, awarded to the Millennium Institute of Astrophysics (MAS); and ANID’s Basal project FB210003. This research includes data collected with the TESS mission, obtained from the MAST data archive at the Space Telescope Science Institute (STScI). Funding for the TESS mission is provided by the NASA Explorer Program. This research is also based on observations obtained with the Samuel Oschin 48 inch telescope at the Palomar Observatory as part of the Zwicky Transient Facility project. ZTF is supported by the National Science Foundation under grant No. AST-1440341 and a collaboration including Caltech, IPAC, the Weizmann Institute for Science, the Oskar Klein Center at Stockholm University, the University of Maryland, the University of Washington, Deutsches Elektronen-Synchrotron and Humboldt University, Los Alamos National Laboratories, the TANGO Consortium of Taiwan, the University of Wisconsin at Milwaukee, and Lawrence Berkeley National Laboratories. Operations are conducted by the COO, IPAC, and UW. We acknowledge with thanks the variable star observations from the AAVSO International Database contributed by observers worldwide and used in this research. The CRTS survey is supported by the U.S. National Science Foundation under grants AST-0909182 and AST-1313422. AJ acknowledges J. Joshi for reading our work and providing helpful comments. RD acknowledges funds by ANID grant FONDECYT Post-doctorado N° 3220449. The observing staff and observing assistants of 2.01-m HCT telescope are deeply acknowledged for their support during optical spectroscopic observations.
References
- Ak, T., Ozkan, M. T., & Mattei, J. A. 2002, A&A, 389, 478 [NASA ADS] [CrossRef] [EDP Sciences] [Google Scholar]
- Andronov, I. L., & Andrych, K. D. 2014, Odessa Astron. Publ., 27, 38 [Google Scholar]
- Aungwerojwit, A., Gänsicke, B. T., Rodríguez-Gil, P., et al. 2006, A&A, 455, 659 [NASA ADS] [CrossRef] [EDP Sciences] [Google Scholar]
- Baptista, R., Catalán, M. S., & Costa, L. 2000, MNRAS, 316, 529 [NASA ADS] [CrossRef] [Google Scholar]
- Barclay, T., Still, M., Jenkins, J. M., Howell, S. B., & Roettenbacher, R. M. 2012, MNRAS, 422, 1219 [CrossRef] [Google Scholar]
- Bellm, E., Kulkarni, S., & Graham, M. 2019, Am. Astron. Soc. Meeting Abstr., 233, 363.08 [NASA ADS] [Google Scholar]
- Breedt, E., Gänsicke, B. T., Marsh, T. R., et al. 2012, MNRAS, 425, 2548 [NASA ADS] [CrossRef] [Google Scholar]
- Buat-Ménard, V., Hameury, J. M., & Lasota, J. P. 2001, A&A, 366, 612 [NASA ADS] [CrossRef] [EDP Sciences] [Google Scholar]
- Cannizzo, J. K. 2012, ApJ, 757, 174 [NASA ADS] [CrossRef] [Google Scholar]
- Cleveland, W. S. 1979, J. Am. Stat. Assoc., 74, 829 [Google Scholar]
- Court, J. M. C., Scaringi, S., Rappaport, S., et al. 2019, MNRAS, 488, 4149 [NASA ADS] [CrossRef] [Google Scholar]
- Court, J. M. C., Scaringi, S., Littlefield, C., et al. 2020, MNRAS, 494, 4656 [NASA ADS] [CrossRef] [Google Scholar]
- Cui, X.-Q., Zhao, Y.-H., Chu, Y.-Q., et al. 2012, Res. Astron. Astrophys., 12, 1197 [Google Scholar]
- Dekany, R., Smith, R. M., Riddle, R., et al. 2020, PASP, 132 [Google Scholar]
- Dhillon, V. S., Marsh, T. R., & Jones, D. H. P. 1991, MNRAS, 252, 342 [NASA ADS] [CrossRef] [Google Scholar]
- Drake, A. J., Djorgovski, S. G., Mahabal, A., et al. 2009, ApJ, 696, 870 [Google Scholar]
- Eggleton, P. P. 1983, ApJ, 268, 368 [Google Scholar]
- Fouesneau, M., Frémat, Y., Andrae, R., et al. 2023, A&A, 674, A28 [NASA ADS] [CrossRef] [EDP Sciences] [Google Scholar]
- Frank, J., King, A., & Raine, D. J. 2002, Accretion Power in Astrophysics 3rd edn, (Cambridge: Cambridge Univ. Press) [CrossRef] [Google Scholar]
- Graham, M. J., Kulkarni, S. R., Bellm, E. C., et al. 2019, PASP, 131, 078001 [Google Scholar]
- Hagen, H. J., Groote, D., Engels, D., & Reimers, D. 1995, A&AS, 111, 195 [NASA ADS] [Google Scholar]
- Han, Z., Boonrucksar, S., Qian, S., et al. 2020, PASJ, 72, 76 [NASA ADS] [CrossRef] [Google Scholar]
- Han, Z. T., Soonthornthum, B., Qian, S. B., et al. 2021, AJ, 162, 205 [NASA ADS] [CrossRef] [Google Scholar]
- Kloppenborg, B. K. 2022, Observations from the AAVSO International Database. https://www.aavso.org [Google Scholar]
- Knigge, C., Baraffe, I., & Patterson, J. 2011, ApJS, 194, 28 [Google Scholar]
- Larson, S., Beshore, E., Hill, R., et al. 2003, AAS/Div Planet. Sci. Meeting Abstr., 35, 36.04 [Google Scholar]
- Lasota, J.-P. 2001, New Astron Rev., 45, 449 [NASA ADS] [CrossRef] [Google Scholar]
- Lomb, N. R. 1976, Ap&SS, 39, 447 [Google Scholar]
- Osaki, Y. 1996, PASP, 108, 39 [NASA ADS] [CrossRef] [Google Scholar]
- Pala, A. F., Gänsicke, B. T., Breedt, E., et al. 2020, MNRAS, 494, 3799 [Google Scholar]
- Pickles, A. J. 1998, PASP, 110, 863 [NASA ADS] [CrossRef] [Google Scholar]
- Ramsay, G., Cannizzo, J. K., Howell, S. B., et al. 2012, MNRAS, 425, 1479 [CrossRef] [Google Scholar]
- Ricker, G. R., Winn, J. N., Vanderspek, R., et al. 2015, J. Astron. Telesc. Instrum. Syst., 1, 014003 [Google Scholar]
- Ritter, H., & Kolb, U. 2003, A&A, 404, 301 [NASA ADS] [CrossRef] [EDP Sciences] [Google Scholar]
- Scargle, J. D. 1982, ApJ, 263, 835 [Google Scholar]
- Scaringi, S., Groot, P. J., & Still, M. 2013, MNRAS, 435, L68 [NASA ADS] [CrossRef] [Google Scholar]
- Schlafly, E. F., & Finkbeiner, D. P. 2011, ApJ, 737, 103 [Google Scholar]
- Smak, J. 1971, Acta Astron., 21, 15 [NASA ADS] [Google Scholar]
- Still, M., Howell, S. B., Wood, M. A., Cannizzo, J. K., & Smale, A. P. 2010, ApJ, 717, L113 [NASA ADS] [CrossRef] [Google Scholar]
- Szkody, P. 1981, ApJ, 247, 577 [NASA ADS] [CrossRef] [Google Scholar]
- Szkody, P., Henden, A., Fraser, O., et al. 2004, AJ, 128, 1882 [NASA ADS] [CrossRef] [Google Scholar]
- Szkody, P., & Mattei, J. A. 1984, PASP, 96, 988 [NASA ADS] [CrossRef] [Google Scholar]
- Tappert, C., Thorstensen, J. R., Fenton, W. H., et al. 2001, A&A, 380, 533 [NASA ADS] [CrossRef] [EDP Sciences] [Google Scholar]
- Thorstensen, J. R., & Taylor, C. J. 2001, MNRAS, 326, 1235 [NASA ADS] [CrossRef] [Google Scholar]
- Vallenari, A., Brown, A. G. A., Prusti, T., et al. 2023, A&A, 674, A1 [NASA ADS] [CrossRef] [EDP Sciences] [Google Scholar]
- van Paradijs, J. 1983, A&A, 125, L16 [NASA ADS] [Google Scholar]
- Vogt, N. 1974, A&A, 36, 369 [NASA ADS] [Google Scholar]
- Warner, B. 1975, MNRAS, 170, 219 [NASA ADS] [CrossRef] [Google Scholar]
- Warner, B. 1987, MNRAS, 227, 23 [NASA ADS] [Google Scholar]
- Warner, B. 1995, Camb. Astrophys. Ser., 28 [Google Scholar]
- Williams, R. E., & Ferguson, D. H. 1982, ApJ, 257, 672 [NASA ADS] [CrossRef] [Google Scholar]
- Wood, J., Horne, K., Berriman, G., et al. 1986, MNRAS, 219, 629 [NASA ADS] [CrossRef] [Google Scholar]
- Zorotovic, M., Schreiber, M. R., & Gänsicke, B. T. 2011, A&A, 536, A42 [NASA ADS] [CrossRef] [EDP Sciences] [Google Scholar]
Appendix A: Additional Table
TESS and spectroscopic observations.
All Tables
Identification, flux, EW, and FWHM for emission features in the spectra of J0808 and V416 Dra for the indicated measurement epochs.
Periods corresponding to the dominant peaks in the power spectrum of V416 Dra obtained from the combined set of detrended light curves from all sectors.
All Figures
|
Fig. 1. (a) Long-term light curve of J0808. The pink shaded regions correspond to the TESS observations in each sector. The three vertical lines (red, blue, and green) represent the successive epochs of the spectroscopic observations. (b) Zoomed-in view of the TESS observations of J0808, displaying two outbursts. The solid blue line represents the smoothed light curve found using the LOESS fit. The light green line is the detrended light curve after subtracting the smoothed light curve. |
| In the text | |
|
Fig. 2. (a) LS periodogram of J0808 obtained using the combined set of the detrended light curves from all sectors in Fig. 1b. The strongest signals correspond to the frequencies Ω and 2Ω and are marked. (b) Zoomed-in view of the LS power spectra to show interesting peaks in the the quiescent time span (from BJD 2459514.5319488 to BJD 2460285.5864469) and the outburst time span (from BJD 2459500.4000170 to BJD 2459511.7247343 in sector 44, and from BJD 2459604.0007540 to BJD 2459606.9451476 in sector 47). (c) Orbital-phase-folded TESS light curves obtained from the quiescent and outburst durations with phase bins of 0.05. |
| In the text | |
|
Fig. 3. Optical spectra of J0808 for three epochs of observations. The orbital phase and epoch of observation is mentioned in each panel. |
| In the text | |
|
Fig. 4. Long-term light curve of V416 Dra. The light blue shaded regions correspond to the TESS observations in each sector. The three vertical lines (red, blue, and green) represent successive epochs of spectroscopic observations. |
| In the text | |
|
Fig. 5. TESS light curves of V416 Dra for all 26 sectors that display outbursts and quiescence features. The solid red line represents the smoothed light curve using the LOESS fit. The light pink line is the detrended light curve by subtracting the smoothed light curve. |
| In the text | |
|
Fig. 6. Zoomed-in view of the full TESS light curve of V416 Dra for sector 14, with insets displaying the pink shaded regions. These insets highlight the presence of eclipses during outbursts and quiescent periods. |
| In the text | |
|
Fig. 7. Top panel: LS periodogram of V416 Dra obtained from the combined detrended light curves from all sectors. The significant signals corresponding to the frequency Ω, as well as its harmonics, are marked. The other three panels show the LS power spectra obtained by utilising data during the long outburst, quiescent, and short outburst periods. |
| In the text | |
|
Fig. 8. Orbital-phase-folded light curve of V416 Dra obtained from the combined data of all sectors in the quiescent durations with phase bins of 0.001. |
| In the text | |
|
Fig. 9. Orbital-phase-folded light curves of V416 Dra obtained using the five successive segmented orbital cycles of the short and long outburst phases of sectors (from left to right) 20, 26, and 57, which are plotted in order of increasing time from the bottom up. For improved visibility, each successive light curve is vertically shifted by increments of 0.1 of the normalised flux. |
| In the text | |
|
Fig. 10. The top panel presents the TESS light curves of V416 Dra for sectors 14, 15, 41, and 52. The middle and lower panels present the mid-eclipse phase and eclipse phase width, derived by fitting the mean eclipse-phased profile obtained from five successive eclipses of these sectors’ light curves. |
| In the text | |
|
Fig. 11. Optical spectra of V416 Dra for three epochs of observations. The orbital phase and epoch of observation is noted in each panel. |
| In the text | |
Current usage metrics show cumulative count of Article Views (full-text article views including HTML views, PDF and ePub downloads, according to the available data) and Abstracts Views on Vision4Press platform.
Data correspond to usage on the plateform after 2015. The current usage metrics is available 48-96 hours after online publication and is updated daily on week days.
Initial download of the metrics may take a while.