Fig. 7.
Download original image
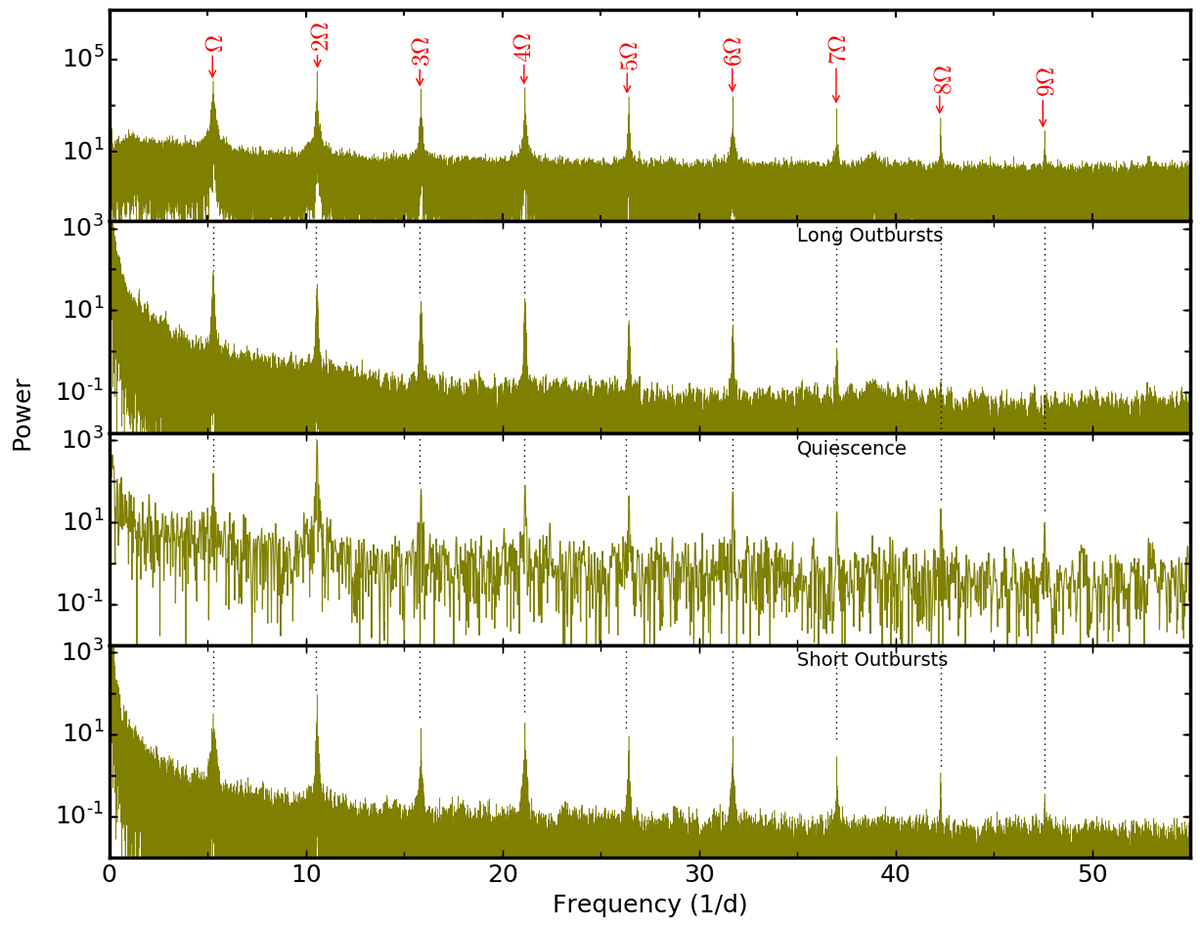
Top panel: LS periodogram of V416 Dra obtained from the combined detrended light curves from all sectors. The significant signals corresponding to the frequency Ω, as well as its harmonics, are marked. The other three panels show the LS power spectra obtained by utilising data during the long outburst, quiescent, and short outburst periods.
Current usage metrics show cumulative count of Article Views (full-text article views including HTML views, PDF and ePub downloads, according to the available data) and Abstracts Views on Vision4Press platform.
Data correspond to usage on the plateform after 2015. The current usage metrics is available 48-96 hours after online publication and is updated daily on week days.
Initial download of the metrics may take a while.