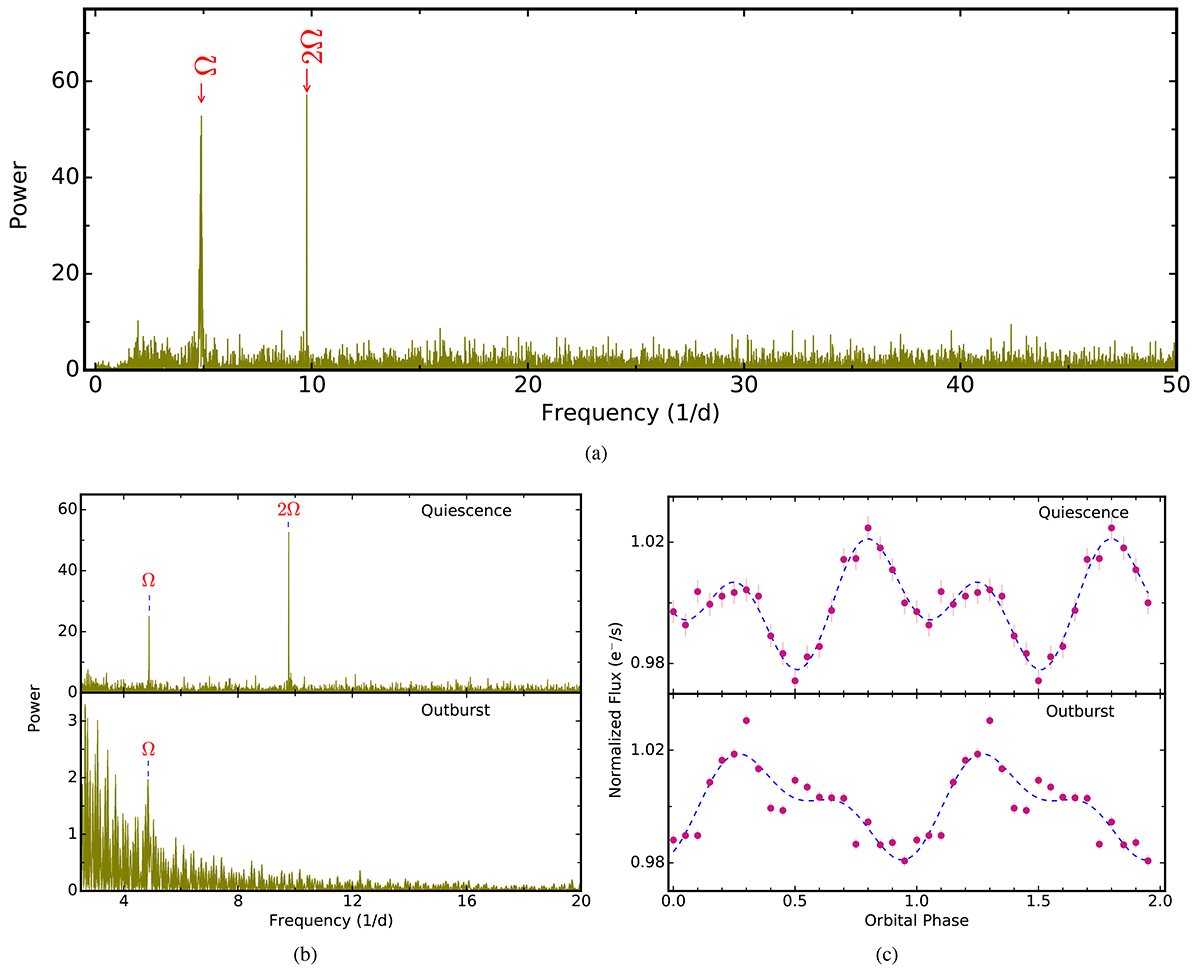
Fig. 2.
Download original image
(a) LS periodogram of J0808 obtained using the combined set of the detrended light curves from all sectors in Fig. 1b. The strongest signals correspond to the frequencies Ω and 2Ω and are marked. (b) Zoomed-in view of the LS power spectra to show interesting peaks in the the quiescent time span (from BJD 2459514.5319488 to BJD 2460285.5864469) and the outburst time span (from BJD 2459500.4000170 to BJD 2459511.7247343 in sector 44, and from BJD 2459604.0007540 to BJD 2459606.9451476 in sector 47). (c) Orbital-phase-folded TESS light curves obtained from the quiescent and outburst durations with phase bins of 0.05.
Current usage metrics show cumulative count of Article Views (full-text article views including HTML views, PDF and ePub downloads, according to the available data) and Abstracts Views on Vision4Press platform.
Data correspond to usage on the plateform after 2015. The current usage metrics is available 48-96 hours after online publication and is updated daily on week days.
Initial download of the metrics may take a while.