Open Access
Fig. 10.
Download original image
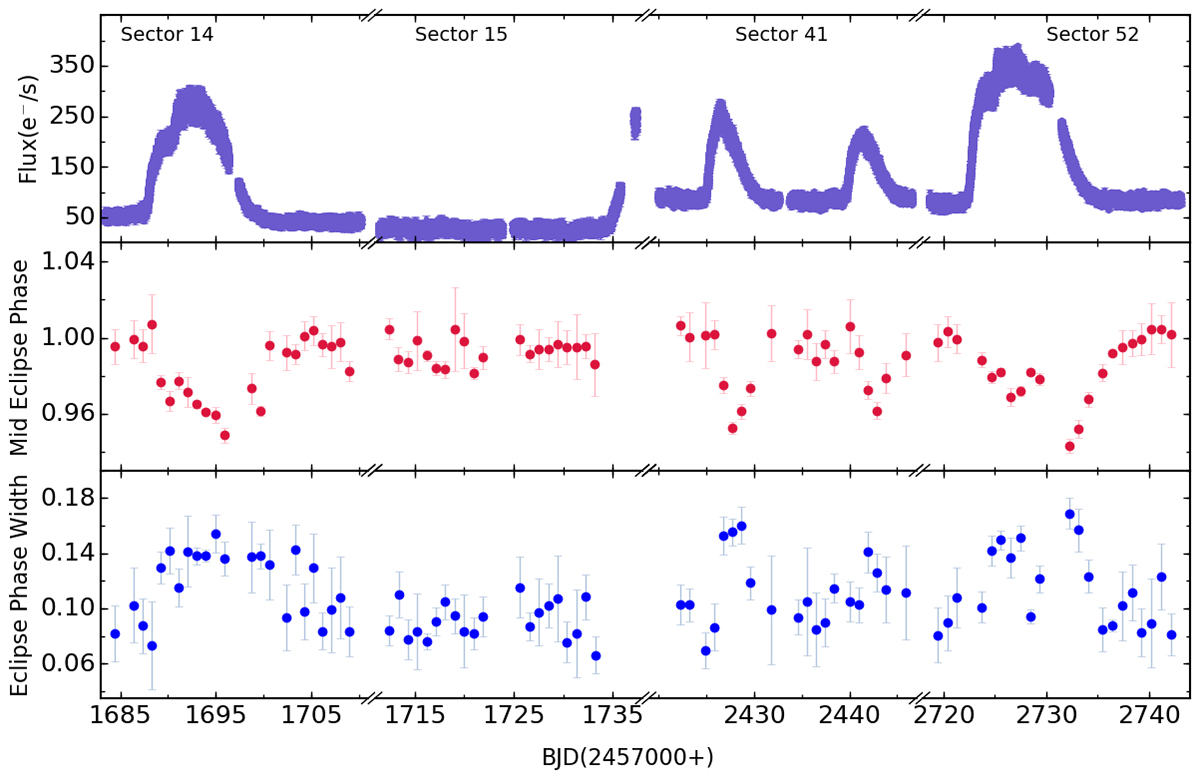
The top panel presents the TESS light curves of V416 Dra for sectors 14, 15, 41, and 52. The middle and lower panels present the mid-eclipse phase and eclipse phase width, derived by fitting the mean eclipse-phased profile obtained from five successive eclipses of these sectors’ light curves.
Current usage metrics show cumulative count of Article Views (full-text article views including HTML views, PDF and ePub downloads, according to the available data) and Abstracts Views on Vision4Press platform.
Data correspond to usage on the plateform after 2015. The current usage metrics is available 48-96 hours after online publication and is updated daily on week days.
Initial download of the metrics may take a while.