Open Access
Fig. 5.
Download original image
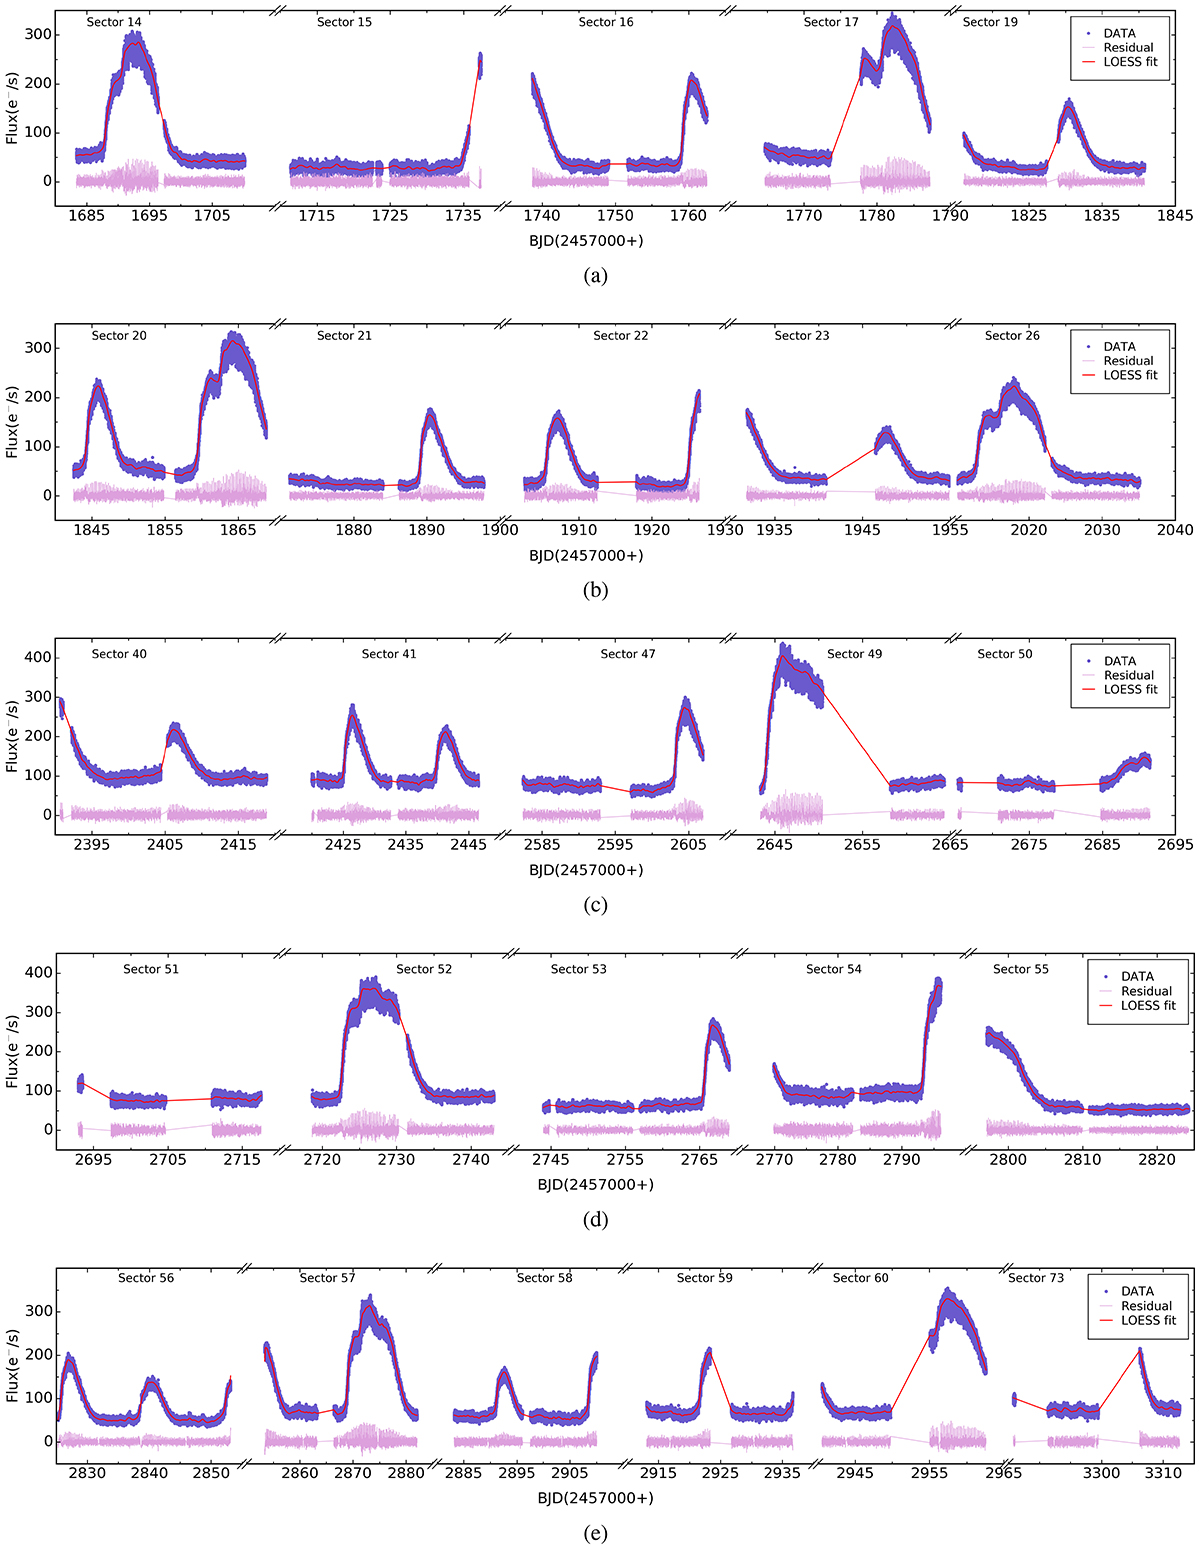
TESS light curves of V416 Dra for all 26 sectors that display outbursts and quiescence features. The solid red line represents the smoothed light curve using the LOESS fit. The light pink line is the detrended light curve by subtracting the smoothed light curve.
Current usage metrics show cumulative count of Article Views (full-text article views including HTML views, PDF and ePub downloads, according to the available data) and Abstracts Views on Vision4Press platform.
Data correspond to usage on the plateform after 2015. The current usage metrics is available 48-96 hours after online publication and is updated daily on week days.
Initial download of the metrics may take a while.