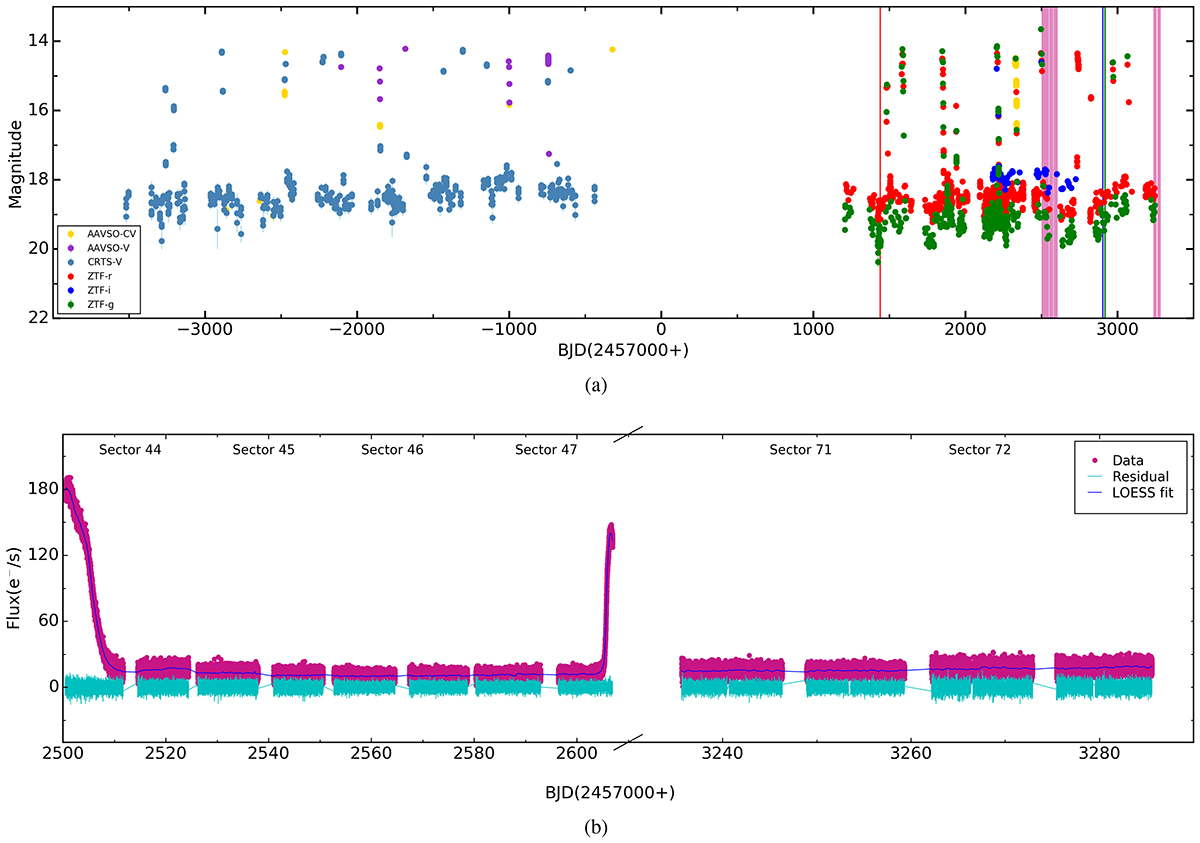
Fig. 1.
Download original image
(a) Long-term light curve of J0808. The pink shaded regions correspond to the TESS observations in each sector. The three vertical lines (red, blue, and green) represent the successive epochs of the spectroscopic observations. (b) Zoomed-in view of the TESS observations of J0808, displaying two outbursts. The solid blue line represents the smoothed light curve found using the LOESS fit. The light green line is the detrended light curve after subtracting the smoothed light curve.
Current usage metrics show cumulative count of Article Views (full-text article views including HTML views, PDF and ePub downloads, according to the available data) and Abstracts Views on Vision4Press platform.
Data correspond to usage on the plateform after 2015. The current usage metrics is available 48-96 hours after online publication and is updated daily on week days.
Initial download of the metrics may take a while.