| Issue |
A&A
Volume 688, August 2024
|
|
|---|---|---|
| Article Number | A115 | |
| Number of page(s) | 16 | |
| Section | Stellar structure and evolution | |
| DOI | https://doi.org/10.1051/0004-6361/202348968 | |
| Published online | 12 August 2024 | |
Massive star evolution with a new 12C + 12C nuclear reaction rate
The core carbon-burning phase
1
University of Strasbourg, CNRS, IPHC UMR 7178, 67000 Strasbourg, France
e-mail: This email address is being protected from spambots. You need JavaScript enabled to view it.
2
University of Strasbourg, Institute of Advanced Studies (USIAS), Strasbourg, France
3
Institut d’Astronomie et d’Astrophysique, Université Libre de Bruxelles, CP 226, 1050 Brussels, Belgium
4
Department of Astronomy, University of Geneva, Chemin Pegasi 51, 1290 Versoix, Switzerland
Received:
15
December
2023
Accepted:
7
May
2024
Abstract
Context. Nuclear reactions drive stellar evolution and contribute to stellar and galactic chemical abundances. New determinations of the nuclear reaction rates in key fusion reactions of stellar evolution are now available, paving the way for improved stellar model predictions.
Aims. We explore the impact of new 12C + 12C reaction rates in massive star evolution, structure, and nucleosynthesis at carbon ignition and during the core carbon-burning phase. We analyse the consequences for stars of different masses including rotation-induced mixing.
Methods. We computed a grid of massive stars from 8 to 30 M⊙ at solar metallicity using the stellar evolution code GENEC, and including the new reaction rates. We explored the results using three different references for the rates, with or without rotation. We studied the effect in terms of evolution, structure, and the critical mass limit between intermediate and massive stars. We explored the consequences for heavy-element nucleosynthesis during the core carbon-burning phase by means of a one-zone nucleosynthesis code.
Results. We confirm the significant impact of using the recent nuclear reaction rates following the fusion suppression hypothesis at deep sub-barrier energies (hindrance hypothesis) as well as the mass-dependent effect of a resonance at 2.14 MeV with dominant feeding of the α exit channel of 12C + 12C fusion reaction. This impacts the characteristics of the core of stars from the C-ignition and during the entire core C-burning phase (temperature and density, lifetime, size, convective or radiative core). The change in nuclear reaction rates modifies the central nucleosynthesis of the stars during the core-carbon burning phase, resulting in an underproduction of s-process elements, especially when including the rotation-induced mixing that amplifies the effects.
Conclusions. The correct and accurate determination of the nuclear reaction rates, especially with the existence and location of resonances, impacts stellar evolution in many respects, affecting models’ predictions. The choice of the nuclear reaction rates reference for the 12C + 12C fusion reaction significantly changes the behaviour of the core during the carbon-burning phase, and consequently drives changes in the nucleosynthesis and end-of-life of stars. This choice needs, then, to be made carefully in order to interpret stellar evolution from the super asymptotic giant branch phase and its massive white dwarf remnants to the core-collapse supernovae of massive stars.
Key words: nuclear reactions / nucleosynthesis / abundances / stars: abundances / stars: evolution / stars: interiors / stars: massive / stars: rotation
© The Authors 2024
 Open Access article, published by EDP Sciences, under the terms of the Creative Commons Attribution License (https://creativecommons.org/licenses/by/4.0), which permits unrestricted use, distribution, and reproduction in any medium, provided the original work is properly cited.
This article is published in open access under the Subscribe to Open model. This email address is being protected from spambots. You need JavaScript enabled to view it. to support open access publication.
1. Introduction
The question of the origin of the elements is an old problem in astrophysics. Since the pioneering work of Burbidge et al. (1957) and Cameron (1957), some global features are now well known, but others are still debated and at the heart of active research activities. Since the Big Bang, chemical abundances have been continuously evolving due to nucleosynthesis. This involves different processes with mainly nuclear fusion or particle capture and subsequent reactions, and it takes place in a variety of astrophysical sites, from stars to supernovae and merging events, or spallation reactions. The reconstruction of the chemical evolution of the Universe is complex, then, and yet to be fully understood. Since the Big Bang, stars have been the furnaces in which most of the elements heavier than lithium have been synthesised. Through their winds or at the moment of their explosion, these new elements are deposited in the interstellar medium and may serve to form new stars, planets, and their inhabitants. Stellar evolution codes have been developed to describe the evolution of stars and require a robust and accurate description of nuclear reactions (e.g. Liccardo et al. 2018; Villante & Serenelli 2021; Arcones & Thielemann 2023). In this sense, a major effort has been made by the nuclear physics community to provide to stellar modellers the most accurate nuclear reaction rates. In recent years, thanks to progress and new studies, reaction rates for fusion reactions have been measured using sophisticated approaches to reach the experimentally challenging low astrophysical energies of interest. Important progress has been made in direct and indirect methods of measurement (e.g. Bucher et al. 2015; Jiang et al. 2018; Tumino et al. 2018; Tan et al. 2020), giving access to new nuclear reaction rates for the successive fusion burning stellar evolution phases.
Aside from the commonly used Caughlan & Fowler (1988, hereafter CF88), Angulo et al. (1999, Nacre), and Xu et al. (2013, NacreII), new rates are now available or will be available in the near future (e.g. deBoer et al. 2017; Broggini et al. 2018; Ciani et al. 2021; Monpribat et al. 2022; Shen et al. 2023).
In the present paper, we focus on the nuclear fusion reaction 12C + 12C. This reaction generates a 24Mg* compound nucleus that eventually disintegrates into three main exit channels:
 (1)
(1)
For this reaction, several studies have investigated the effect of fusion hindrance (Gasques et al. 2007) or resonances with an enhanced reaction probability and particular decay pattern, applying arbitrary factors relative to the CF88 reference (Bennett et al. 2012; Pignatari et al. 2013). The 12C + 12C reaction is indeed an important nuclear reaction taking place in different astrophysical sites: the core C-burning phase (e.g. Siess 2006; Bennett et al. 2012; Pignatari et al. 2013; De Gerónimo et al. 2022), shell C-burning (e.g. Raiteri et al. 1991, 1993; The et al. 2007), white dwarf accretion and SN Ia supernovae (e.g. Saio & Nomoto 2004; Augustine et al. 2019; Wu et al. 2019), explosive nucleosynthesis (e.g. Woosley et al. 2002), and superbursts1 (e.g. Strohmayer & Brown 2002; Cooper et al. 2009).
The C-burning phase is, especially, a fundamental phase during massive stars’ evolution as the first and longest phase, during which most of the energy produced in the star is released through neutrinos and no longer through radiation (e.g. Woosley et al. 2002). This phase significantly impacts the stellar evolution and structure, and then its end-of-life (later stages of evolution will also impact the fate of massive stars; see for instance Müller et al. 2016, Chieffi et al. 2021 and Sect. 6). Having accurate nuclear reaction rates is important, then, to compute the evolution of stars, high-energy events, and to unveil the origin of the elements in the Universe.
The C-burning phase is the third fusion phase taking place in stellar evolution and C-ignition usually defines the so-called mass limit, Mup. Two other critical mass limits are important to define close to the transition between intermediate-mass stars and massive stars (≈8–10 M⊙ at solar metallicity): Mn, the minimum initial stellar mass for the formation of a neutron star resulting from an electron-capture supernovae, and Mmas, the minimum initial stellar mass for stars that will undergo all nuclear burning phases and explode as iron core collapse supernovae. Intermediate stars initially less massive than Mup leave CO white dwarf remnants, stars with masses between Mup and Mn leave either hybrid C-ONe or ONe white dwarf remnants, stars with masses between Mn and Mmas leave a neutron star, and stars more massive than Mmas leave a neutron star or a black hole (e.g. Doherty et al. 2017)2. C-ignition typically takes place for a CO core of at least 1.05 M⊙ at temperatures of 0.6–0.8 GK (Maeder & Meynet 1989; Siess 2007; Maeder 2009). Between Mup and Mmas, the core centre is generally cooler than the close off-centre (≤0.1 Mr/Mtot) because of the loss of the neutrinos. The ignition then takes place off-centre and a flame arises before propagating towards the centre depending on the temperature. It corresponds to the so-called super asymptotic giant branch (SAGB) stars that will end their lives as white dwarfs or in electron capture supernovae (see the series of papers Siess 2006, 2007, 2010, and Limongi et al. 2024).
The C-burning phase is highly dependent on the second fusion phase, the He-burning phase, during which 12C is synthesized through the triple-alpha reaction (the main reaction of the He-burning phase) and then burned into 16O at the end of the same phase through the nuclear reaction 12C(α, γ)16O. The resulting O-dominated CO core then determines the C-ignition and C-burning phase (core or off-centre), as well as the burning lifetime (from several thousand years for the less massive stars to a few hundred years for stars of 30–35 M⊙ at solar metallicity). The main products of the C-burning phase are 20Ne and 24Mg, whereas 23Na is converted into 20Ne through a 23Na(p, α)20Ne reaction, eventually forming a ONe core (or a hybrid C-ONe core for some SAGB stars) with the presence of 24Mg and 23Na at a lower abundance level. Before this phase, neutrons are produced through 22Ne(α, n)25Mg at the end of the core He-burning when the temperature is high enough and 13C(α, n)16O (at the beginning of the He-burning phase and at the end of He-burning phase when rotation-induced mixing provides fresh 13C from the H-burning shell), and some of them are captured by neutron poison elements like 16O or Fe. Reaching the C-burning phase, the resulting neutron abundance from the He-burning phase will impact the nucleosynthesis, including the core C-burning phase where new sources and new poisons will emerge, impacting the final nucleosynthesis and efficiency of the slow neutron-capture process or s-process (e.g. Pignatari et al. 2008, 2010, 2013; Frischknecht et al. 2016; Choplin et al. 2018).
In a previous paper, Monpribat et al. (2022, hereafter M22) tested these new nuclear reaction rates for two classical non-rotating models of 12 and 25 M⊙ at solar metallicity. In the present work, we aim to extend this work, exploring a larger range of stellar masses at solar metallicity, and exploring the effects of rotation as well.
In Sect. 2, we describe the input physics of the Geneva stellar evolution code (GENEC) used in this work. We present the context in which the new nuclear reaction rate determination by experimental studies for 12C + 12C takes place in Sect. 2.2. In Sect. 3, predictions from classical and rotating models at different masses are described. In Sect. 4, we explore the impact on mass limits and discuss the impact on the end-of-life of stars resulting from stellar structure changes. Finally, we describe the results of nucleosynthesis in Sect. 5, and in Sect. 6, we summarise our results, discuss model predictions, and conclude.
2. The stellar evolution code
In this work, we used the stellar evolution code GENEC described in Eggenberger et al. (2008), Ekström et al. (2012), which we refer to for details and references. We computed a grid of models at a solar metallicity of Z = 0.014 ([Fe/H] = 0), with initial masses of 8, 9, 10, 12, 15, 17, 20, 22, 25, 26, and 30 M⊙, with or without rotation. When including rotation, we considered an initial ratio of surface velocity to critical velocity of vini/vcrit = 0.4, which corresponds to the peak velocity distribution of a sample of B stars observed by Huang et al. (2010). Our models were computed from the zero-age main sequence (ZAMS) to the Ne-ignition, defined as the point at which the neon core abundance, X20Ne, has decreased by 3 × 10⁻³ (in mass fraction) compared to the X20Ne value at C-exhaustion. When models do not reach the Ne-ignition temperature of ≈1.2–1.5 GK (Maeder 2009), they were computed until the onset of the thermally pulsating phase after the C-exhaustion (defined as when X12C ≤ 10−5), or when reaching the carbon flash.
2.1. Input physics
The models presented in this work were computed with the same physics inputs (equation of state, opacities, nuclear reaction rates, grey atmosphere) as in M22 unless otherwise specified. For all models, convection was treated using the mixing length theory with a parameter, αMLT = 1.6, adjusted from model calibrations on the Sun with abundances3 from Asplund et al. (2005) and Ne enhancement following Cunha et al. (2006), in agreement with the recent works by Young (2018), Asplund et al. (2021). We assume the Schwarzschild criteria for convective stability and applied a core overshoot for stars exhibiting a convective core during their evolution (masses equal to or above 1.2 M⊙ at solar metallicity), and until the end of the He-burning phase; with an overshoot parameter, dover = 0.1 Hp, where Hp is the pressure scale height.
2.2. Nuclear reaction rates: The complex pattern of 12C + 12C
In the actual thermal conditions of C-burning in massive stars, the energies of the carbon nuclei in the 12C + 12C fusion reaction are far below the Coulomb barrier from the repelling charges. At energies around the barrier, low-lying states in 12C contribute to the reaction with the individual Q value and cross-section (Back et al. 2014). At deep sub-barrier energies, suppressed fusion was observed for many fusing nuclei (Jiang et al. 2021) and the effect in the 12C + 12C system is still under debate as precise measurements of cross-sections (below nanobarn) need to be carried out. In addition, resonance structures (strongly enhanced cross-sections) are apparent over the entire energy range explored so far. Those might indicate clustering effects in the compound system (Bohr 1936; Ikeda et al. 1968) with a possible impact on the fusion dynamics (Vogt & McManus 1960; Taras 1978; Adsley et al. 2022).
Rates for the 12C + 12C fusion reaction have been widely studied in recent years due to its complex nuclear behaviour and strong oscillations in the cross-section often attributed to 12C − 12C cluster resonances in 24Mg (Jenkins & Courtin 2015). Until now, two main features have been identified. First, a general unexpected steep fall in the cross-section at low energies attributed to the fusion-hindrance phenomenon (Jiang et al. 2004, 2007); and second, the observation of one or more resonances at different energies Spillane et al.(2007, Nippert et al. in prep.). Using the so-called Trojan horse method formalised by Mukhamedzhanov et al. (2008), Tumino et al. (2018) achieved the indirect determination of the reaction rates from 2.7 MeV to 0.8 MeV and showed a strong increase in the rates (by several orders of magnitude compared to CF88 rates) at low energies, highlighting the complexity characterising this reaction. However, several uncertainties have been highlighted by Mukhamedzhanov et al. (2019) in the use of this indirect method in the case of carbon as well as the strong sensitivity of the results to parameters and the hypothesis of the method, and these results are still debated. In parallel, direct determinations of the rates have been achieved down to low energies exhibiting the complex pattern of the 12C + 12C fusion reaction by Bucher et al. (2015), Jiang et al. (2018), Tan et al. (2020). In particular, thanks to a new direct measurement using a particle-gamma coincidence technique, the STELLA team was able to probe down to a low energy in the centre of mass of Ecm ≈ 2 MeV (Fruet et al. 2020), and determined new reliable and accurate reaction rates for 12C + 12C (M22).
A synthetic review on the very recent experimental progress in the 12C + 12C system using indirect and direct techniques can be found in, for example, Courtin et al. (2023).
In GENEC, we used the numerical tables from the NACRE compilation (Angulo et al. 1999) generated with the NextGen web interface. If not available in NACRE, rates were taken from CF88 or from nuclear reaction dedicated studies, as is described in Sect. 2.2 by Eggenberger et al. (2008) and Sect. 2.2 by Ekström et al. (2012). GENEC takes into account a network of nuclear reactions involving 32 stable and unstable species from 1H to 56Ni plus neutrons (see details in Table A.1). It allows one to track the reactions that contribute significantly to nuclear energy throughout the entire evolution and the nucleosynthesis of the main elements to be followed in the H-burning and He-burning phases. In this work, we updated the reaction rates for the 12C + 12C nuclear reaction according to M22 for the α and proton channels, and according to Bucher et al. (2015) for the neutron channel (see Eq. (1)). In the present version of GENEC, the channels are summed as a single α channel described in M22. This approximation is valid to explore the structure and general evolution of stars but it is not the case any more when focusing on nucleosynthesis (since only 20Ne is produced)4. In addition to the multi-zone stellar evolution code GENEC, we then used a one-zone nucleosynthesis code including a larger network of nuclear reactions and 736 species from 1H to 212Po (e.g. Choplin et al. 2016; Frost-Schenk et al. 2022) in order to study the potential effects of the different channels on the production of heavy elements. We note that the one-zone code does not take into account the effects of mixing. However, Choplin et al. (2016), Frost-Schenk et al. (2022) showed that injecting 13C and 14N at a rate of 2.5 × 10⁻⁷ M⊙.yr−1 (calibrated thanks to rotating stellar models computed with GENEC) to mimic the transport of these chemical species by rotational mixing was able to reproduce very well the effect of rotation-induced mixing during the He-burning phase (see their Fig. 5). In the present case, due to the short duration of the core C-burning phase (see Table 1), we assume that rotational mixing barely operates during this stage, and therefore did not inject any chemical species like above. Nevertheless, we plan to further investigate this assumption in a future work, especially regarding the convective mixing, for which the convective turnover timescale might be shorter than the nuclear burning timescale, and the case of the lowest-mass stars, for which the core C-burning lifetime reaches a few thousand years. We eventually computed GENEC models with the Caughlan & Fowler (1988, CF88) rates, within the fusion-hindrance hypothesis (HIN), and within the hindrance and resonance hypothesis (HINRES) (see M22 for details).
Core C-burning lifetime (in yr) for the different masses and nuclear reaction rates.
2.3. Angular momentum evolution and rotation-induced mixing
Stellar rotation was implemented in GENEC in the manner described by Eggenberger et al. (2008), and the shellular rotation hypothesis developed by Zahn (1992), Maeder & Zahn (1998), and Mathis & Zahn (2004) was followed to describe the differential rotation in stars. The transport of angular momentum and chemicals was driven by the combined action of meridional circulation (as an advective process for angular momentum) and turbulent shear (vertical and horizontal). Diffusion coefficients were taken from Zahn (1992) and Maeder (1997) for the horizontal diffusivity, Dh, and the vertical diffusivity, Dv, respectively.
The chemical evolution for each element, i, is described by the general diffusion equation as
![Mathematical equation: $$ \begin{aligned} \rho \frac{\partial X_i}{\partial t} = \frac{1}{r^2}\frac{\partial }{\partial r} \left(r^2 \rho D \frac{\partial X_i}{\partial r}\right)+ m_i \left[ \sum _j \lambda _{ji} - \sum _k \lambda _{ik} \right], \end{aligned} $$](/articles/aa/full_html/2024/08/aa48968-23/aa48968-23-eq2.gif) (2)
(2)
where ρ is the density; Xi refers to the mass fraction of element i; r is the radius; D = ∑jDj is the total coefficient for turbulent diffusion, written as the sum of the different diffusion coefficients, j, describing turbulent processes such as shear, or any other process; mi is the mass of nuclei i; and λij the reaction rate producing nuclei j from nuclei i.
The transport of angular momentum obeys the advection-diffusion equation:
 (3)
(3)
where ρ, r, Ω, U2, and νv are the density, the radius, the angular velocity, the radial component of the meridional circulation velocity, and the viscosity of the vertical shear turbulence, respectively. The quantities describing the rotation (U2, νv, νh) were computed at each time-step according to the formalism of Maeder & Zahn (1998) (for more details, see e.g. Sect. 2 by Decressin et al. 2009). The approach in GENEC is different from the approaches using free parameters like, for example, fμ and fc (see Nandal et al. 2024, for a detailed discussion). The explicit account in GENEC of the strong horizontal diffusion (νh) and the treatment of the transport of the angular momentum by the meridional currents through an advective equation avoids the introduction of these two free parameters. On the other hand, the precise value of νh is still uncertain and various expressions have been proposed (Zahn 1992; Maeder 2003; Mathis et al. 2004, 2018). Here, we chose the one suggested by Zahn (1992).
2.4. Mass loss
During their evolution, massive stars witness an important mass loss through stellar winds. In addition, as the star is rotating, an important amount of angular momentum is lost during the evolution of massive stars. This is a key aspect of massive stars’ evolution and several prescriptions have been proposed in the literature.
In the present study, we follow Ekström et al. (2012). In the main sequence (MS), mass loss is defined following the formula given by Vink et al. (2001), and by de Jager et al. (1988) in the uncovered domains.
Along the giant phases, we follow the formula of Reimers (1975, 1977) with η = 0.5 for stars of M ≤ 12 M⊙ and the prescription from de Jager et al. (1988) for stars of M ≥ 15 M⊙.
3. Stellar evolution: Core carbon-burning phase
In this section, we present results for classical and rotating models, exploring the impact of the new rates on the general stellar evolution, carbon-ignition, and carbon-burning (hereafter C-ignition and C-burning) characteristics, especially focusing on the dependence on the initial mass.
Figure 1 shows the evolutionary tracks in the Hertzsprung-Russell diagram for classical and rotating models of 10, 15, 17, 20, and 30 M⊙, at solar metallicity. As has already been studied by, for example, Charbonnel et al. (2008), Maeder (2009), Jones et al. (2013), Chieffi & Limongi (2013), Ekström (2021), varying the mass and/or considering rotation lead to very different physical characteristics for stars, from the colder intermediate-mass stars (≈8 M⊙) to the hotter and more luminous massive stars (≈30 M⊙) of our grid.
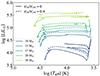 |
Fig. 1. Evolutionary tracks in the Hertzsprung-Russell diagram for classical models (full lines) and rotating models (dashed lines) of 10, 15, 17, 20, and 30 M⊙. |
3.1. Classical models
We first focused on classical non-rotating models; that is, models that include only convective transport as an internal transport process (a core overshoot was also applied to all models). We explored the direct effect of changing the nuclear reaction rates’ reference on the core, and on the C-burning lifetime. Figure 2 shows the central temperature (TC) as a function of the central density (ρC) for stars of 15, 20, and 30 M⊙ (see also stars of 12, 17, and 22 M⊙ in Fig. B.1). The models of our grid predict that stars ≤8 M⊙ do not ignite carbon, stars > 10 M⊙ ignite carbon in their centres, and stars between 9 and 10 M⊙ ignite carbon off-centre (see e.g. the classical 10 M⊙ in Fig. B.2). They are consequently not shown here and will be discussed in Sect. 4.2. For stars with an initial mass of 12 M⊙ or more, as was observed in M22, the HIN models (and at a lower level the HINRES models) predict higher temperatures and densities in the burning core than for CF88. This is due to the equilibrium re-adjustment of the star, in consequence of the lower cross-sections (as also predicted in e.g. Bennett et al. 2012; Pignatari et al. 2013). This trend is observed for each mass, with a clear shift from the HIN models compared to the CF88 and HINRES models at each step of the C-burning phase.
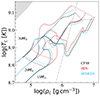 |
Fig. 2. Evolution of TC and ρC for classical models of 15, 20, and 30 M⊙ at solar metallicity, and for the three nuclear rates’ references (colour-coded). The dotted coloured lines indicate the C-ignition and core C-exhaustion for each model. The dash-dotted grey line indicates the limit between ideal gas (left) and degenerate gas (right). The shaded grey area indicates the pair instability domain, e+e−. |
For the CF88 and HINRES models, the differences are much smaller, and the change in rates affects the stars differently depending on their mass, as is observed in Figs. 2 and B.1, and illustrated by the dotted C-ignition and C-exhaustion lines. Firstly, the difference is predicted at the beginning of the core C-burning phase for stars between 12 and 20 M⊙5, and then it is again predicted at the end of the C-burning phase, especially for stars more massive than about 20 M⊙ (with a maximum difference observed for the 25 and 30 M⊙ models6).
These differences can be interpreted thanks to Fig. 3, which gives the reaction rates following the CF88, HIN, and HINRES references normalised on the CF88 rates (NA < σv> CF88). Figure 3 also gives the central temperatures reached by each model during the C-burning phase (or the maximum central temperature for stars ≤10 M⊙). It especially shows that the effect of the resonance at about 0.8–0.9 GK (log (Tc) = 8.90–8.95) is close to the temperature regime reached by the stars in our grid during their core C-burning phase.
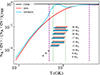 |
Fig. 3. Reactions rates following the CF88, HIN, and HINRES reference in black, red, and blue, respectively, and normalised to the CF88 rates (NA < σv> CF88). Black, red, and blue rectangles show the temperature regions where carbon fusion takes place for classical (non-rotating) models of 12, 15, 17, 20, 25, and 30 M⊙. Black triangles give the maximum central temperature reached by the 8, 9, and 10 M⊙ stars. Dotted vertical green lines indicate where the HINRES rates are 45% lower than the CF88 rates. Dashed purple lines mark the area explored by the STELLA experiment. |
In the same figure, to guide the eye, we indicate with dotted vertical green lines the temperature range in which there is less than a 45% difference between the CF88 and HINRES rates. We assume that in this range the difference is too small to significantly impact the stellar evolution or structure. This region is similar to the C-burning temperature of the 20 M⊙ stars and explains why this star is only slightly impacted by the change in nuclear reference from CF88 to HINRES rates that are close or identical in this region. As is observed in Fig. 2, the main effect of the resonance, when compared to CF88, takes place outside the dotted vertical green line zone for stars reaching colder or hotter temperatures. In other words, stars less massive than 20 M⊙ are impacted at the beginning of the C-burning phase (cold limit) and stars more massive than 20 M⊙ are impacted at the end of the C-burning phase (hot limit).
Finally, Table 1 gives the core C-burning lifetime7 as a function of the initial mass for the different nuclear rates’ references, for classical (and rotating models). As was observed in M22, the HIN models have a reduced C-burning lifetime compared to the CF88 models (≈ − 65%), and HINRES models (≈ − 15% compared to CF88). Indeed, reducing the nuclear reaction rates drives a decrease in the produced energy in the burning core. The star then re-adjusts itself to reach a new equilibrium by the contraction of the stellar core. This contraction leads to an increase in the central temperature, resulting in shorter C-burning lifetimes in HIN and HINRES models. In addition, as was already mentioned with regard to M22, the lower nuclear rates of the HIN and HINRES models lead to a delayed C-ignition at higher density. This is easily observed in Fig. 2 (dotted lines), where we can also see that this shift is stronger between CF88 and HINRES for the less massive stars due to the location of the resonance, as was already mentioned above.
This first part of the analysis about classical models confirms the general agreement on the effect of changing the nuclear reaction rates of 12C + 12C for the core C-burning phase observed by, for example, Gasques et al. (2007), Bennett et al. (2012), Pignatari et al. (2013). Lower nuclear reaction rates, like in the HIN model, lead to an increase in the temperature and density in the core in order to re-adjust the equilibrium of the star. The C-ignition is then shifted in time and to a higher temperature and density, and the C-burning phase lasts for a shorter period of time compared to the CF88 and HINRES models. In addition, differences are also observed between the CF88 and HINRES models, affecting the core conditions of stars and the behaviour of the C-burning phase. In particular, the temperature location of the resonance (≈C-burning temperatures of the 20 M⊙) is significant as it drives a mass dependence observed between the lowest-mass stars, impacted at the beginning of the C-burning phase, and the most massive stars, impacted at the end of the C-burning phase.
3.2. Evolution of rotating models
Models accounting for rotation are well known to drive important changes in model predictions due to an additional transport of both the angular momentum and the chemicals, impacting the evolution and structure of stars (e.g. Ekström 2021). The models of our grid predict that stars < 8 M⊙ do not ignite carbon, stars > 9 M⊙ ignite carbon in their centres, and stars between 8 and 9 M⊙ ignite carbon off-centre. Rotation drives in each model a slightly hotter and denser core during the evolution (see Figs. 4 and 5), resulting from an increase in the core size during the MS. C-ignition is shifted in time and the ratio of 12C over 16O when reaching the ignition is smaller8 due to the stronger efficiency of the reaction 12C(α,γ)16O at the end of a hotter He-burning phase. The C-burning lifetime is then significantly shortened compared to classical models (see Table 1) due to a smaller amount of fuel.
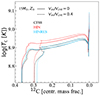 |
Fig. 4. Central temperature as a function of core 12C abundance for classical and rotating models of 15 M⊙ with different nuclear rates references (colour-coded). |
Figure 5 shows the central temperature as a function of central density with/without rotation for the 15 M⊙. From the analysis achieved for the classical models in Sect. 3.1, the general trends observed when changing the nuclear reaction rates’ reference are similar with rotation. The lower cross-sections lead to higher temperatures and densities in the centre (see Fig. 4) and to an even shorter lifetime of the C-burning phase, as is presented in Table 1 (≈ − 68% and ≈ − 18% for the HIN and HINRES model predictions, respectively).
The core C-burning temperature of each star is then shifted to hotter temperature, as is seen in Fig. 6, which gives the equivalent of Fig. 3 for rotating models. We note, in particular, that the 10 M⊙ now ignites carbon in the core when rotation is considered (see also Fig. B.2). The observations of the impact of the resonance depending on the mass are similar to the ones discussed for the classical models; that is, a different impact of the resonance depending on the mass. Due to rotation, the C-burning temperature increases. In that context, the effective core C-burning temperatures of the 17 M⊙ are close to the minimum difference of the CF88 and the HINRES rate localised by the dotted vertical green lines. Equally to the discussion of the classical models, stars lighter than ≈17 M⊙ are affected at low temperatures (cold limit) and stars heavier than ≈17 M⊙ are affected at high temperatures (hot limit). In addition, due to the temperature increase, the limit for core C-ignition is lowered in mass to 10 M⊙, which is now impacted by the resonance. However, the difference in the reaction rates’ reference does not significantly affect this ignition limit, as is discussed in Sect. 4. If C-ignition occurs, changing the rates nevertheless impacts the C-burning and chemical evolution that take place at a higher density and temperature in the HIN and HINRES models, as is observed in Fig. 5.
3.3. Chemical abundances
Changing the reaction rates in the models also has an impact on the chemical evolution predictions. From a classical model using the CF88 reference, the modification of the nuclear reaction rates, as well as the addition of rotation-induced mixing during the evolution, drive important changes in the chemical abundances of the direct C-burning products, but also in the chemical structure itself.
3.3.1. Classical versus rotating models
Figure 7 displays the abundance profiles for the 15, 20, and 30 M⊙ stars at the end of the core C-burning phase for classical (left) and rotation (right) models. When carbon is exhausted in the core, an ONe core remains with Mg at a lower level. Similar to what was already widely shown in the literature comparing classical and rotating models (e.g. Hirschi et al. 2004; Maeder 2009; Ekström 2021), we observe a systematic increase in the core size and smoother chemical transitions for each mass, as is usually observed when considering rotational mixing or turbulent transport. For the 15 M⊙ star, classical models predict Ne-dominated cores, whereas the core becomes 16O-dominated at higher mass or when including rotation. As is discussed for instance in De Gerónimo et al. (2022), due to the complexity of the nuclear reactions involved, several contributions can be the cause of such a behaviour. A first explanation of the origin of such a core is the assumption in GENEC of merging all exit channels into the 12C(12C, α)20Ne reaction, averaging over the Q values and branching ratios that sum the energies of the three channels, but this does not consider the chemical aspect. We expect, then, an overproduction of 20Ne and an underproduction of 23Na in addition to the direct contribution of 23Na(p, α)20Ne and 16O(α, γ)20Ne reactions that take place in parallel. This approximation correlates differently with the mass and with or without rotation, giving birth to this difference of core abundances between the models. This aspect will be further discussed in Sect. 5 using a one-zone nucleosynthesis code, taking into account the different exit channels and isotopes involved. A second part of the explanation comes from the mixing driven directly by rotation in the stellar core. At the end of the He-burning phase, when including rotation, the ratio of 12C over 16O is smaller. During the C-burning phase, 12C is burned and the 20Ne produced from the available 12C fuel is then less abundant in rotating models. In parallel, the 16O(α, γ)20Ne reaction tends to be less efficient at the higher temperatures predicted for rotating stars and/or more massive stars (Maeder & Meynet 1989), explaining the change in the core at the end of the C-burning phase. The abundances of the other abundant elements are not significantly modified but the structure of abundances is changed. The size and physical nature (radiative or convective temperature gradient) of the core will be further discussed in Sect. 3.3.2.
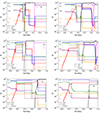 |
Fig. 7. Profiles of abundances of 1H, 4He, 12C, 16O, 20Ne, 24Mg, and 25Mg (colour-coded), at the end of the C-burning phase for the 15, 20, and 30 M⊙ stars models (from top to bottom) for different reactions rates (line-coded). Left: classical models. Right: rotating models. |
3.3.2. Impact of nuclear reaction rate references
In Fig. 7, we also compare the model predictions using the three different nuclear reaction rate references. For classical models, the change in rates does not affect the abundances in the core much, but it does affect the ones in the outer shells, especially in the 30 M⊙ model. In addition, the locations of the structural transitions between the core and the successive shells shift depending on the nuclear rates, as was already shown by M22 for the 12 and 25 M⊙ stars due to the effect on the C-burning shell size. In M22 it was noticed, for instance, that the transitions between 12C-dominant and 20Ne-dominant regions are shifted outwards (inwards) for the 25 (12) M⊙ HIN model compared to the CF88/HINRES models. This is confirmed by our results, with the first predicted transition taking place close to the classical 22 M⊙ and a second one beyond the classical 27 M⊙. In other words, for stars less massive than 22 M⊙, the 12C-dominant/20Ne-dominant transition of the CF88/HINRES models compared to the HIN models is shifted inwards, between 22 and 27 M⊙ it is shifted outward, and beyond it is shifted inwards again as the formation of the convective core itself is then impacted. At a lower level, some differences are also observed between the CF88 and HINRES predictions, especially for the classical 30 M⊙ and rotating 20 M⊙, where the Ne/C transition is shifted inwards for the HINRES model.
It shows the changes in structure and different extension of the convective zones (core and shells) depending on the mass and on the nuclear reference. This is also the conclusion from Fig. 8 that displays the maximum convective core mass as a function of the initial mass for each model during the C-burning phase. It shows that HIN models will exhibit lighter convective cores between 12 and 20 M⊙, and heavier ones beyond 20 M⊙. Models computed with the HIN reference predict the formation of a convective core up to higher initial masses than CF88 or HINRES references. In addition, the transition from a convective core to a radiative one is observed in the chemical profiles of the classical 30 M⊙ between the different nuclear cases (see Sect. and Fig. 8).
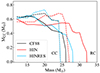 |
Fig. 8. Maximum C-burning convective core size as a function of the initial mass for classical (solid lines) and rotation (dashed lines) models for the three reaction rates references (colour-coded). CC: convective core. RC: radiative core. |
The chemical structure has changed as well in the inner regions of the star for 20Ne and 24Mg, while 25Mg is not affected much. The rotational mixing tends to smooth out these differences. These chemical differences may drive the neutron seed production and consequently impact the s-process efficiency during this phase and the following ones (see Sect. 5). Finally, surface abundances are not significantly impacted, while it is mainly the abundance structure of the star that is affected when the rates change, as a result of different temperatures and sizes of the convective C-burning core and C-burning shells when the nuclear rates change. Surface abundances are mainly the result of the rotation-induced mixing during the evolution.
4. Stellar critical mass limits
As was introduced in Sect. 1, the C-ignition and the C-burning phase are keys that will determine the end-of-life of stars. The change in core physical conditions due to the change in nuclear reaction rates is especially interesting in the context of stellar mass limits (e.g. Maeder & Meynet 1989; Maeder 2009). In the following section, we mainly focus, first, on the physical nature (convective or radiative temperature gradient) of the core, depending on the mass and rates at about 20–30 M⊙ (e.g. Pignatari et al. 2013; Chieffi et al. 2021), and second, on the so-called Mup and Mmas critical limits at the transition between intermediate and massive stars (e.g. Siess 2006; Straniero et al. 2016; De Gerónimo et al. 2022; Cinquegrana et al. 2023; Limongi et al. 2024, and reference therein).
4.1. Formation of a convective C-burning core
In addition to the core size, the effects of rotation and the change in nuclear reaction rates impact the nuclear energy flux and, in this way, the temperature gradient and the formation, or not, of a convective C-burning core (see also description in Sect. 4 by Chieffi et al. 2021). Figure 8 shows the mass limit between stars where a convective zone is formed during the core C-burning phase and stars that remain with a radiative core, for classical and rotating models (also reported in Table 1 for the present work and several references). For this analysis, we computed additional models at intermediate masses of 24, 26, 27, 28, 29, and 32 M⊙.
The main effect of decreasing the rates on the structure of stars is to shift this limit to a higher mass and change the size and mass of the convective core if formed. The mass limit to form a convective core was previously determined by, for example, Hirschi et al. (2004) at less than about 22 M⊙, between 20 and 25 M⊙ by Bennett et al. (2012), and less than 25 M⊙ by Chieffi et al. (2021), using the CF88 reference in classical models. In the present work, we determine this limit to be less than 27 M⊙, using the CF88 reference in a classical model at solar metallicity. When considering the new references, HIN and HINRES, this limit is shifted to higher masses at less than 32 M⊙ and less than 29 M⊙, for the HIN and HINRES models, respectively. This shift was expected from the higher temperatures reached by these two models compared to the CF88 (see Fig. 2). Indeed, the formation of the convective core is achieved when the nuclear energy from C-burning Enucl.C is higher than the energy lost by escaping neutrinos Eν and when Enucl.C is high enough that the radiative gradient overcomes the adiabatic one. Eν is higher at hotter temperatures and higher densities reached in the core when using the lower rates of the HIN and HINRES models, finally leading to the shift to higher masses of the convective core formation. This relative shift is consistent with previous studies that explored the other way around and showed that the use of higher nuclear rates compared to CF88 generally results in a shift of this limit to smaller masses due to colder and less dense C-burning cores (Bennett et al. 2012; Pignatari et al. 2013; Chieffi et al. 2021). In particular, Chieffi et al. (2021) determined, using the results from Tumino et al. (2018)9, this limit to be less than 21 M⊙ due to the very high measured cross-section values. When formed, the size of the core is also impacted when using different rates. We predict a convective core of ≈0.65 M⊙ and 0.53 M⊙ for the 15 and 20 M⊙ stars, respectively, using CF88. Changing the reference to HIN rates leads to smaller core sizes between 15 and 20 M⊙ (≈0.50 M⊙ for both the 15 and 20 M⊙), while giving similar results using HINRES. This is in good agreement with the result from Chieffi et al. (2021), both in terms of the absolute value of the core using the CF88 reference and in terms of the relative effects of the change in the rates: using the higher THM nuclear rates, they predict larger convective cores (≈1.00 M⊙ for the 15 M⊙) between 12 and 20 M⊙. According to the analysis by Chieffi et al. (2021), the compactness of the core is then expected to increase in HIN and HINRES models and may affect the final fate and explosiveness of these massive stars, as is also described, for example, by Ertl et al. (2016), Patton & Sukhbold (2020). We stress that the choice of the nuclear rates’ reference is consequently primordial for model predictions as it leads to significantly different results for the characteristics of the core in this mass range from using THM rates or HIN rates, the two extreme cases. It then significantly impacts the chemical evolution and structure, as well as the end-of-life of stars, already in classical models. The addition of rotation, changing the core parameters, drives a global shift to lower masses for the convective core formation, with a decrease at less than 25, 28, and 25 M⊙ for the CF88, HIN, and HINRES models, respectively. On the other hand, rotation drives the formation of larger convective cores between Mini ≈ 15–17 and ≈25 M⊙, impacting the global mixing of chemicals (see also Fig. 7).
The choice of nuclear reaction rates is shown to be important for the 12–30 M⊙ mass range, impacting the formation and size of the convective core during the C-burning phase, and consequently the chemical evolution and fate of stars. Several nuclear references are available in recent literature and the model predictions are highly dependent on the choice of reference, and consequently should take into account the nuclear uncertainties. Also, rotation makes a strong contribution to the evolution of the stellar core and should be considered to obtain more realistic predictions and results in general. On the other hand, it is always worth remembering that the prescriptions used to describe rotation in 1D stellar evolution codes like GENEC are approximations from 3D hydrodynamical simulations and that several prescriptions are available, potentially impacting the transport efficiency (e.g. Meynet et al. 2013; Dumont et al. 2021; Nandal et al. 2024). Important uncertainties remain and should be explored.
4.2. Off-centre C-ignition
In the case of the lowest-mass stars of our grid (i.e. ≤10 M⊙), our models predict no C-ignition in the centre, which is degenerate (with the exception of the 10 M⊙ with rotation), but rather off-centre (0 < Mr/Mtot ≤ 0.1), which is above the degeneracy limit, at a higher temperature. Figure 9 shows the evolution of the central temperature and central density (full lines) along with the maximum off-centre temperature and associated density (dashed lines) for classical models of 8, 9, and 10 M⊙ using the CF88 reference, as well as the 12 M⊙ star that ignites carbon in its core for comparison.
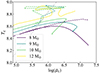 |
Fig. 9. Evolution of TC and ρC for classical models of 8, 9, 10, and 12 M⊙ stars with the CF88 reference. Dashed lines indicate the maximum off-centre temperatures and corresponding density (except for the 12 M⊙ star, for which the maximum temperature corresponds to the core). The dash-dotted grey line shows the line of degeneracy. |
Carbon burning ignites off-centre for the classical 9 and 10 M⊙ but not for the classical 8 M⊙, which stays too cold. As was discussed by, for example, Maeder & Meynet (1989), the point of maximum temperature is shifted outwards from the centre, due to the neutrino loss, and can reach the condition for C-ignition. In Fig. 9, the ignition takes place at ≈0.07Mr/Mstar and ≈0.02 Mr/Mstar for the 9 and 10 M⊙, respectively. Then, a flame arises and may propagate to the centre, allowing the usual massive star evolution (see for instance the series of paper Siess 2006, 2007, 2010). In that sense, it can be seen as a carbon flash, analogous to the well-known helium flash of low-mass stars. It is in this range of masses, between Mup and Mmas, that the so-called SAGB stars dwell. These will end their lives as electron capture supernovae, ONe white dwarfs, or in a few cases as hybrid CO-Ne white dwarfs if the flame does not reach the core (e.g. Doherty et al. 2010, 2014, 2015; Farmer et al. 2015; Limongi et al. 2024).
The limit of the off-centre C-ignition is then impacted by the nuclear reactions as the core undergoes C-ignition, and consequently it also constrains the Mup limit between asymptotic giant branch (AGB) and SAGB stars, as well as the evolution of SAGB stars and the formation of the massive white dwarfs in this mass range (e.g. Lauffer et al. 2018; De Gerónimo et al. 2022, 2023) below Mmas. The limit, Mup, is usually defined as being between 7.5 and 9 M⊙ depending on the stellar evolution codes and input physics considered (e.g. Siess 2007; Poelarends et al. 2008; Straniero et al. 2016), with a CO core of 1.1–1.3 M⊙ before C-ignition. In the present study, our classical models using the CF88 reference predict a CO core of 0.80, 1.10, and 1.25 M⊙, and our rotating models a CO core of 1.15, 1.17, and 1.70 M⊙ for the 8, 9, and 10 M⊙, respectively. The addition of rotation drives an increase in the core size for each mass, allowing the off-centre C-ignition for the 8 M⊙ and the quiescent ignition for the rotating 10 M⊙ (see Fig. B.2). These results are in agreement with previous results of the literature and mark the limit, Mup, between 9 and 10 M⊙ for classical models and 8 and 9 M⊙ for rotating models, using the CF88 reference, which is also in agreement with the critical mass for C-ignition close to the value of 1.05 M⊙ (Maeder & Meynet 1989; Siess 2007; Maeder 2009; Doherty et al. 2017; De Gerónimo et al. 2022).
Similarly to Mup, we determined the Mmas limit beyond which Ne is ignited10. From the non-rotating models, Doherty et al. (2017) obtained a value of Mmas = 11 M⊙ with a minimum ONe core mass of 1.37 M⊙ for Ne-ignition (Nomoto 1984), while Limongi et al. (2024) recently determined a smaller value of Mmas = 9.22 M⊙ with a minimum ONe core mass of 1.349 M⊙. In addition, Limongi et al. (2024) also showed that the CO core mass was more relevant and robust and determined a minimum CO core mass for Ne-ignition at 1.363 M⊙. From our models we obtained, without rotation, a Mmas limit between 11 and 12 M⊙ with an ONe core of about 1.48 M⊙ and a CO core of 1.58 M⊙ for the 12 M⊙ at Ne-ignition, and with rotation we determined the Mmas limit between 9 and 10 M⊙ with an ONe core of 1.45 and a CO core of 1.60 M⊙ for the rotating 10 M⊙ at Ne-ignition. Our results from non-rotating models are in good agreement with those by Doherty et al. (2017) and Limongi et al. (2024), although a small shift exists with the latter. We note that such a small difference is expected, as the structure is sensitive to model physics inputs such as the treatment of the overshoot.
Figure 10 shows the comparison using the three different nuclear reaction rate references for the classical 10 M⊙ star, for both core and off-centre conditions. The C-ignition takes place in each case (colour-coded crosses) and should be followed by the appearance of one or several carbon flash(es) (colour-coded dots) and the flame propagation. We note that the GENEC code cannot follow the carbon flash(es) and the flame propagation. We, consequently, focus on the analysis of the off-centre C-ignition only, while the flame propagation will be studied in a future work.
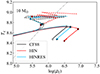 |
Fig. 10. Evolution of TC and ρC for classical models of a 10 M⊙ star with CF88, HIN, and HINRES references (colour-coded). Dashed lines indicate the maximum off-centre temperatures and associated density. Crosses and dots shows the off-centre C-ignition and beginning of flashes for each model (colour-coded). The dash-dotted grey line shows the line of degeneracy. |
The decrease in the nuclear rates results in a shift of the C-ignition to higher temperatures and densities (e.g. Gasques et al. 2007; Pignatari et al. 2013) for the HINRES and HIN models compared to the CF88 model, as was observed for non-degenerate core C-burning of more massive stars. These differences, although small, could be at the origin of different flame propagation and chemical abundances at the end of the C-burning phase. For instance, Chen et al. (2014) showed that hindrance could lead to a slight increase in Mup. However, the change in nuclear reaction rates in our models does not modify the limit between core ignition and off-centre C-ignition, or the Mup limit regarding the mass step of 1 M⊙ that we considered in our grid. It is interesting to notice as Straniero et al. (2016) found that a hypothetical narrow resonance at ≈1.4 MeV would reduce the Mup limit of about 2 M⊙ down to 5.8 M⊙. At the opposite end, HIN and HINRES models show no significant (> 1 M⊙) increase in this limit. We note that the classical and rotating 9 M⊙ (not shown) behave like the classical 10 M⊙ but at lower temperatures, and the rotating 8 M⊙ (not shown) shows only traces of C-ignition in an off-centre layer.
With the addition of rotation, the 10 M⊙ star is now igniting carbon. Figure 11 shows its abundance profiles at the end of the core C-burning phase for 1H, 4He, 12C, 16O, 20Ne, and 24Mg, with the three nuclear references. The addition of rotation-induced mixing impacts the structure and chemicals, and changes the fate of stars of the same initial mass. The addition of rotation affects the stellar evolution before reaching the C-ignition and then changes the characteristics of the core during the C-burning phase. With the exception of the rotating 10 M⊙, the lower-mass stars may end their lives as massive hybrid CO-Ne white dwarfs, or potentially, depending on the internal processes taking place in the stars, as ONe white dwarfs (e.g. Lauffer et al. 2018; De Gerónimo et al. 2022). In particular, Siess (2009), De Gerónimo et al. (2022) showed that convective boundary mixing, a strong overshoot, or thermohaline mixing during the C-burning phase leads to the halt of the carbon flame and is at the origin of the hybrid CO-Ne structure. The mass range for the formation of such a hybrid core is, however, small. Doherty et al. (2015) give a range of 0.3 M⊙ below the pure ONe white dwarfs and Mup ≈ 7 M⊙, and Farmer et al. (2015), Limongi et al. (2024) give a range of 1 M⊙ below the pure ONe white dwarfs and Mup ≈ 8 M⊙. A refined grid of models between 8 and 10 M⊙ should be realised in order re-estimate these values regarding the new reaction rates and their impact on the flame propagation, as is mentioned below.
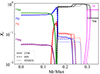 |
Fig. 11. Profiles of 1H, 4He, 12C, 16O, 20Ne, and 24Mg as a function of Mr/Mtot at the end of the core C-burning for a rotating 10 M⊙, and for the three rate references (CF88: full line, HIN: dashed line, and HINRES: dotted line). |
At the end of the C-burning phase of the rotating 10 M⊙, our models predict that 20Ne is the most abundant element in the ONe shell (the production of 23Na is not followed during the C-burning phase and its abundance stays at a very low level of X(23Na) < 10−2, not appearing in Fig. 11), as was observed by Lauffer et al. (e.g. 2018), but in contrary to results from, for example, Siess (2006), where 16O is the most abundant. As was described in the previous section, it is partly the result of the nuclear reaction network used in this work where we considered all the channels from the energetic point of view but only the reaction 12C(12C,α)20Ne for nucleosynthesis and not the reaction 12C(12C,p)23Na. It was already observed by De Gerónimo et al. (2022, see for instance their Fig. 7), who add that the α particles produced participate as well in the high abundance of 20Ne through the reaction 16O(α,γ)20Ne.
It is clear that a larger reaction network is required in order to explore further the chemical evolution of these stars, as well as the consequences for the white dwarf evolution itself. In addition, transport processes like rotation-induced mixing in the present work and/or convective boundary mixing, as is explored in De Gerónimo et al. (2022), should be considered in order to achieve more realistic chemical predictions and final fates of stars. When rotation is included, the change in nuclear reaction rates does not significantly alter the results for the 10 M⊙ but it will affect the propagation of the flame in the 9 M⊙, for instance, with especially different temperatures of the flame as well as shifted chemical transitions. These results are in agreement with De Gerónimo et al. (2023), who mentioned as well that it will lead in particular to different pulsation patterns for these white dwarfs.
5. Nucleosynthesis
The modification of the nuclear reaction rates is known to affect the stellar nucleosynthesis and final stellar abundances, especially with the neutron capture processes (e.g. Bennett et al. 2012; Pignatari et al. 2013; Frischknecht et al. 2016; Choplin et al. 2018). As is described in Sects. 2 and 3.3, we do not include a large nuclear reaction network in our stellar evolution models. In order to further explore the effect on nucleosynthesis, in particular for s-process elements, we used in a second step a one-zone code (Choplin et al. 2016) that allowed us to consider large networks (and included the three exit channels of the carbon fusion). We recall that such a code has two important limitations: the computation is done only for the centre and does not consider any transport processes like, especially, convective mixing and rotational mixing. However, as is described in Sect. 2.2, it has been shown that such a code is reliable to explore nucleosynthesis in both non-rotating and rotating models if we assume that the C-burning timescale is very short compared to the rotation mixing timescale, which is verified for the stars in our grid, as is shown in Table 1, and if we consider only the core C-burning phase (see also similar studies in the case of He-burning phase by e.g. Frost-Schenk et al. 2022; Williams et al. 2022). Here, we considered a network of 736 isotopes, which is the same as the one used to follow s-process nucleosynthesis in Frischknecht et al. (2016) and Choplin et al. (2018). In M22, similar nucleosynthesis tests were performed but with a network of 1454 isotopes. We checked that the reduced and large networks lead to very similar results (the abundance differences are less than 0.01 dex). We extracted the central temperature and density evolution tracks during the C-burning phase for each of the considered GENEC models and computed the resulting centre nucleosynthesis during the core C-burning phase, as was done in M22. We carried out the computation in four cases: 1) a CF88 reference for the three channels; 2) a HIN reference for α and proton channels plus a neutron channel by Bucher et al. (2015); 3) a HINRES reference for α and protons channels plus a neutron channel by Bucher et al. (2015); and 4) a CF88 reference for α and proton channels plus a neutron channel by Bucher et al. (2015).
5.1. Evolutionary path choice
We first explored the impact of the thermodynamic conditions on our results. An evolutionary path consists of the temperature and density trajectories extracted from the complete stellar models and corresponding to the C-burning phase in the present study. Each evolutionary path is used as an input in the one-zone code, in contrast with the study by M22 in which a unique evolutionary path from the CF88 model of a 25 M⊙ was used, as a first approximation, to compute the three different nucleosynthesis scenarios. However, we see that the change in nuclear reaction rates leads to different temperature and density paths during the C-burning phase (see Figs. 2, B.1 and B.2).
Figure 12 shows the elemental abundances at the end of the one-zone C-burning phase, corresponding to a classical 17 M⊙ model star, computed using only the CF88 path (left panel) and computed using the consistent paths in each case (right panel).
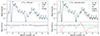 |
Fig. 12. Mass fractions at the end of the core C-burning phase of a 17 M⊙ star for three (or four) nuclear rate references (colour-coded, CF88-N refers to CF88 + neutron channel by Bucher et al. 2015). The grey line refers to the initial abundances, extracted from the CF88 GENEC model at core C-ignition. The bottom panels show the abundances normalised to the ones of the CF88 model. Left: nucleosynthesis using the same (ρ, T) path from CF88 model. Right: nucleosynthesis using the consistent (ρ, T) paths from each GENEC model. |
When using the consistent paths, the HIN and HINRES models both predict a smaller abundance for Na (under-produced by about 0.2 dex) than the CF88 model, whereas the HIN model is similar to CF88 using the CF88 path. Ne and Mg, the other main products of C-burning, are almost unaffected in every case.
Concerning the heavy elements, there is a modest production of first-peak s-elements in all models. The three main neutron sources are 13C(α, n)16O, 17O(α, n)20Ne, and 22Ne(α, n)25Mg. We checked that reducing these rates by a given factor (e.g. 1000) weakens the s-process signature, which becomes almost null if these rates are sufficiently small. The s-process production for the three models is similar when using the CF88 path (left panel), while differences of up to 0.7 dex (for Z ≃ 30) are noticed if adopting the consistent paths (right panel). In the latter case, the s-process is more efficient in the CF88 model (black), followed by the HinRes (blue) and then the Hin model (red). The maximal neutron densities are similar in these models, at about 2 − 4 × 108 cm−3. The different s-process productions can then be understood through the different neutron exposures. In these one-zone simulations, the C-burning lifetimes of the CF88, Hin, and HinRes models are 1480, 740, and 1450 yr11, respectively, with a total neutron exposure12 of 0.19, 0.13, and 0.16 mbarn−1. Ultimately, the longer the C-burning lifetime, the higher the neutron exposure and the greater the number of light s-elements produced.
We conclude that using the consistent path to compute the nucleosynthesis has a non-negligible impact.
In the right panel of Fig. 12, we also consider a fourth case exploring the impact of the new rates determined by Bucher et al. (2015) for the neutron channel, while keeping the CF88 reference for α and proton exit channels (green pattern). Due to its comparably high Q value, and hence energy threshold, this channel does not involve significant changes in the stellar structure of the models in the presented mass range, but could impact the s-process efficiency increasing the neutron density at high temperatures. However, we see that it does not affect the nucleosynthesis of the 17 M⊙ star during the core C-burning phase (changes of ≈0.01 dex at most). Additional tests, for higher masses or during the shell C-burning, at higher temperatures, might be more relevant concerning this specific channel (e.g. Pignatari et al. 2013) and will be explored in a future study.
5.2. Nucleosynthesis with rotational-induced mixing
In this part, we explore the effect of adding rotation that drives an internal mixing, changing the temperature and density path and abundances all along the evolution. Upon C-ignition, abundances are consequently different in rotating models and can drive a different nucleosynthesis. As was described above, the approximation of the one-zone model is less robust in that case as the rotation-induced mixing is not considered any more during the C-burning phase. Nevertheless, the C-burning timescale is smaller than the rotational mixing timescale, as is explained in Sect. 2.2. This means that rotation is not expected to significantly alter the structure of the star during this stage. The approximation then remains valid at the first order. The main approximation remains that a one-layer model does not capture all the complexity of multi-zone stellar models. Figure 13 shows the abundances at the end of the core C-burning phase for the 17 and 20 M⊙ stars with (dotted lines) and without rotation (full lines) for the three nuclear references (colour-coded).
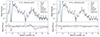 |
Fig. 13. Same as Fig. 12 but for the 17 (left panel) and 20 M⊙ models (right panel), without (solid lines) and with rotation (dotted lines), and using dedicated paths. |
Including rotation in the 17 M⊙ model weakens the s-process signature, no matter the nuclear rate reference (Fig. 13, left panel). This is again explained by the different C-burning lifetimes in these one-zone simulations. Overall, the central temperature during core C-burning is higher with rotation (Figs. 3 and 6). It reaches 1.17 and 1.24 GK in the non-rotating and rotating 17 M⊙ models, respectively. In our one-zone model, the carbon is therefore burnt quicker in the rotating case, leading to a shorter C-burning lifetime, and therefore a smaller neutron exposure. When including rotation in the 17 M⊙ models, the neutron exposures are 1.7, 1.9, and 1.6 times smaller than when rotation is not included, for the CF88, HIN, and HINRES models, respectively. This explains the smaller production of s-process elements for rotating models in Fig. 13.
The differences are less important when considering the (ρ, T) paths of the 20 M⊙ models (Fig. 13, right panel). The one-zone C-burning lifetimes of these six models range between about 145 and 500 yr, and the neutron exposures between 0.06 and 0.09 mbarn−1. This eventually results in a similar production of s-process elements.
5.3. Discussion
According to the results of the one-zone code, it is clear that the effects of rotation and of the choice of nuclear rates have a significant impact on the nucleosynthesis of the stars, especially for masses close to 17 M⊙, with a general underproduction of elements. While the change in the abundances is almost always weaker than 1 dex, it is nevertheless not negligible and exhibits an interesting mass dependence, with higher differences in the lowest-mass stars of 15–17 M⊙, where the rates are the most different, than in the more massive 20–25–30 M⊙ (not shown).
For light elements, the main changes concern Na, which is slightly affected, while Mg, and Ne are not affected much. Also, as is discussed in Sect. 3.3 about the dominant element in the core, we note that considering a more complete set of nuclear reactions, with notably the three exit channels of the 12C + 12C reaction, the abundances of 16O and 20Ne are similar in the core of each classical model, whereas the core is always 16O-dominated in rotating models. The abundance of 23Na remains at a mass fraction of about 10−2 for each model prediction, close to the predicted values in the full stellar GENEC models, which do not follow 23Na. In parallel, it is worth mentioning that the s-process elements are affected by the nuclear reaction rates and by the rotation. Compared to the CF88 model, the lightest s-process elements are underproduced by about 0.5 and 0.2 dex in the HIN and HINRES models, respectively (Fig. 13, left panel). Including rotation reduces the production of light s-process elements by typically 0.2 − 0.5 dex. In Fig. 13 (left panel), a peak is observed at Z = 29, which corresponds to an underproduction of light s-process elements by ≈0.5 − 1.0 dex for the HIN and the HINRES rotating models compared to the CF88 non-rotating reference case.
The further exploration of s-process element nucleosynthesis, especially during the next phases of stellar evolution (that especially modify the core composition) and at different masses, is promising for a future study in that context. The study of nucleosynthesis in shells will be the subject of a forthcoming study. In addition, we stress again that complete multi-zone stellar models including complex processes like convection may affect the picture and should be tested in view of these results.
6. Summary and outlook
We computed models of massive non-rotating and rotating stars that include a new nuclear reaction rate reference for the 12C + 12C fusion reaction. We explore two recent nuclear references according to the hypothesis of the hindrance phenomenon (HIN model) and taking into account the presence of a resonance in the astrophysics region of interest (HINRES model), and we compare the results to the commonly used CF88 reference. We confirm that the change in the nuclear reaction rate reference is impacting stars in the present studied mass range (8–30 M⊙), with an increase (decrease) in the temperature and density with the decrease (increase) in the cross-section and nuclear reaction rates. In particular, HIN and HINRES models show shorter C-burning lifetimes compared to CF88 models. Interestingly, we highlight that stars are differently affected depending on their mass, especially in the case of the HINRES model, which assumes a resonance localised in temperature. The resonance location results in more important changes at the beginning of the C-burning phase of the lowest-mass stars and at the end of the C-burning phase for the most massive stars in our grid, as is observed in Fig. 2, with a transition close to 20 M⊙ for classical models and close to 17 M⊙ for rotating models.
We explore two important mass range areas: 1) The mass range between 8 and 10 M⊙, close to the Mup and Mmas critical mass limits, and 2) the maximum mass for which a convective core is formed. In the first case, we find that the new rates are not changing significantly the predicted value of Mup ≈ 9 − 10 M⊙ and Mmas ≈ 10 − 12 M⊙. However, for stars igniting carbon off-centre, the ignition occurs at a higher temperature and density in the HIN models than in the HINRES ones, themselves taking place at a higher temperature and density than in the CF88 models. We cannot follow the carbon flash in the current version of GENEC but we stress that the change in core and off-centre conditions, when changing the nuclear reaction rates, might impact the flame characteristics, as was suggested by De Gerónimo et al. (2023). The change in the rates is consequently significant for the definition of the critical mass limits. It is also a new constraint on the mass range, driving the formation of hybrid CO-Ne core white dwarfs in place of ONe white dwarfs (between 8 and 10 M⊙), which should be further explored.
In the second case, we demonstrate that the choice of rates has an important impact on the threshold for the formation of a convective core during the C-burning phase. Comparing the results by Chieffi et al. (2021) using THM (Trojan horse method) rates with our results using HIN rates, we obtain a difference of more than 10 M⊙ (from about 20 M⊙ to about 32 M⊙, respectively, in classical models), with the HINRES rates giving an intermediate value. We emphasise that the impact on the compactness and explosiveness is highly dependent on the choice of nuclear reaction rates and that this choice will impact the final fate of stars as well as the composition of the supernova ejecta (see for instance the relation between the CO core evolution and stellar remnants by Patton & Sukhbold 2020).
We advise that the intermediate value of 24 M⊙ predicted by our rotating HINRES models is the most reliable value. Indeed, it is based on the most realistic input physics, including rotation, and a nuclear model that shows the greatest similarities with the direct experimental results.
The stellar structural changes also impact the chemical abundances in stars in both the HIN and the HINRES models compared to the original CF88 reference. This is mainly due to the change in the convective core and shell size during evolution. Three initial mass regions can be identified for the C-burning core, from rotating (classical) models: a first one at less than ≈22 M⊙ (≈20 M⊙) where the CF88 and HINRES models exhibit larger convective cores than the HIN models; a second region between ≈22 M⊙ and ≈24 M⊙ (≈20 M⊙ and ≈27 M⊙) where the HIN models exhibit larger convective cores than the CF88 and HINRES models; and finally a third region where the convective core is not formed for the CF88 and HINRES models compared to the HIN models. A similar prediction is obtained for the carbon burning shells resulting in different chemical structures.
The combination of rotation-induced mixing and new rates also impacts, then, the nucleosynthesis and, especially, the production of s-process elements. The main production of s-elements is predicted during the core He-burning and shell C-burning phases, but a non-negligible contribution, although small, is also expected from the core C-burning phase. Due to mixing, part of the produced s-elements will contribute to the abundances outside the core (Pignatari et al. 2013). The remaining s-elements in the core will then be destroyed during the next phases of evolution and the final explosion, contributing to the p-process (the s-process elements will be the seeds of the p-process, e.g. Rayet et al. 1995; Rauscher et al. 2002; Arnould & Goriely 2003; Choplin et al. 2022). At the end of the core C-burning phase, an underproduction of s-process elements is predicted in the HIN models. The same effect is observed at a lower level in the HINRES models, compared to the CF88 models. This is mainly due to the lower burning lifetimes in these models decreasing the neutron exposure. Interestingly, we observe an important dependence on the mass for the level of the underproduction. Also, the rotational-induced mixing accentuates the differences between the models.
New rate determinations of several important nuclear reactions have been made in recent years for the successive nuclear H-, He-, and C-burning fusion phases of stellar evolution, especially by the team of LUNA (Broggini et al. 2018). The update of the reaction rates could have an impact as it will impact the production or depletion of abundant elements like C and O, of light elements like Li, Be, and B (Rapisarda et al. 2021), and also the abundances of s-process elements that depend on the neutron density along evolution. The prediction of the 12C abundance at the end of the He-burning phase, which determines the C-burning phase, would, for instance, have the benefit of reducing the uncertainties over the fundamental reaction 12C(α, γ)16O (e.g. Imbriani et al. 2001; Pignatari et al. 2013; deBoer et al. 2017). In addition, it has to be mentioned that several uncertainties were not considered in this work. On the nuclear side, the branching ratio between the channels changes with energies or temperatures, which should increase the mass dependence. It was already shown by Pignatari et al. (2013) that changing the ratio between α and the proton channel results in significant changes. On the stellar modelling side, we assume and explore only one rotation prescription and only one rotation velocity for all masses, but the prescription choice is still today a matter of debate (especially the shear coefficients, see for instance Meynet et al. 2013; Dumont et al. 2021).
In the near future, we plan to explore the consequences during the shell C-burning, known to be a main contributor of s-element production (e.g. Raiteri et al. 1991, 1993; The et al. 2007). In addition, the impact of multiple resonances on the 12C+12C reaction measured by the STELLA experiment (Nippert et al., in prep.), as well as new data from recent and planned measurements on 12C+16O and 16O+16O nuclear reactions (Yakovlev et al. 2006; Jiang et al. 2007, 2011; Duarte et al. 2015; Fang et al. 2017) should be explored to improve predictions about the final stages in the evolution and fate of stars.
Finally, we stress that a better understanding of how the nuclear reaction rates are measured, as well as their uncertainties and potential improvements, should be taken into account when choosing the nuclear reaction rate reference in stellar evolution codes.
Likely due to thermonuclear flashes occurring at the surface of neutron stars.
As was mentioned in the reference, many names are given for the different mass limits: Mup = MCO, Mn = MEC, and Mmas = Mup′ = Mup*
We use initial abundances for H and He as X = 0.720 and Y = 0.266 from the same calibration.
An updated version of GENEC will be used in a future work to account for the different channels self-consistently along evolution. However, the computation time will be increased significantly and cannot be currently used for a full grid of models as presented here.
For instance, at C-ignition: the 15 M⊙ model predicts an increase of +0.01 dex (≈0.014 GK) and +0.13 dex in log(Tc) and log(ρc), respectively; the 17 M⊙ model predicts an increase of +0.015 dex (≈0.022 GK) and +0.06 dex in log(Tc) and log(ρc), respectively.
The 30 M⊙ model (not shown for sake of clarity) predicts an increase of +0.22 dex (≈0.065 GK) and −0.04 dex in log(Tc) and log(ρc), respectively, at C-exhaustion (X12C < 10−5).
The core C-burning lifetime is defined between the C-ignition (defined when X12C decreased by 0.003 in the centre after He-exhaustion) and the C-exhaustion (defined when X12C < 10−5).
We note that this ratio also depends on the initial mass with a smaller ratio for more massive stars with larger central temperatures.
Trojan horse indirect determination of the cross-sections for the 12C + 12C fusion reaction.
In order to explore this mass limit we extended our grid with two additional models of 11 M⊙ with or without rotation and CF88 reference.
In our one-zone model, at each time-step, the central 12C abundance extracted from complete stellar models is used to fix the corresponding temperature and density. The time evolution is not based on full stellar models, explaining the different C-burning lifetimes compared to full models (cf. Table 1). Nevertheless, the duration of the C-burning phase follows the same trends when adopting different nuclear references.
The neutron exposure τ is computed as τ = ∫Nn(t) vT(t) dt where Nn is the neutron density and  the neutron thermal velocity with kB the Boltzmann constant, T(t) the temperature at time t, and mn the neutron mass.
Acknowledgments
This work was supported by the European Union (ChETEC-INFRA, project no. 101008324). The authors thank L. Siess and S. Martinet for helpful discussions, and the anonymous referee for constructive and helpful comments on the manuscript. T.D. thanks K. Sieja for financial support for travel, J. Kerutt for helpful discussions, and the Department of Astronomy of the University of Geneva for access to numerical resources. A.C. is a Postdoctoral Researcher of the Fonds de la Recherche Scientifique – FNRS. S.E. and G.M. acknowledge the support from the European Research Council (ERC) under the European Union’s Horizon 2020 research and innovation programme (grant agreement No 833925, project STAREX). This research has made use of NASA’s Astrophysics Data System Bibliographic Services.
References
- Adsley, P., Heine, M., Jenkins, D., et al. 2022, Phys Rev Lett, 129, 102701 [NASA ADS] [CrossRef] [Google Scholar]
- Angulo, C., Arnould, M., Rayet, M., et al. 1999, Nucl. Phys. A, 656, 3 [Google Scholar]
- Arcones, A., & Thielemann, F.-K. 2023, A&A Rev., 31, 1 [NASA ADS] [CrossRef] [Google Scholar]
- Arnould, M., & Goriely, S. 2003, Phys. Rep., 384, 1 [Google Scholar]
- Asplund, M., Grevesse, N., & Sauval, A. J. 2005, ASP Conf. Ser., 336, 25 [Google Scholar]
- Asplund, M., Amarsi, A. M., & Grevesse, N. 2021, A&A, 653, A141 [NASA ADS] [CrossRef] [EDP Sciences] [Google Scholar]
- Augustine, C. N., Willcox, D. E., Brooks, J., Townsley, D. M., & Calder, A. C. 2019, ApJ, 887, 188 [CrossRef] [Google Scholar]
- Back, B., Esbensen, H., Jiang, C., & Rehm, K. 2014, Rev Mod Phys, 86, 317 [NASA ADS] [CrossRef] [Google Scholar]
- Bennett, M. E., Hirschi, R., Pignatari, M., et al. 2012, MNRAS, 420, 3047 [NASA ADS] [CrossRef] [Google Scholar]
- Bohr, N. 1936, Nature, 137, 344 [NASA ADS] [CrossRef] [Google Scholar]
- Broggini, C., Bemmerer, D., Caciolli, A., & Trezzi, D. 2018, Prog. Part. Nucl. Phys., 98, 55 [CrossRef] [Google Scholar]
- Bucher, B., Tang, X. D., Fang, X., et al. 2015, Phys. Rev. C, 114, 251102 [NASA ADS] [Google Scholar]
- Burbidge, E. M., Burbidge, G. R., Fowler, W. A., & Hoyle, F. 1957, Rev. Mod. Phys., 29, 547 [NASA ADS] [CrossRef] [Google Scholar]
- Cameron, A. G. W. 1957, PASP, 69, 201 [NASA ADS] [CrossRef] [Google Scholar]
- Caughlan, G. R., & Fowler, W. A. 1988, At. Data Nucl. Data Tables, 40, 283 [NASA ADS] [CrossRef] [Google Scholar]
- Charbonnel, C., Zahn, J.-P., & Siess, L. 2008, Eur. Astron. Soc. Publ. Ser., 32, 131 [Google Scholar]
- Chen, M. C., Herwig, F., Denissenkov, P. A., & Paxton, B. 2014, MNRAS, 440, 1274 [NASA ADS] [CrossRef] [Google Scholar]
- Chieffi, A., & Limongi, M. 2013, ApJ, 764, 21 [Google Scholar]
- Chieffi, A., Roberti, L., Limongi, M., et al. 2021, ApJ, 916, 79 [NASA ADS] [CrossRef] [Google Scholar]
- Choplin, A., Maeder, A., Meynet, G., & Chiappini, C. 2016, A&A, 593, A36 [NASA ADS] [CrossRef] [EDP Sciences] [Google Scholar]
- Choplin, A., Hirschi, R., Meynet, G., et al. 2018, A&A, 618, A133 [NASA ADS] [CrossRef] [EDP Sciences] [Google Scholar]
- Choplin, A., Goriely, S., Hirschi, R., Tominaga, N., & Meynet, G. 2022, A&A, 661, A86 [CrossRef] [EDP Sciences] [Google Scholar]
- Ciani, G. F., Csedreki, L., Rapagnani, D., et al. 2021, Phys. Rev. C, 127, 152701 [NASA ADS] [Google Scholar]
- Cinquegrana, G. C., Joyce, M., & Karakas, A. I. 2023, MNRAS, 525, 3216 [NASA ADS] [CrossRef] [Google Scholar]
- Cooper, R. L., Steiner, A. W., & Brown, E. F. 2009, ApJ, 702, 660 [NASA ADS] [CrossRef] [Google Scholar]
- Courtin, S., Heine, M., Monpribat, E., & Nippert, J. 2023, J. Phys.: Conf. Ser., 2586, 012114 [Google Scholar]
- Cunha, K., Hubeny, I., & Lanz, T. 2006, ApJ, 647, L143 [NASA ADS] [CrossRef] [Google Scholar]
- deBoer, R. J., Görres, J., Wiescher, M., et al. 2017, Rev. Mod. Phys., 89, 035007 [NASA ADS] [CrossRef] [Google Scholar]
- Decressin, T., Mathis, S., Palacios, A., et al. 2009, A&A, 495, 271 [NASA ADS] [CrossRef] [EDP Sciences] [Google Scholar]
- De Gerónimo, F. C., Miller Bertolami, M. M., Plaza, F., & Catelan, M. 2022, A&A, 659, A150 [NASA ADS] [CrossRef] [EDP Sciences] [Google Scholar]
- De Gerónimo, F. C., Miller Bertolami, M. M., Catelan, M., & Battich, T. 2023, ArXiv e-prints [arXiv:2303.00060] [Google Scholar]
- de Jager, C., Nieuwenhuijzen, H., & van der Hucht, K. A. 1988, A&AS, 72, 259 [NASA ADS] [Google Scholar]
- Doherty, C. L., Siess, L., Lattanzio, J. C., & Gil-Pons, P. 2010, MNRAS, 401, 1453 [NASA ADS] [CrossRef] [Google Scholar]
- Doherty, C. L., Gil-Pons, P., Lau, H. H. B., Lattanzio, J. C., & Siess, L. 2014, MNRAS, 437, 195 [Google Scholar]
- Doherty, C. L., Gil-Pons, P., Siess, L., Lattanzio, J. C., & Lau, H. H. B. 2015, MNRAS, 446, 2599 [Google Scholar]
- Doherty, C. L., Gil-Pons, P., Siess, L., & Lattanzio, J. C. 2017, PASA, 34, e056 [NASA ADS] [CrossRef] [Google Scholar]
- Duarte, J. G., Gasques, L. R., Oliveira, J. R. B., et al. 2015, J. Phys. G: Nucl. Part. Phys., 42, 065102 [Google Scholar]
- Dumont, T., Palacios, A., Charbonnel, C., et al. 2021, A&A, 646, A48 [EDP Sciences] [Google Scholar]
- Eggenberger, P., Meynet, G., Maeder, A., et al. 2008, Ap&SS, 316, 43 [Google Scholar]
- Ekström, S. 2021, Front. Astron. Space Sci., 8, 53 [Google Scholar]
- Ekström, S., Georgy, C., Eggenberger, P., et al. 2012, A&A, 537, A146 [Google Scholar]
- Ertl, T., Janka, H. T., Woosley, S. E., Sukhbold, T., & Ugliano, M. 2016, ApJ, 818, 124 [NASA ADS] [CrossRef] [Google Scholar]
- Fang, X., Tan, W. P., Beard, M., et al. 2017, Phys. Rev. C, 96, 045804 [CrossRef] [Google Scholar]
- Farmer, R., Fields, C. E., & Timmes, F. X. 2015, ApJ, 807, 184 [NASA ADS] [CrossRef] [Google Scholar]
- Frischknecht, U., Hirschi, R., Pignatari, M., et al. 2016, MNRAS, 456, 1803 [Google Scholar]
- Frost-Schenk, J., Adsley, P., Laird, A. M., et al. 2022, MNRAS, 514, 2650 [NASA ADS] [CrossRef] [Google Scholar]
- Fruet, G., Courtin, S., Heine, M., et al. 2020, Phys. Rev. C, 124, 192701 [Google Scholar]
- Gasques, L. R., Brown, E. F., Chieffi, A., et al. 2007, Phys. Rev. C, 76, 035802 [CrossRef] [Google Scholar]
- Hirschi, R., Meynet, G., & Maeder, A. 2004, A&A, 425, 649 [NASA ADS] [CrossRef] [EDP Sciences] [Google Scholar]
- Huang, W., Gies, D. R., & McSwain, M. V. 2010, ApJ, 722, 605 [Google Scholar]
- Ikeda, K., Takigawa, N., & Horiuchi, H. 1968, Suppl Prog Theo Phys, E68, 464 [NASA ADS] [CrossRef] [Google Scholar]
- Imbriani, G., Limongi, M., Gialanella, L., et al. 2001, ApJ, 558, 903 [NASA ADS] [CrossRef] [Google Scholar]
- Jenkins, D., & Courtin, S. 2015, J. Phys. G: Nucl. Part. Phys., 42, 034010 [NASA ADS] [CrossRef] [Google Scholar]
- Jiang, C. L., Rehm, K. E., Janssens, R. V., et al. 2004, Phys. Rev. C, 93, 012701 [Google Scholar]
- Jiang, C. L., Rehm, K. E., Back, B. B., & Janssens, R. V. F. 2007, Phys. Rev. C, 75, 015803 [CrossRef] [Google Scholar]
- Jiang, C. L., Back, B. B., Esbensen, H., et al. 2011, J. Phys. Conf. Ser., 312, 042011 [Google Scholar]
- Jiang, C. L., Santiago-Gonzalez, D., Almaraz-Calderon, S., et al. 2018, Phys. Rev. C, 97, 012801 [NASA ADS] [CrossRef] [Google Scholar]
- Jiang, C., Back, B., Rehm, K., et al. 2021, Eur. Phys. J. A, 57, 235 [CrossRef] [Google Scholar]
- Jones, S., Hirschi, R., Nomoto, K., et al. 2013, ApJ, 772, 150 [NASA ADS] [CrossRef] [Google Scholar]
- Lauffer, G. R., Romero, A. D., & Kepler, S. O. 2018, MNRAS, 480, 1547 [NASA ADS] [CrossRef] [Google Scholar]
- Liccardo, V., Malheiro, M., Hussein, M. S., Carlson, B. V., & Frederico, T. 2018, Eur. Phys. J. A, 54, 221 [NASA ADS] [CrossRef] [Google Scholar]
- Limongi, M., Roberti, L., Chieffi, A., & Nomoto, K. 2024, ApJS, 270, 29 [NASA ADS] [CrossRef] [Google Scholar]
- Maeder, A. 1997, A&A, 321, 134 [NASA ADS] [Google Scholar]
- Maeder, A. 2003, A&A, 399, 263 [NASA ADS] [CrossRef] [EDP Sciences] [Google Scholar]
- Maeder, A. 2009, Physics, Formation and Evolution of Rotating Stars (Springer Berlin Heidelberg) [Google Scholar]
- Maeder, A., & Meynet, G. 1989, A&A, 210, 155 [Google Scholar]
- Maeder, A., & Zahn, J.-P. 1998, A&A, 334, 1000 [NASA ADS] [Google Scholar]
- Mathis, S., & Zahn, J. P. 2004, A&A, 425, 229 [NASA ADS] [CrossRef] [EDP Sciences] [Google Scholar]
- Mathis, S., Palacios, A., & Zahn, J. P. 2004, A&A, 425, 243 [NASA ADS] [CrossRef] [EDP Sciences] [Google Scholar]
- Mathis, S., Prat, V., Amard, L., et al. 2018, A&A, 620, A22 [NASA ADS] [CrossRef] [EDP Sciences] [Google Scholar]
- Meynet, G., Ekstrom, S., Maeder, A., et al. 2013, in Models of Rotating Massive Stars: Impacts of Various Prescriptions, eds. M. Goupil, K. Belkacem, C. Neiner, F. Lignières, & J. J. Green, 865, 3 [Google Scholar]
- Monpribat, E., Martinet, S., Courtin, S., et al. 2022, A&A, 660, A47 [CrossRef] [EDP Sciences] [Google Scholar]
- Mukhamedzhanov, A. M., Blokhintsev, L. D., Irgaziev, B. F., et al. 2008, J. Phys. G Nucl. Phys., 35, 014016 [Google Scholar]
- Mukhamedzhanov, A. M., Pang, D. Y., & Kadyrov, A. S. 2019, Phys. Rev. C, 99, 064618 [NASA ADS] [CrossRef] [Google Scholar]
- Müller, B., Viallet, M., Heger, A., & Janka, H.-T. 2016, ApJ, 833, 124 [CrossRef] [Google Scholar]
- Nandal, D., Meynet, G., Ekström, S., et al. 2024, A&A, 684, A169 [NASA ADS] [CrossRef] [EDP Sciences] [Google Scholar]
- Nomoto, K. 1984, ApJ, 277, 791 [NASA ADS] [CrossRef] [Google Scholar]
- Patton, R. A., & Sukhbold, T. 2020, MNRAS, 499, 2803 [NASA ADS] [CrossRef] [Google Scholar]
- Pignatari, M., Gallino, R., Meynet, G., et al. 2008, ApJ, 687, L95 [Google Scholar]
- Pignatari, M., Gallino, R., Heil, M., et al. 2010, ApJ, 710, 1557 [Google Scholar]
- Pignatari, M., Hirschi, R., Wiescher, M., et al. 2013, ApJ, 762, 31 [NASA ADS] [CrossRef] [Google Scholar]
- Poelarends, A. J. T., Herwig, F., Langer, N., & Heger, A. 2008, ApJ, 675, 614 [Google Scholar]
- Raiteri, C. M., Busso, M., Gallino, R., & Picchio, G. 1991, ApJ, 371, 665 [NASA ADS] [CrossRef] [Google Scholar]
- Raiteri, C. M., Gallino, R., Busso, M., Neuberger, D., & Kaeppeler, F. 1993, ApJ, 419, 207 [CrossRef] [Google Scholar]
- Rapisarda, G., Lamia, L., Caciolli, A., et al. 2021, Front. Astron. Space Sci., 7 [Google Scholar]
- Rauscher, T., Heger, A., Hoffman, R. D., & Woosley, S. E. 2002, ApJ, 576, 323 [Google Scholar]
- Rayet, M., Arnould, M., Hashimoto, M., Prantzos, N., & Nomoto, K. 1995, A&A, 298, 517 [Google Scholar]
- Reimers, D. 1975, Mem. Soc. Roy. Sci. Liege, 8, 369 [Google Scholar]
- Reimers, D. 1977, A&A, 61, 217 [NASA ADS] [Google Scholar]
- Saio, H., & Nomoto, K. 2004, ApJ, 615, 444 [NASA ADS] [CrossRef] [Google Scholar]
- Shen, Y., Guo, B., deBoer, R. J., et al. 2023, ApJ, 945, 41 [NASA ADS] [CrossRef] [Google Scholar]
- Siess, L. 2006, A&A, 448, 717 [NASA ADS] [CrossRef] [EDP Sciences] [Google Scholar]
- Siess, L. 2007, A&A, 476, 893 [NASA ADS] [CrossRef] [EDP Sciences] [Google Scholar]
- Siess, L. 2009, A&A, 497, 463 [NASA ADS] [CrossRef] [EDP Sciences] [Google Scholar]
- Siess, L. 2010, A&A, 512, A10 [NASA ADS] [CrossRef] [EDP Sciences] [Google Scholar]
- Spillane, T., Raiola, F., Rolfs, C., et al. 2007, Phys. Rev. C, 98, 122501 [Google Scholar]
- Straniero, O., Piersanti, L., & Cristallo, S. 2016, J. Phys. Conf. Ser., 665, 012008 [Google Scholar]
- Strohmayer, T. E., & Brown, E. F. 2002, ApJ, 566, 1045 [NASA ADS] [CrossRef] [Google Scholar]
- Tan, W. P., Boeltzig, A., Dulal, C., et al. 2020, Phys. Rev. C, 124, 192702 [Google Scholar]
- Taras, P. 1978, AIP Conf. Proc., 47, 234 [CrossRef] [Google Scholar]
- The, L.-S., El Eid, M. F., & Meyer, B. S. 2007, ApJ, 655, 1058 [Google Scholar]
- Tumino, A., Spitaleri, C., La Cognata, M., et al. 2018, Nature, 557, 687 [CrossRef] [PubMed] [Google Scholar]
- Villante, F. L., & Serenelli, A. 2021, Front. Astron. Space Sci., 7, 112 [Google Scholar]
- Vink, J. S., de Koter, A., & Lamers, H. J. G. L. M. 2001, A&A, 369, 574 [NASA ADS] [CrossRef] [EDP Sciences] [Google Scholar]
- Vogt, E., & McManus, H. 1960, Phys. Rev. Lett., 4, 518 [NASA ADS] [CrossRef] [Google Scholar]
- Williams, M., Laird, A. M., Choplin, A., et al. 2022, Phys. Rev. C, 105 [CrossRef] [Google Scholar]
- Woosley, S. E., Heger, A., & Weaver, T. A. 2002, Rev. Mod. Phys., 74, 1015 [NASA ADS] [CrossRef] [Google Scholar]
- Wu, C., Wang, B., & Liu, D. 2019, MNRAS, 483, 263 [CrossRef] [Google Scholar]
- Xu, Y., Takahashi, K., Goriely, S., et al. 2013, Nucl. Phys. A, 918, 61 [Google Scholar]
- Yakovlev, D. G., Gasques, L. R., Afanasjev, A. V., Beard, M., & Wiescher, M. 2006, Phys. Rev. C, 74, 035803 [NASA ADS] [CrossRef] [Google Scholar]
- Young, P. R. 2018, ApJ, 855, 15 [Google Scholar]
- Zahn, J. P. 1992, A&A, 265, 115 [NASA ADS] [Google Scholar]
Appendix A: Nuclear network
List of elements and isotopes considered in the models computed by the present version of the GENEC stellar evolution code. Neutrons are also considered.
Appendix B: Core evolution predictions
Figure B.1 shows the central temperature as a function of central density for additional models to Fig 2 with the classical 12, 17, and 22 M⊙, using the three different nuclear reaction rates described in the present paper: CF88, HIN, and HINRES.
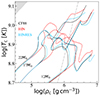 |
Fig. B.1. Evolution of TC and ρC for classical models of 12, 17, and 22 M⊙ at solar metallicity, and for the three nuclear rate references (colour-coded). The dash-dotted grey line indicates the limit between ideal gas (left) and degenerate gas (right). The shaded grey area indicates the pair instability domain, e+ e−. |
Figure B.2 gives the central temperature as a function of central density for classical and rotating models of a 10 M⊙, using different nuclear reaction rate references. Classical models predict an off-centre C-ignition, while rotating models, which are hotter, predict a non-degenerate core C-ignition.
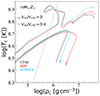 |
Fig. B.2. Evolution of TC and ρC for classical (full line) and rotation (dashed line) models of the 10 M⊙ at solar metallicity, and for the three nuclear rate references (colour-coded). The dashed grey line indicates the limit between ideal gas (left) and degenerate gas (right). |
All Tables
Core C-burning lifetime (in yr) for the different masses and nuclear reaction rates.
List of elements and isotopes considered in the models computed by the present version of the GENEC stellar evolution code. Neutrons are also considered.
All Figures
|
Fig. 1. Evolutionary tracks in the Hertzsprung-Russell diagram for classical models (full lines) and rotating models (dashed lines) of 10, 15, 17, 20, and 30 M⊙. |
| In the text | |
|
Fig. 2. Evolution of TC and ρC for classical models of 15, 20, and 30 M⊙ at solar metallicity, and for the three nuclear rates’ references (colour-coded). The dotted coloured lines indicate the C-ignition and core C-exhaustion for each model. The dash-dotted grey line indicates the limit between ideal gas (left) and degenerate gas (right). The shaded grey area indicates the pair instability domain, e+e−. |
| In the text | |
|
Fig. 3. Reactions rates following the CF88, HIN, and HINRES reference in black, red, and blue, respectively, and normalised to the CF88 rates (NA < σv> CF88). Black, red, and blue rectangles show the temperature regions where carbon fusion takes place for classical (non-rotating) models of 12, 15, 17, 20, 25, and 30 M⊙. Black triangles give the maximum central temperature reached by the 8, 9, and 10 M⊙ stars. Dotted vertical green lines indicate where the HINRES rates are 45% lower than the CF88 rates. Dashed purple lines mark the area explored by the STELLA experiment. |
| In the text | |
|
Fig. 4. Central temperature as a function of core 12C abundance for classical and rotating models of 15 M⊙ with different nuclear rates references (colour-coded). |
| In the text | |
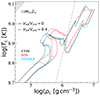 |
Fig. 5. Same as Fig 2 but for classical and rotating models of a 15 M⊙ star. |
| In the text | |
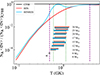 |
Fig. 6. Same as Fig. 3 but for rotating models. The 10 M⊙ now ignites carbon in the core. |
| In the text | |
|
Fig. 7. Profiles of abundances of 1H, 4He, 12C, 16O, 20Ne, 24Mg, and 25Mg (colour-coded), at the end of the C-burning phase for the 15, 20, and 30 M⊙ stars models (from top to bottom) for different reactions rates (line-coded). Left: classical models. Right: rotating models. |
| In the text | |
|
Fig. 8. Maximum C-burning convective core size as a function of the initial mass for classical (solid lines) and rotation (dashed lines) models for the three reaction rates references (colour-coded). CC: convective core. RC: radiative core. |
| In the text | |
|
Fig. 9. Evolution of TC and ρC for classical models of 8, 9, 10, and 12 M⊙ stars with the CF88 reference. Dashed lines indicate the maximum off-centre temperatures and corresponding density (except for the 12 M⊙ star, for which the maximum temperature corresponds to the core). The dash-dotted grey line shows the line of degeneracy. |
| In the text | |
|
Fig. 10. Evolution of TC and ρC for classical models of a 10 M⊙ star with CF88, HIN, and HINRES references (colour-coded). Dashed lines indicate the maximum off-centre temperatures and associated density. Crosses and dots shows the off-centre C-ignition and beginning of flashes for each model (colour-coded). The dash-dotted grey line shows the line of degeneracy. |
| In the text | |
|
Fig. 11. Profiles of 1H, 4He, 12C, 16O, 20Ne, and 24Mg as a function of Mr/Mtot at the end of the core C-burning for a rotating 10 M⊙, and for the three rate references (CF88: full line, HIN: dashed line, and HINRES: dotted line). |
| In the text | |
|
Fig. 12. Mass fractions at the end of the core C-burning phase of a 17 M⊙ star for three (or four) nuclear rate references (colour-coded, CF88-N refers to CF88 + neutron channel by Bucher et al. 2015). The grey line refers to the initial abundances, extracted from the CF88 GENEC model at core C-ignition. The bottom panels show the abundances normalised to the ones of the CF88 model. Left: nucleosynthesis using the same (ρ, T) path from CF88 model. Right: nucleosynthesis using the consistent (ρ, T) paths from each GENEC model. |
| In the text | |
|
Fig. 13. Same as Fig. 12 but for the 17 (left panel) and 20 M⊙ models (right panel), without (solid lines) and with rotation (dotted lines), and using dedicated paths. |
| In the text | |
|
Fig. B.1. Evolution of TC and ρC for classical models of 12, 17, and 22 M⊙ at solar metallicity, and for the three nuclear rate references (colour-coded). The dash-dotted grey line indicates the limit between ideal gas (left) and degenerate gas (right). The shaded grey area indicates the pair instability domain, e+ e−. |
| In the text | |
|
Fig. B.2. Evolution of TC and ρC for classical (full line) and rotation (dashed line) models of the 10 M⊙ at solar metallicity, and for the three nuclear rate references (colour-coded). The dashed grey line indicates the limit between ideal gas (left) and degenerate gas (right). |
| In the text | |
Current usage metrics show cumulative count of Article Views (full-text article views including HTML views, PDF and ePub downloads, according to the available data) and Abstracts Views on Vision4Press platform.
Data correspond to usage on the plateform after 2015. The current usage metrics is available 48-96 hours after online publication and is updated daily on week days.
Initial download of the metrics may take a while.