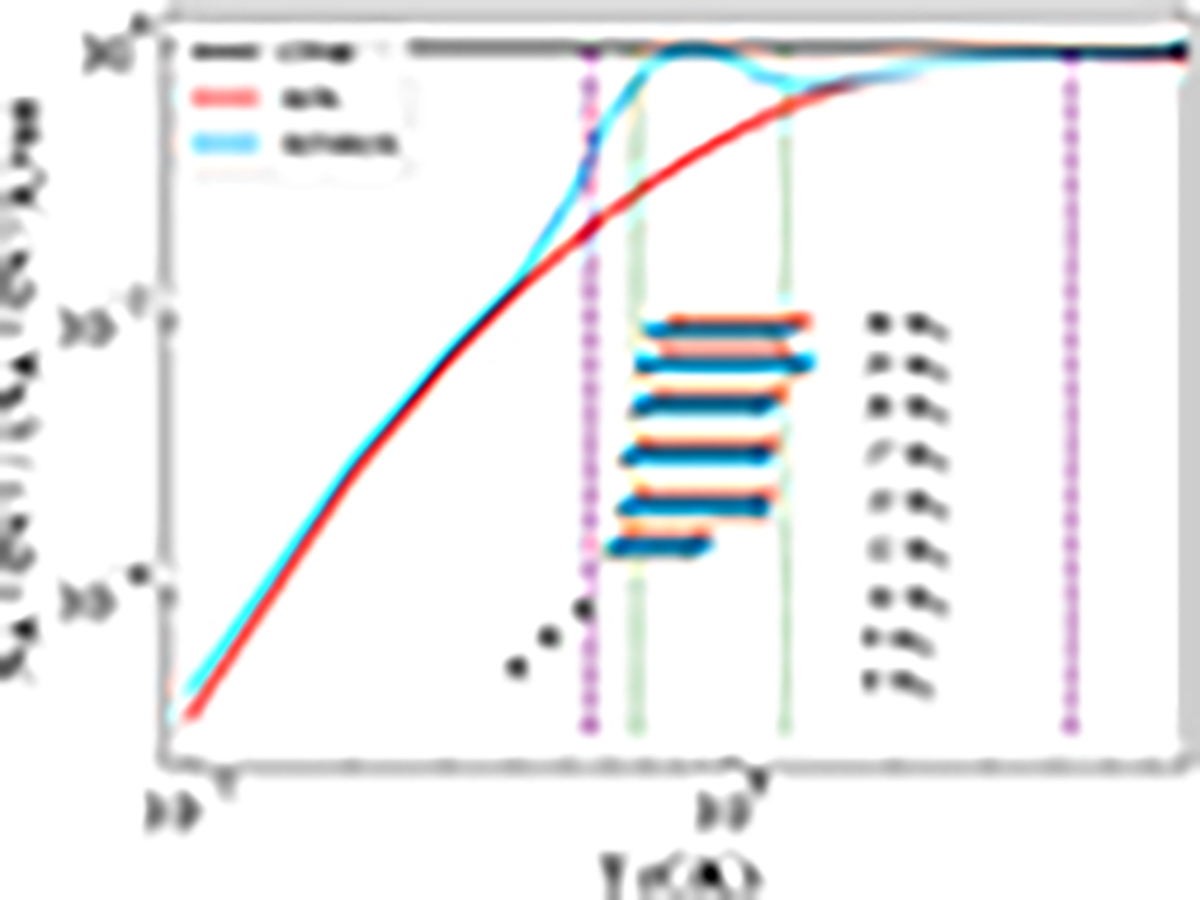
Fig. 3.
Download original image
Reactions rates following the CF88, HIN, and HINRES reference in black, red, and blue, respectively, and normalised to the CF88 rates (NA < σv> CF88). Black, red, and blue rectangles show the temperature regions where carbon fusion takes place for classical (non-rotating) models of 12, 15, 17, 20, 25, and 30 M⊙. Black triangles give the maximum central temperature reached by the 8, 9, and 10 M⊙ stars. Dotted vertical green lines indicate where the HINRES rates are 45% lower than the CF88 rates. Dashed purple lines mark the area explored by the STELLA experiment.
Current usage metrics show cumulative count of Article Views (full-text article views including HTML views, PDF and ePub downloads, according to the available data) and Abstracts Views on Vision4Press platform.
Data correspond to usage on the plateform after 2015. The current usage metrics is available 48-96 hours after online publication and is updated daily on week days.
Initial download of the metrics may take a while.