Open Access
Fig. B.1.
Download original image
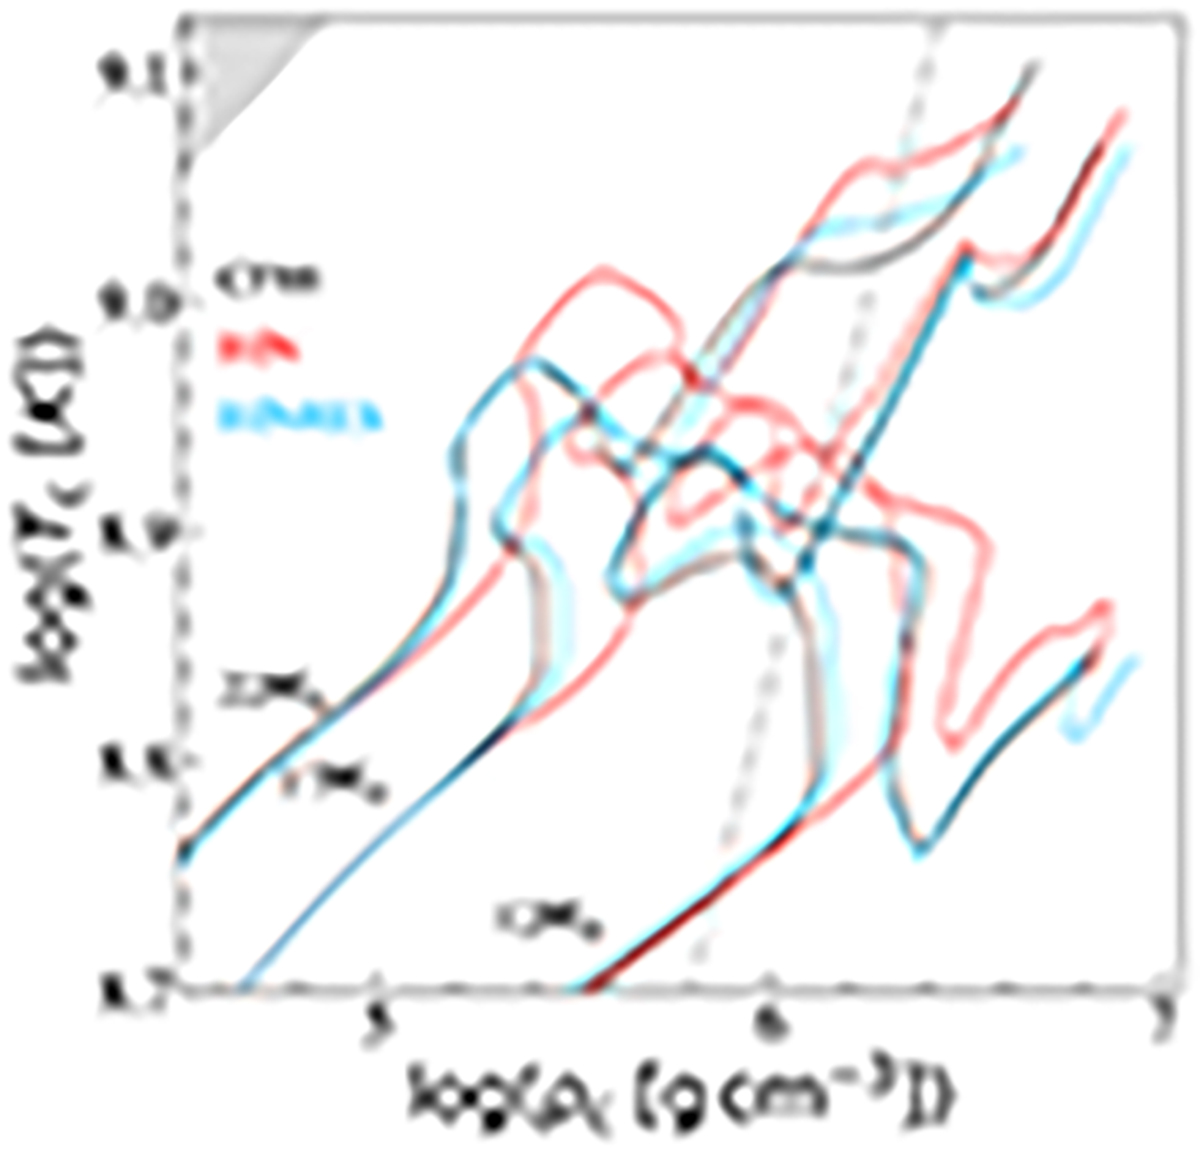
Evolution of TC and ρC for classical models of 12, 17, and 22 M⊙ at solar metallicity, and for the three nuclear rate references (colour-coded). The dash-dotted grey line indicates the limit between ideal gas (left) and degenerate gas (right). The shaded grey area indicates the pair instability domain, e+ e−.
Current usage metrics show cumulative count of Article Views (full-text article views including HTML views, PDF and ePub downloads, according to the available data) and Abstracts Views on Vision4Press platform.
Data correspond to usage on the plateform after 2015. The current usage metrics is available 48-96 hours after online publication and is updated daily on week days.
Initial download of the metrics may take a while.