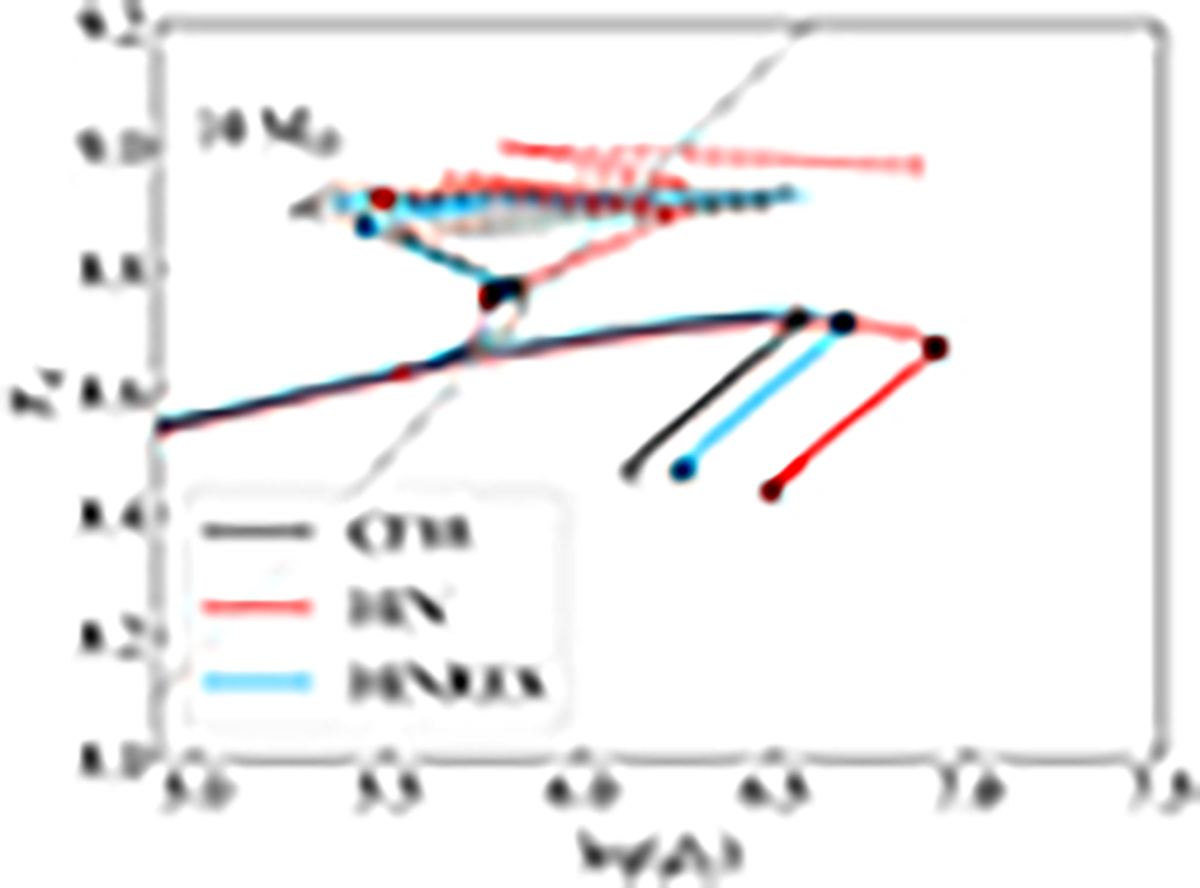
Fig. 10.
Download original image
Evolution of TC and ρC for classical models of a 10 M⊙ star with CF88, HIN, and HINRES references (colour-coded). Dashed lines indicate the maximum off-centre temperatures and associated density. Crosses and dots shows the off-centre C-ignition and beginning of flashes for each model (colour-coded). The dash-dotted grey line shows the line of degeneracy.
Current usage metrics show cumulative count of Article Views (full-text article views including HTML views, PDF and ePub downloads, according to the available data) and Abstracts Views on Vision4Press platform.
Data correspond to usage on the plateform after 2015. The current usage metrics is available 48-96 hours after online publication and is updated daily on week days.
Initial download of the metrics may take a while.