| Issue |
A&A
Volume 687, July 2024
|
|
|---|---|---|
| Article Number | A78 | |
| Number of page(s) | 14 | |
| Section | Planets and planetary systems | |
| DOI | https://doi.org/10.1051/0004-6361/202449554 | |
| Published online | 01 July 2024 | |
Sublimation of volatiles from H2O:CO2 bulk ices in the context of comet 67P/Churyumov–Gerasimenko
II. Noble gases★
1
Space Research & Planetary Sciences, Physics Institute, University of Bern,
Sidlerstrasse 5,
3012
Bern,
Switzerland
e-mail: This email address is being protected from spambots. You need JavaScript enabled to view it.
2
Center for Space and Habitability, University of Bern,
Gesellschaftsstrasse 6,
3012
Bern,
Switzerland
3
Faculty of Aerospace Engineering, Delft University of Technology,
Delft,
The Netherlands
e-mail: This email address is being protected from spambots. You need JavaScript enabled to view it.
Received:
9
February
2024
Accepted:
15
April
2024
Abstract
Context. The ROSINA instrument on board the Rosetta spacecraft measured, among others, the outgassing of noble gases from comet 67P/Churyumov–Gerasimenko. The interpretation of this dataset and unravelling underlying desorption mechanisms requires detailed laboratory studies.
Aims. We aim to improve our understanding of the desorption patterns, trapping, and fractionation of noble gases released from the H2O:CO2-dominated ice of comet 67P.
Methods. In the laboratory, ice films of neon, argon, krypton, or xenon (Ne, Ar, Kr, and Xe) mixed in CO2:H2O were prepared at 15 K. Temperature-programmed desorption mass spectrometry is employed to analyse the desorption behaviour of the noble gases. Mass spectrometric ROSINA data of 67P were analysed to determine the fraction of argon associated with CO2 and H2O, respectively.
Results. CO2 has a significant effect on noble gas desorption behaviour, resulting in the co-release of noble gases with CO2, decreasing the amount of noble gas trapped within water, shifting the pure phase noble gas peak desorption temperature to lower temperatures, and prolonging the trapping of neon. These effects are linked to competition for binding sites in the water ice and the formation of crystalline CO2. Desorption energies of the pure phase noble gas release were determined and found to be higher than those previously reported in the literature. Enhancement of the Ar/Kr and Ar/Xe ratios are at best 40% and not significantly influenced by the addition of CO2. Analysis of ROSINA mass spectrometric data shows that the fraction of argon associated with H2O is 0.53 ± 0.30, which cannot be explained by our laboratory results.
Conclusions. Multicomponent ice mixtures affect the desorption behaviour of volatiles compared to simple binary mixtures and experiments on realistic cometary ice analogues are vital to understanding comet outgassing.
Key words: solid state: volatile / methods: laboratory: molecular / methods: laboratory: solid state / comets: individual: 67P/Churyumov–Gerasimenko
This paper is dedicated to the memory of Harold Linnartz, dear mentor and colleague.
© The Authors 2024
 Open Access article, published by EDP Sciences, under the terms of the Creative Commons Attribution License (https://creativecommons.org/licenses/by/4.0), which permits unrestricted use, distribution, and reproduction in any medium, provided the original work is properly cited.
This article is published in open access under the Subscribe to Open model. This email address is being protected from spambots. You need JavaScript enabled to view it. to support open access publication.
1 Introduction
The elemental and molecular composition of planetary bodies can be used to reveal their historical chemical and physical evolution (e.g. Lunine et al. 2004; Marcq et al. 2018; Altwegg et al. 2019). However, distinguishing between the influence of chemical and physical processes is often challenging. This has made noble gas atoms a preferred tracer of physical processes, as these closed-shell species with filled valence orbitals have very low chemical reactivity. Only in the heavily irradiated diffuse interstellar medium and planetary nebulae have naturally occurring molecular ions of noble gases been identified (e.g. ArH+, HeH+; Schilke et al. 2014; Güsten et al. 2019; Jacob et al. 2020; Neufeld et al. 2020). Therefore, noble gas atoms are a unique diagnostic tool to trace past and present physical processes (e.g. thermal, radioactive decay, and implantation) on planetary bodies.
The noble gas content of meteorites and lunar and asteroidal samples have extensively been studied in Earth-based laboratories (e.g. Ott 2002, 2014; Wieler & Heber 2003; Okazaki et al. 2022) and for several objects such as the Moon, Venus, Mars, Jupiter, and Titan, in situ measurements are available (e.g. Wieler 2002; Ozima & Podosek 2002; Niemann et al. 2010). Noble gas abundances vary significantly between objects and solar values (Asplund et al. 2009; Lodders et al. 2009; Marty et al. 2016). Several processes cause elemental noble gas fractionation (that is, the enhancement of the ratio of one species over the other), such as atmospheric escape and mantle erosion (Lammer et al. 2020). Another suggestion is that comets and low-temperature planetesimals were responsible for setting noble gas abundances in the atmospheres of various Solar System bodies (Owen et al. 1992, 1999, 2001). In this case, the noble gas abundance is the direct result of the delivery or acquisition rate of comets and planetesimals and the noble gas abundances contained in these objects.
While the characterisation of noble gases in comets is of interest, their detection has proven challenging. Only for the particularly bright comet C/1995 O1 Hale-Bopp has its argon abundance been constrained with remote sensing techniques (Stern et al. 2000). A more detailed picture could only be established by ESA’s Rosetta mission, which studied comet 67P/Churyumov-Gerasimenko (67P hereafter). Rosetta accompanied 67P for 2 yr and measured volatile atoms and molecules released from its surface with the Rosetta Orbiter Spectrometer for Ion and Neutral Analysis (ROSINA) mass spectrometry instrument suite (Balsiger et al. 2007). This included detections of argon, krypton, and xenon isotopes (Balsiger et al. 2015; Marty et al. 2017; Rubin et al. 2018), together with a host of major (e.g. H2O and CO2) and minor (e.g. N2 and CH4) volatile molecular contributions (Rubin et al. 2019). Neon was not detected in 67P down to a level of ≤5×10⁻⁸ Ne/H2O, compared to Ar/H2O = 5.8×10⁻⁶, Kr/H2O = 4.9×10⁻⁷, and Xe/H2O =2.4×10⁻⁷. Cometary noble gas ratios were determined to be 36Ar/132 Xe = 79.8 ± 19.3 and 36Ar/84Kr = 17.1 ± 3.9 (Rubin et al. 2018) and differ significantly from the solar values, which are approximately 36Ar/132Xe = 1540 and 36Ar/84Kr = 15700 (Lodders et al. 2009; Asplund et al. 2009). The noble gases incorporated into comet 67P are thus heavily fractionated.
Noble gas fractionation in cometary and interstellar ice analogues has been extensively studied in the laboratory (Bar-Nun et al. 1985; Laufer et al. 1987; Notesco et al. 1991, 2003; Yokochi et al. 2012; Ninio Greenberg et al. 2017; Almayrac et al. 2022; Schneiderman 2022). These studies focus on adsorption and trapping of noble gases at different temperatures, ice thicknesses, deposition rates, mixing ratios, and gas compositions. The condensation temperature has a particularly prominent effect on noble gas fractionation. Deposition at elevated temperatures of 30–80 K (that is, higher than interstellar ice temperatures of 10–20 K, Herbst & Van Dishoeck 2009) results in limited adsorption of the more volatile noble gases such as neon and argon. In contrast, the heavier noble gases krypton and xenon remain unaffected, thus enhancing their ratios compared to those in the gas mixture. However, a high-temperature condensation scenario of comets is problematic. Cometary ice is thought to at least partially be inherited from a pre-stellar phase (Drozdovskaya et al. 2019; Altwegg et al. 2019; Hänni et al. 2022; Müller et al. 2022) and H2O ice is thought to primarily have formed on cold (≤20 K) dust grains in the interstellar medium (Van Dishoeck et al. 2013). Therefore, a condensation scheme at elevated temperatures first requires the removal of ice by heating dust grains or larger objects to at least 150 K (the sublimation temperature of H2O, Minissale et al. 2022). This must be followed by cooling of the rocky material to a temperature of ≤80 K, without the gas reservoir (that is, the sublimated ice mantles) adsorbing. This step is irreconcilable with the fact that H2O starts adsorbing at temperatures of 150 K. Furthermore, it is unclear what happens with the gas that does not adsorb at 80 K (e.g. Ne, Ar) and why these species would not freeze out at lower temperatures to form a layer of pure volatiles as the object cools down. Finally, freeze-out of H2O at high temperatures results in crystalline ice, which is less efficient in adsorbing and trapping volatile molecules than amorphous ice.
For the above reasons, in this study, we experimentally investigate the noble gas fractionation and trapping behaviour in 67P-analogue ice condensed at a low temperature (that is, 15 K) and during thermal processing. The bulk material of the mixtures consists of H2O and CO2. The effect of CO2 on the adsorption, trapping, and fractionation of noble gases has only been studied to a limited extent (Ninio Greenberg et al. 2017). The methods are described in Sec. 2 and experimental results are presented in Sect. 3. Our findings are discussed and put into context in Sec. 4. Conclusions are given in Sec. 5.
2 Methods
2.1 Laboratory equipment and protocol
Experiments are conducted with the ICEBEAR setup (Kipfer et al. 2024b). The methods and protocol used in Kipfer et al. (2024a) have also been used for this study. In short, gas mixtures are prepared in a gas mixing system by admixing components. First, the noble gas or mixtures of noble gases is introduced to the mixture, followed by water vapour, and, when relevant, carbondioxide gas. Neon (Ne, Carbagas, 99.999%), argon (Ar, Messer, 99.999%), krypton (Kr, Carbagas, 99.999%), xenon (Xe, Carbagas, 99.999%), and a pre-prepared 1:1:1:1 mixture (Carbagas, 99.999%) of these four noble gases are used, as well as, carbon dioxide (CO2, 99.995%, Messer) and MilliQ-grade water (H2O). Air contaminants (that is, O2, N2) are removed from the water by applying multiple freeze-thaw-pump cycles. A gas-independent gauge monitors the pressure in the gas mixing system and is used to determine the volume mixing ratios, which are assumed to be the same for the ice film. Next, the gas mixture is introduced into the setup via a high-precision leak valve. In the vacuum chamber of the setup, a copper sample holder is cooled by a cryostat to 15 K and gases freeze out on this surface. In all cases, the background deposition pressure is 4×10⁻⁶ mbar and the deposition time is 333 s, which results in ice films of approximately 1000 Langmuire (L, 1.33 mbar s−1 or 1 Torr s−1 = 1L). We assume that 1L equals 1 monolayer (ML, 1 ML = 1015 cm−2) and these two terms are used interchangeably. A Quadrupole Mass Spectrometer (QMS) records the mass-over-charge (m/z) of all noble gases, CO2, H2O, and possible contaminants (e.g. H2, O2, N2), including their isotopes and fragments. After deposition, the system is left to pump for at least 20 min to clear out any gases remaining in the chamber from the background deposition. Finally, temperature-programmed desorption (TPD) is started and the sample surface is heated at a rate of 2 K min−1 from 15 K to at least 240 K. During the TPD, the pressure, temperature, m/z, and amounts of desorbing species are recorded. For each noble gas, mixtures of H2O:CO2:noble gas at 1000:0:5, 1000:100:5, and 1000:200:5 were deposited. One experiment is conducted at 1000:100:5 ratio, where not a single noble gas is used, but a pre-prepared noble gas mixture at a 1:1:1:1 ratio. An overview of the conducted experiments can be found in Table A.1.
2.2 Laboratory data analysis
Our QMS measurements are affected by an electron current-pressure effect (see Kipfer et al. 2024a). This means that at low pressure (≤ 10−7 mbar), the ratio between electrons emitted by the QMS electron filament and the number of gas particles entering the ionisation region is too large and results in enhanced fragmentation and double ionisation. In turn, this means the fragmentation pattern varies with the pressure until a high enough pressure (≥10−7 mbar) is reached where the pattern remains stable. We calibrate for this effect by measuring every component of our gas mixtures at incremental pressure steps and creating a calibration curve. Each fragment is corrected at each current measured with the QMS, which is a function of the pressure in the chamber, to its stable fragmentation pattern (Fx(I)). This correction is applied in all data presented in this manuscript and more details can be found in Appendix B. It is important to note that for neon no correction was necessary, because the fragmentation pattern (that is, Ne++/Ne+ ratio) remained constant over the pressure range of our experiments.
The TPD traces are used to verify the mixing ratios of the ice, by determining the ratio from the integrated areas of the individual components. The same methods as in Kipfer et al. (2024a) are used, which take fragmentation pattern and electron ionisation cross-section into account. For the species of interest to this study, the cross sections at 70 eV are σNe = 0.5 Å2, σAr = 3.1 Å2, σKr = 4.9 Å2, σXe = 8.2 Å2, ![Mathematical equation: $\[\sigma_{\mathrm{CO}_2}\]$](/articles/aa/full_html/2024/07/aa49554-24/aa49554-24-eq1.png) = 3.521 Å2, and
= 3.521 Å2, and ![Mathematical equation: $\[\sigma_{\mathrm{H}_2 \mathrm{O}}\]$](/articles/aa/full_html/2024/07/aa49554-24/aa49554-24-eq2.png) = 2.275 Å2. Noble gas cross sections are adopted from Bartlett & Stelbovics (2002), while those of CO2 and H2O are taken from the NIST database1.
= 2.275 Å2. Noble gas cross sections are adopted from Bartlett & Stelbovics (2002), while those of CO2 and H2O are taken from the NIST database1.
2.3 Rosetta/ROSINA at comet 67P
The European Space Agency’s Rosetta mission followed comet 67P between the beginning of August 2014 and the end of September 2016. Rosetta carried out detailed measurements of the nucleus and its surroundings (Taylor et al. 2017) while the comet travelled inbound from more than 3.5 au to perihelion at 1.24 au and then outbound to almost 4 au again. 67P is a Jupiter-family comet with a 6.4-yr orbital period. Its bi-lobate shape, combined with a 52-degree obliquity of the spin axis with respect to the orbital plane (Sierks et al. 2015), leads to a complex illumination pattern and pronounced seasonal as well as diurnal outgassing patterns (Hässig et al. 2015).
On board Rosetta was the instrument suite ROSINA (Balsiger et al. 2007) which consisted of the two mass spectrometers DFMS (Double Focusing Mass Spectrometer) and RTOF (Reflectron-type Time-of-Flight) as well as the pressure/density gauge COPS (COmet Pressure Sensor). DFMS and RTOF were used to derive local relative gas abundances and COPS provided the corresponding absolute density. Data from either mass spectrometer combined with COPS yields absolute abundances of the volatile species detected at the location of Rosetta (for details, see Rubin et al. 2019).
Cometary outgassing is driven by solar insolation and the corresponding sublimation of ice in the surface layer of the nucleus. The three ROSINA sensors all have large fields-of-view which encompass the whole nucleus for most of the time. As a result, the measured gas may originate from various locations which are subject to different insolation and hence varying temperature and erosion patterns. The activity, that is, outgassing behaviour over time, of 67P showed a common heliocentric distance-dependence, being strongest about two weeks after perihelion (Hansen et al. 2016; Läuter et al. 2020; Combi et al. 2020) while being lower before and after. The enhanced outgassing during the months around perihelion and the associated dust activity required Rosetta to back off to farther distances from the nucleus. As a result, close distances to the surface <10 km were only possible early and late in the mission.
3 Results
3.1 Laboratory data
The left column of Fig. 1 shows an overview of the argon, krypton, xenon, and neon TPD traces measured for this study. For argon, krypton, and xenon, four prominent features are visible. Moving from low to high temperatures, the first peak is associated with the release of noble gas in a pure phase, meaning that these atoms are mostly bound to each other and directly on the (CO2:)H2O bulk ice surface. The pure phase peak shifts to lower temperatures as more CO2 is added to the mixture. In the Xe:H2O mixture this peak is absent. Next, a peak is visible around 80 K, which is ascribed to the release of noble gas together with CO2. An increase of the noble gas release is seen for increasing CO2 concentration. For xenon, this peak is barely visible. The mixtures without CO2 show a plateau of noble gas outgassing around 80 K. Finally, two peaks appear at higher temperatures, which are associated with water release. The peak at ~150 K is assigned to volcano desorption; the release of volatile species from the water–ice matrix as this ice becomes mobile due to heating (Burke & Brown 2010). The fourth peak shows up at 170 K when the water-ice desorbs and the remaining noble gases are co-released.
The behaviour of neon differs from the three other noble gases. Just above 20 K, pure phase neon releases. The addition of increasing amounts of CO2 to the mixture also shifts this desorption peak to lower temperatures. After the first desorption event, neon continues to outgas in a continuous plateau. This plateau drops to negligible levels starting at ~80 K for H2O-ice and ~90 K for the H2O:CO2-ice. A small uptake in neon out-gassing is seen for H2O:CO2-ice. After 120 K, neon is depleted and no more signal is measured. The desorption event seen at 150 K (mix:CO2:H2O mixture, green line) is assigned to doubly ionised argon (Ar++), which is present in the four-component noble gas mixture. The prominent m/z = 20 signal at 170 K stems from H218O+ and D2O+.
The middle column of Fig. 1 shows the decrease of noble gas in frozen form or trapped in ice with increasing temperature. For argon, krypton, and xenon, the addition of CO2 to the ice results in higher noble gas release at lower temperatures. In contrast, the presence of CO2 causes neon to linger for a longer time in the ice and desorb at higher temperatures. For the neon experiments, the contributions of Ar++, H218O+, and D2O+ have been subtracted from the m/z = 20 channel.
The final column of Fig. 1 presents the fractions of noble gases that desorb at selected temperature intervals, corresponding with the release of the pure noble gas component, co-release with CO2, and volcano and co-desorption with water combined (the ‘combined water release’). As stated in Sec. 2.3, the gas measured by ROSINA may originate from different locations of the nucleus with varying temperatures. It is hence not possible to derive exact temperatures of release for the gas measured. However, associations of the different volatile species with the main components, CO2 and H2O, are possible. Boundaries of the intervals correspond to the point where the pure desorption event transitions into a plateau, and where noble gas release starts leading up to water desorption. These points are indicated with dashed lines in the right and middle column of Fig. 1. The release fractions of Ar, Kr, and Xe are compared with the bulk CO2 and H2O concentrations in Fig. 2. As the concentration of noble gas in ice increases, more of the noble gases is released during the pure phase release event. The middle panel shows that more noble gases are released as more CO2 is added, but also that larger fractions of lighter noble gases (Ar) desorb than of the heavier ones (Kr, Xe). Consequently, the last panel shows that higher fractions of heavy noble gases are released together with water.
3.1.1 Noble gas fractionation
The measurements allow us to determine the fractionation of noble gases as the ice is heated. The fractionation of Xe/Ar and Kr/Ar from 15 to 140 K are presented in Fig. 3 and the same data plotted against a temperature axis are presented in Fig. C.1. The desorption of noble gases in their pure phase has a prominent influence on the fractionation, as can be seen by the rapid increase of the fractionation factor until ~50 K (argon release), followed by decreases in the factor when pure phase krypton and xenon desorb. For the H2O:noble gas experiments, no pure phase Xe peak is detected and therefore the Xe/Ar fraction is not seen to decrease. The desorption of CO2 has a minimal influence on the fractionation levels (CO2 peak desorption temperature is indicated) and after ~80 K a steady enhancement of the ratio to a maximum of Xe/Ar = 1.35 and Kr/Ar = 1.2 at 140 K is seen. After 140 K the volcano and water co-desorption events occur, which rapidly deplete noble gases from the ice and result in a chaotic fractionation pattern (not shown).
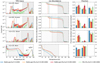 |
Fig. 1 Compilation of the results. Each row corresponds to a noble gas mixture. The desorption trace of the different noble gas:CO2:H2O mixtures are presented in the left column. The data have been corrected for the baseline and the fragmentation factor mentioned in Sect. 2. The integration limits used for further data analysis have been indicated with vertical dashed lines. We note that for neon, only values for T < 120 K have been included, as for higher temperatures the water isotopologues at m/z = 20 are dominant. For argon and krypton, the integration limits had to be adapted to account for the shift in temperature of their low-temperature desorption (noble gas) peak (coloured vertical dashed lines). The desorption behaviour as a function of the temperature of the different ices, normalised to the total amount of desorbing material is presented in the middle column. The integration limits have been indicated. The fractions of noble gas desorbing in the respective temperature regimes are shown in the right column. The integration limits are indicated in the plots of the other columns. |
 |
Fig. 2 Noble gas fractions releasing in the respective temperature regimes with respect to the total noble gas percentage (left), CO2 percentage (middle), and the H2O percentage (right) in the mixture. The integration limits are the same as in Fig. 1. |
3.1.2 Desorption energies
The TPD traces are used to determine the average desorption energies of the pure phase (surface bound) noble gas features. Using the Redhead equation (Edes = Tpeak (ln(ν Tpeak I β) − 3.64), Edes = desorption energy, Tpeak = peak desorption temperature, ν = preexponential frequency factor, β = heating rate Redhead 1962; Ligterink & Minissale 2023), the desorption energy is calculated by using the peak desorption temperature of the noble gas and an assumed pre-exponential frequency factor of 1012 s−1. The Redhead equation is used for first-order desorption processes, which are most often associated with (sub)monolayer desorption. Based on the mixing ratios, layer thickness, and fraction of noble gas desorbing in its pure phase, we determined that a maximum of 3 L of noble gas desorb in this regime. Assuming the ice matrix is highly amorphous, as is generally the case for gases adsorbed at ultra-low temperatures (Hama & Watanabe 2013), (sub)monolayer coverage is plausible. Furthermore, the pure phase desorption peaks display a characteristic first-order desorption profile (Minissale et al. 2022). Therefore, the assumption of a first-order desorption process to use the Redhead equation holds. The resulting desorption energies (Edes) are presented in Table 1. We note that these values are averages that are representative of a range of desorption energies and are only valid for surface-bound desorption of noble gases that are intimately mixed with the H2O(:CO2) matrix. In line with the shift in peak desorption temperature, we find that desorption energies decrease as the CO2 content is increased.
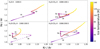 |
Fig. 3 Fractionation of noble gases during warming of the ice. The peak desorption temperatures of the pure phase desorption event of Ar, Kr, Xe, and CO2 are, where relevant, indicated. |
3.2 ROSINA measurements
The ROSINA instrument on board Rosetta monitored the abundances of the major volatile molecules present in the coma (Combi et al. 2020; Läuter et al. 2020) but also detected several minor species (Rubin et al. 2019; Altwegg et al. 2019). The latter include the noble gases argon, krypton, and xenon. Argon was detected during the early and late mission phases when the spacecraft was close to the nucleus (cf. Sec. 2.3). The two periods are October 2014 (Balsiger et al. 2015) and then again March and May 2016 (Rubin et al. 2019). Krypton (Rubin et al. 2019) and xenon (Marty et al. 2017) were thus far only detected in May 2016 and due to their low abundance, the spectra were averaged. For neon, only an upper limit could be provided (Rubin et al. 2019). As a consequence for our analysis here, we thus limit ourselves to the above-mentioned published argon datasets.
The measured argon abundances were investigated using the same methods as described in Rubin et al. (2023). In particular, correlations with the two main ice species in comet 67P have been investigated. H2O is the dominant molecule in 67P’s coma and CO2 is estimated to be about 7.5% w.r.t. H2O by number, that is, based on the total relative gas production integrated over the mission (Läuter et al. 2020).
Rubin et al. (2023) suggested that highly volatile species, such as CH4, CO, and O2, are all associated with H2O and CO2. Their pure ice phase, for example, methane ice, if present to begin with, has been lost over the lifetime of the comet (see, for instance, Guilbert-Lepoutre et al. 2016; Davidsson 2021; Parhi & Prialnik 2023). In this work, the same approach has been applied to the available argon measurements. The top row in Fig. 4 shows correlations of Ar on the y-axis with CO2 on the x-axis in panel a, with H2O in panel b, and with a linear combination of both H2O and CO2 in panel c. All densities have been multiplied by the cometocentric distance squared, rdist2, to remove, to first order, the dependence of the measured signal on the distance to the comet. Furthermore, we took the logarithm of the corresponding numbers to equally weight the data spanning several orders of magnitude. For a perfect correlation, all points align diagonally (marked by the solid line). However, in our case there is some scatter in the data and hence the bounds of one standard deviation is indicated by the two dashed lines straddling the solid black line (offset by the Stdev factors listed in the three panels). The fitted correlation parameters are listed on the x-axis. Figure 4a shows that taking the locally measured CO2 coma gas density, multiplied by 6.2 × 10⁻⁵ yields the locally measured Ar density to an accuracy of 71% (1−σ). Panel b, on the other hand, shows that Ar is much less correlated with H2O, 3.5 × 10⁻⁵ times the locally measured water density reproduces the argon density only within a factor 4.03 (1−σ).
Figure 4c shows the result of the same approach, now based on a linear combination of H2O and CO2. First, we have taken into account that a fraction of the CO2 is likely trapped in H2O and thus has to be subtracted from the total CO2 because it is not associated with the CO2 ice phase. For 67P, Rubin et al. (2023) derived an upper limit of 1% compared to the 7.5% total CO2 w.r.t. H2O (Läuter et al. 2020), which leaves 6.5% in its own ice phase. In the fitting procedure, hence, we use the local coma density of CO2 and first subtract 1% of the measured H2O density.
In panel c, two equations are provided and both include the subtraction of the CO2 that is associated with H2O. The upper equation uses a reduced content of Ar in CO2 for the period before February 2015. During this time, the CO2 seemed to be depleted of highly volatiles due to a seasonal frost cycle that started during the previous apparition (Rubin et al. 2023). This applies to the purple points in the panel. The lower equation marks the fitted parameters after February 2015, once the southern hemisphere became more active and dominated the out-gassing of the comet and the corresponding erosion led to the outgassing of fresh and more pristine cometary material. In order to understand the bulk ices in the comet, the lower equation is relevant.
Fitting the argon density with a linear combination of H2O and CO2 in panel c only slightly improves the result from panel a fit with CO2 only. The analysed periods suggest a strong correlation of Ar with CO2. Early and late in the mission, however, CO2 was elevated with respect to the H2O and compared to perihelion. At times CO2 was even the dominating species outgassing (Hässig et al. 2015). As a result, our fitting is not very sensitive to the argon fraction associated with water.
The three bottom panels in Fig. 4 show timelines of the results obtained in the top panels but without correction for the varying cometocentric distance. Shown are the measured Ar density (purple lines), the reconstruction from panel a based on the locally measured CO2 density (blue lines), the reconstruction from panel b based on the locally measured H2O density (tan lines), and the reconstruction from panel c based on the locally measured H2O and CO2 densities (green lines). Panel d displays the early mission data (Balsiger et al. 2015), panels e and f show the data measured late in the mission (Rubin et al. 2018). The full legend is provided in panel f and applies to the other panels too. The only exception is the reconstruction based on the linear combination of H2O and CO2 (green lines), which is different in panel d compared to the others: the reason is the above-mentioned seasonal CO2 frost which shows depletion of highly volatiles early on in the mission (Rubin et al. 2023). Also discussed above, the difference between the CO2-based and the H2O–CO2-based reconstructions is small. On the other hand, the reconstruction based on H2O overestimates the argon abundance early on in the mission in panel d but then mostly underestimates the density late in the mission shown in panel f.
Based on the derived correlation coefficients in Fig. 4c, it is possible to estimate the amount of Ar associated with H2O compared to CO2 in the fresh cometary ice. Using the correlation for the period after February 2015
![Mathematical equation: $\[n_{\mathrm{Ar}}=4.4 \times 10^{-6} \cdot n_{\mathrm{H}_2 \mathrm{O}}+6.0 \times 10^{-5} \cdot\left(n_{\mathrm{CO}_2}-0.01 \cdot n_{\mathrm{H}_2 \mathrm{O}}\right)\]$](/articles/aa/full_html/2024/07/aa49554-24/aa49554-24-eq3.png)
and a bulk CO2/H2O ratio of 0.075 (Läuter et al. 2020), that is, the fraction not associated with H2O of 0.065 (see discussion above), follows that the portion of argon associated with water is
![Mathematical equation: $\[r_{\mathrm{Ar} \text { in } \mathrm{H}_2 \mathrm{O}}=\frac{4.4 \times 10^{-6}}{\left(4.4 \times 10^{-6}+6.0 \times 10^{-5} \cdot 0.065\right)}=0.53 \text {. }\]$](/articles/aa/full_html/2024/07/aa49554-24/aa49554-24-eq4.png)
The same ~53% are also listed in panel c. Consequently, the portion associated with CO2 is ![Mathematical equation: $\[r_{\mathrm{Ar} \text { in } \mathrm{CO}_2}=0.47\]$](/articles/aa/full_html/2024/07/aa49554-24/aa49554-24-eq5.png) . This approach does not include an argon-dominated ice phase, that is, the measured argon in the coma of comet 67P can be reproduced within 70% accuracy by just taking into account the portions co-released with H2O and CO2. Aligned with Rubin et al. (2023), this approach implicitly assumes that the pure ice phases of highly volatile species have either been lost over the lifetime of the comet due to thermal processing of the nucleus (see, e.g. Guilbert-Lepoutre et al. 2016; Davidsson 2021; Parhi & Prialnik 2023) or did not even form to begin with.
. This approach does not include an argon-dominated ice phase, that is, the measured argon in the coma of comet 67P can be reproduced within 70% accuracy by just taking into account the portions co-released with H2O and CO2. Aligned with Rubin et al. (2023), this approach implicitly assumes that the pure ice phases of highly volatile species have either been lost over the lifetime of the comet due to thermal processing of the nucleus (see, e.g. Guilbert-Lepoutre et al. 2016; Davidsson 2021; Parhi & Prialnik 2023) or did not even form to begin with.
Unfortunately, argon has thus far not been detected during the water-dominated outgassing period near perihelion which would be a suitable period to better constrain the portion of argon associated with water. At that time, Rosetta had to be moved farther away from the nucleus and also above the lesser active winter hemisphere to cope with the elevated dust activity and associated problems with the star trackers. Still, our result indicates that argon is associated with about equal amounts of water and carbon dioxide, keeping in mind that the corresponding errors are substantial. For instance, increasing or decreasing the portion of Ar in H2O by about ±7% increases the standard deviation factor from 1.70 in panel c to the 1.71 from panel a. This does not include any systematic errors, such as DFMS calibration errors (approx. 15%), the lack of argon measurements near peak H2O outgassing at 67P, and errors associated with the fact that the DFMS mass spectrometer measured the molecules of different masses not simultaneously but in sequence. We estimate that the portion of Ar in H2O is hence ![Mathematical equation: $\[r_{\mathrm{Ar} \text { in } \mathrm{H}_2 \mathrm{O}}=0.53 \pm 0.30\]$](/articles/aa/full_html/2024/07/aa49554-24/aa49554-24-eq6.png) . Clearly, there are still open questions regarding the association of Ar with H2O and CO2 which may be answered with follow-up work on ROSINA data or require future comet (sample-return) missions.
. Clearly, there are still open questions regarding the association of Ar with H2O and CO2 which may be answered with follow-up work on ROSINA data or require future comet (sample-return) missions.
Desorption energies of noble gases.
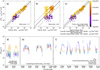 |
Fig. 4 ROSINA measurements of argon, water, and carbon dioxide at comet 67P. The top row shows the argon densities measured at the location of Rosetta modified by the cometocentric distance squared on the y-axis (modified density). Panel a shows the modified CO2 density on the x-axis, multiplied by a fitted correlation factor (6.2 × 10⁻⁵) by which the CO2 density can be multiplied to obtain the measured argon density within 71% accuracy (1−σ corresponding to a multiplication and division by the 1.71 Stdev factor). Panel b shows the same for H2O and panel c for a linear combination of H2O and CO2. Panels d–f show the reconstructed densities based on these correlation factors for the three time periods investigated (cf. Balsiger et al. 2015; Rubin et al. 2018). For more details see the main text. |
4 Discussion and astrophysical implications
4.1 Noble gas desorption parameters
In this study, the desorption temperature and energy of the pure phase component of the noble gases Ne, Ar, Kr, and Xe are determined, see Table 1. A decrease in desorption temperature and energy is noted when more CO2 is added. This is likely explained by competition for binding sites (Owen et al. 1992; Simon et al. 2019; Kipfer et al. 2024a). Ice consists of a wide range of binding sites, each resulting in a specific binding or desorption energy (He et al. 2016). In binary mixtures of noble gas and water, all binding sites are available to the volatile noble gas atom and the probability that it will settle in the deepest sites (that is, locations in the ice where a molecule is most tightly adsorbed) is the highest. However, when CO2 is added, it starts competing for these binding sites. On top of that, the desorption and diffusion energy of CO2 is larger than those of Ar, Kr, or Xe. This means that once CO2 settles in a deep binding site, it is more likely to remain there, whereas the noble gas is more prone to leaving the deep binding site again. Therefore, noble gas atoms will start occupying shallower binding sites and thus desorb at lower temperatures.
In Table 1, desorption temperatures/energies are compared with the results of Smith et al. (2016) and Schneiderman (2022). These authors conducted thermal desorption experiments of noble gases dosed on water ice and found significantly lower desorption temperatures/energies than those obtained in this study. These differences are likely the result of the preparation of the ice film. For example, in Ayotte et al. (2001) shifts in peak desorption temperature depending on ice layering and structure were noted. In this work, gas mixtures are deposited, which results in a higher degree of exposure of noble gas atoms to deeper binding sites and pores in the ice, thus shifting its desorption temperature. For interstellar ice, it is relevant to take this effect into account. Because H2O forms on microscopic dust grains at temperatures that are low enough (≤20 K) for noble gases to freeze out (Hama & Watanabe 2013), we can expect noble gases to be intimately mixed with water ice. The high desorption energies found in this study are appropriate for such an environment.
4.2 Noble gas trapping
Throughout the experiments, CO2 visibly affects the desorption of noble gases. The fraction of argon, krypton, and xenon co-releasing with CO2 increases as the carbon dioxide concentration increases. In the thin film experiments performed by Simon et al. (2023), more argon is entrapped in (or, released from) CO2 ice as the CO2:Ar mixing ratio increases. Therefore, we can expect more noble gases to be released together with CO2 as its concentration increases in our experiments. However, because we use a ternary mixture of noble gas:CO2:H2O in our experiments, we likely also see the result of competition for deeper binding sites in the water-ice matrix, as described in the previous section (see also Owen et al. 1992; Simon et al. 2019; Kipfer et al. 2024a). As fewer binding sites are available to the noble gases in the water-ice matrix, they will more readily desorb together with CO2.
Interestingly, this effect is not observed for neon, where the addition of CO2 results in Ne release from the bulk ice shifting to higher temperatures. The neon TPD traces differ significantly from those of Ar, Kr, and Xe, and no indication of neon release together with water is observed. From this, we can infer two things about the interaction between neon and the waterice matrix. First, neon is only weakly bound to the H2O(:CO2) matrix and at higher temperatures (≥30 K) this interaction likely becomes negligible. Second, the water-ice matrix is not able to trap neon, which is in line with the findings of Schneiderman (2022). Of the noble gases investigated in this work, neon has the smallest radius (r = 0.58, 1.06, 1.16, 1.40 Å for Ne, Ar, Kr, and Xe, respectively; Cordero et al. 2008). The amorphous water ice structures could be large enough for the neon atom to migrate or diffuse through. Previous studies have shown that CO2 undergoes a transformation from an amorphous to crystalline structure at temperatures of 20–30 K (He & Vidali 2018), whereas H2O crystallisation occurs at temperatures well above 100 K (e.g. Maté et al. 2012). The addition of CO2 to the bulk ice matrix can result in more closely packed structures that make it more difficult for neon atoms to release, thus shifting neon desorption to higher temperatures. For heavier noble gases this effect is likely less prominent, because they are trapped in the water ice matrix anyway.
Another consequence of the addition of CO2, is that the fraction of Ar, Kr, and Xe trapped in water decreases (see Fig. 1). However, compared to other parameters, the influence of CO2 on the trapping efficiency is minor. Much more pronounced are the influence of H2O:noble gas mixing ratio and ice thickness on the Ar, Kr, and Xe trapping efficiencies in water, see Fig. 5. The trapping efficiency increases from 20–50% for the highest concentrations of noble gas and thinnest ice, to 80–100% for the thickest ice films and lowest noble gas fractions in the ice mixture. In particular, the mixing ratio is important to take into account. Assuming solar elemental abundances are representative of the atomic inventory of the proto-solar nebula (PSN) and its pre-stellar cloud, then elemental ratios of the noble gases are O/Ar = 1.8×10², O/Kr = 2.8×10⁵, and O/Xe = 2.8×10⁶, where O is atomic oxygen (Lodders et al. 2009; Asplund et al. 2009). Assuming that most of the oxygen reservoir is locked up in H2O, we see argon experiments have covered realistic mixing ratios and entrapment efficiencies of 60–80% are plausible. However, for krypton and xenon, the mixing ratios are underestimated by about two orders of magnitude. Considering the increasing trend for mixing ratios, water trapping efficiencies are likely ≥80% for krypton and ≥90% for xenon.
From ROSINA data of comet 67P, we find that argon is associated with CO2 and H2O in approximately equal amounts, albeit with large uncertainties of ~60%. Our laboratory experiments show that a minimum of 70% Ar is embedded in water-ice and a maximum of 15% desorbs together with CO2. Despite the large uncertainties of the ROSINA data, there seems to be a discrepancy between observations and laboratory measurements. Our experiments indicate that with increasing CO2 concentrations, more argon co-releases – a trend that is also found for N2 by Kipfer et al. (2024a). However, the experimental co-desorption value of 15% is found for a 20:100 CO2:H2O ice mixture, which contains about 2.5 times more CO2 than 67P. As competition for binding sites effectively pushes argon out of the water matrix, other molecules could be contributing to that effect as well (see also the discussion in Kipfer et al. 2024a). However, as the combined reservoir of molecules other than H2O and CO2 in 67P amounts to around 10% with respect to H2O (Rubin et al. 2019), it is not certain this will make a sufficiently large impact if the analogy with our CO2:H2O experiments holds. Other mechanisms likely need to be considered to explain the Ar abundance and its association with CO2 and H2O, see Sec. 4.3.
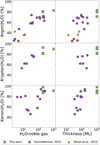 |
Fig. 5 Trapping efficiencies of noble gases in water plotted against the H2O:noble gas ratio (left column) and the ice thickness in mono-layer (right column). Data are taken from this study (green squares), Schneiderman (2022, purple circles), and Simon et al. (2023, orange triangles). |
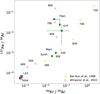 |
Fig. 6 Comparison of noble gas ratios in different sources and experiments. Data points are taken from the following sources: solar: average of Lodders et al. (2009) and Asplund et al. (2009); 67P: Rubin et al. (2018); Titan: Niemann et al. (2010); Earth, Mars: Ozima & Podosek (2002); laboratory experiments: Bar-Nun & Owen (1998); Almayrac et al. (2022). The blue square labelled “L24” indicates the maximum fractionation values found in this work, assuming a solar abundance starting point. |
4.3 Noble gas fractionation and 67P
The fractionation factors for Kr/Ar and Xe/Ar obtained in this study are less than a factor of two. In contrast, various studies achieve orders of magnitude enhancements in noble gas ratios by employing the elevated condensation temperature method (e.g. Bar-Nun & Owen 1998; Almayrac et al. 2022), see experimental data points in Fig. 6. As described in the introduction, the elevated condensation temperature method has a significant conceptual issue. In pre-stellar clouds and the dense PSN, water is predominantly formed as ice at ultra-low temperatures (≤20 K) on microscopic dust grains (Van Dishoeck et al. 2013). Therefore, for elevated condensation to work, H2O first needs to be transferred to the gas phase, which requires heating to ≥150 K (Minissale et al. 2022). Next, the surfaces need to cool down again, without the gases freezing out, to allow the gas mixture to condense at ≤80 K. There is no realistic inter- or circumstellar environment known where this process can occur.
Other processes need to be invoked to explain noble gas fractionation in 67P. One option is the formation of clathrate hydrates – highly structured cages of crystalline H2O molecules that trap impurities (that is, volatile species such as noble gas atoms). Mousis et al. (2018) suggests that 67P or the material it formed from was annealed in the PSN to convert pristine amorphous ice with an interstellar origin to crystalline ice. During this process, inherited trapped volatiles are largely lost during the phase transition via volcano desorption. As the PSN cools down again, the volatiles settle on the crystalline ice at T ≤ 80 K and are subsequently enclathrated.
In natural environments, clathrate hydrates are observed at pressures that are substantially above those generally found in a PSN (Englezos 1993; Buffett 2000). However, experiments have shown that clathrate hydrates of methanol, methane, and carbon dioxide can form under analogue PSN and ISM conditions (Blake et al. 1991; Hudson & Moore 1993; Williams & Devlin 1997; Ghosh et al. 2019), although the identification of CH4 and CO2 clathrate hydrates has been criticised (Choukroun et al. 2019). In these experiments, the guest molecule is mixed with or layered below water ice at low temperatures. Warming of the system results in crystallisation and clathrate formation with the guest species. It has been suggested that this mechanism works because a sufficiently high gas pressure of the guest species can be maintained in the microscopic structure of the water ice (Klinger 1991). It is unclear if clathrate hydrates also form when guest species adsorb on a crystalline ice surface in a low-pressure environment and whether this process has total efficiency. While there are hints of crystalline ice on 67P (Filacchione et al. 2016), it is not certain if the ice underwent this phase change while in PSN, since various other comets display signs of amorphous ice (Davies et al. 1997; Kawakita et al. 2004; Sivaraman et al. 2015).
To explain noble gas fractionation in comet 67P, the solution perhaps can be found in ‘sweating ice’, that is, slow diffusion of molecules through bulk ice. What many laboratory experiments do not – or rather, cannot – take into account are the long timescales over which physicochemical processes take place in space, which can be in the order of 103−109 yr. This means that slow processes are easily missed during laboratory experiments, which typically last hours to several days. One such process is the diffusion of molecules through bulk ice, which has experimentally and theoretically been demonstrated for several species (Brown & George 1996; Livingston et al. 2002; Mispelaer et al. 2013; Ghesquiere et al. 2015). Over longer timescales and aided by moderate warming, this can mean that volatile atoms or molecules (e.g. Ar) more easily diffuse through the bulk ice, reach its surface, and desorb to the gas phase than less volatile species (e.g. Kr and Xe), resulting in enhanced ratios between species. Bulk diffusion parameters have not been determined for noble gases and therefore an example is given for CO (Ghesquiere et al. 2015) and CH3OH (Livingston et al. 2002). Their diffusion and desorption parameters are presented in Table 2. With these values, the diffusion rate can be calculated following:
![Mathematical equation: $\[D_{\text {diff,} \mathrm{i}}=D_{0, \mathrm{i}} \exp \left(-\frac{E_{\text {diff}, \mathrm{i}}}{T_{\text {ice }}}\right),\]$](/articles/aa/full_html/2024/07/aa49554-24/aa49554-24-eq7.png)
where Ddiff,i is the diffusion rate in cm2 s−1 for species i, D0,i the diffusion constant in cm2 s−1, Ediff,i the activation energy of bulk diffusion in K, and Tice the ice temperature in K. With the Einstein–Smoluchowski relation the characteristic timescale for diffusion can be calculated:
![Mathematical equation: $\[t=\frac{x^2}{2 ~D_{\text {diff,i }}},\]$](/articles/aa/full_html/2024/07/aa49554-24/aa49554-24-eq8.png)
where x is the distance over which a particle diffuses. For this thought experiment, we adopt the 3.7 Å bilayer spacing used in Brown & George (1996) and determine the time it takes to diffuse through 100 layers (that is, 370 Å), which is assumed to be appropriate for ice film thicknesses on microscopic dust grains. Finally, for species that reach the surface of an ice film, the desorption rate kdes,i (s−1) is determined:
![Mathematical equation: $\[k_{\text {des}, i}=v_{\mathrm{i}} ~N \exp \left(-\frac{E_{\text {des}, \mathrm{i}}}{T_{\text {surf}}}\right),\]$](/articles/aa/full_html/2024/07/aa49554-24/aa49554-24-eq9.png)
where νi is the pre-exponential frequency factor in s−1, N the surface coverage in molecules cm−2, Edes,i the activation energy of the desorption process in K, and Tsurf the surface temperature. Tice and Tsurf are assumed to be equal. Surface coverage depends on the number of volatiles present in the ice and how many species diffuse to the surface. However, for consistency and simplicity, we fix N = 1×10¹⁵ molecules cm−2.
The diffusion timescales and desorption rates for 10, 20, 30, 40, and 50 K are presented in Table 2. What becomes clear, is that the more volatile CO molecule diffuses much quicker through the ice. At 50 K it takes about 9 days for a CO molecule to pass through the entire layer, while CH3OH would need 1040 yr and can effectively be considered fixed. For temperatures of ≥30 K the desorption rate of CO is sufficiently large that any carbon monoxide molecule reaching the surface is right away lost as a gas. Thermal CH3OH desorption, however, is negligible. The difference in diffusion behaviour between CO and CH3OH can be understood by different interactions between guest molecule and host medium. However, Ghesquiere et al. (2015) find that diffusion is driven by the self-diffusion of H2O molecules, that is, the overall diffusion of the H2O matrix promotes the movement of trapped species. This makes diffusion almost independent of the guest molecule and CO and CH3OH would diffuse through the ice at approximately the same rate. In this case, the ‘sweating ice’ scenario would still work, as CO can desorb and CH3OH does not (depending on the specific temperature the ice reaches). After reaching the surface, a CH3OH molecule would simply diffuse back into the bulk ice.
Diffusion parameters of noble gases in ice are not known, but can be expected to either be similar or follow a pattern of increasing diffusion rate with increasing volatility. Noble gases desorb at higher temperatures (that is, have larger desorption energies) with increasing noble gas atom size. Therefore, the ‘sweating ice’ scenario to fractionate noble gases is plausible. To unravel how much and for how long 67P or the material it formed from was heated, experimental or theoretical determination of noble gas diffusion parameters is essential. More diffusion data for molecules such as N2 and O2 is also desired as they can help constrain fractionation processes, but also to help understand the association of volatiles with CO2 and H2O (Rubin et al. 2023), or the possible depletion of N2 (Kipfer et al. 2024a). A straightforward validation of this fractionation mechanism can be performed with isothermal ice experiments. As seen in Fig. 1, noble gases keep releasing from the ice after the pure phase desorption event, which, among other things, could indicate that noble gases are diffusing and released to the gas. Ice films of H2O:Ar:Kr:Xe can be prepared and heated at a fixed temperature (e.g. 80 K) for different durations. At the end of a run, the TPD is continued and the noble gas abundances in the water release event are determined. A correlation between noble gas depletion and their volatility would be indicative of the ‘sweating ice’ scenario.
Diffusion timescales and desorption rates.
5 Conclusions
In this study, we experimentally investigated the thermal desorption, trapping, and fractionation of neon, argon, krypton, and xenon in bulk H2O:CO2 ice. Ice films are prepared at 15 K and analysed with temperature-programmed desorption mass spectrometry to determine which gases are released at which temperature. These experiments are performed in the context of comet 67P/Churyumov–Gerasimenko to address the influence of CO2 in the bulk ice on the desorption behaviour and elucidate the mechanism that sets the noble gas fractionation levels. ROSINA data are analysed to determine the association between noble gases and the major ice components of 67P, CO2 and H2O. Our main findings are the following:
CO2 has a prominent effect on noble gas desorption. Argon, krypton, and xenon co-release with CO2 desorption at ~80 K. With increasing CO2 concentrations, larger fractions of noble gases are released with CO2, while the amount of noble gas trapped in the water phase (T ≥ 110 K) decreases. The pure phase noble gas desorption peak shifts to lower temperatures as more CO2 is added. This can be explained by competition for binding sites on the water ice, where CO2 will preferentially occupy the deeper binding sites, leaving the shallower binding sites for the noble gases;
Neon displays different desorption behaviour from argon, krypton, and xenon, and is not trapped in water. The addition of CO2 prolongs the desorption of neon from the ice. We suggest that water ice is not a good trapping agent for neon, which is small enough to move through its amorphous structure. The addition of CO2, which crystallises at 20–30 K, results in better trapping of neon, thus making it linger longer;
Desorption energies are determined for the pure phase noble desorption peaks and found to be substantially larger than values previously reported in the literature. This difference likely results from the ice preparation method, which has been dosing of noble gases on top of amorphous ice, whereas in this study we co-deposit a H2O:CO2:noble gas mixture. In interstellar environments, noble gases and water are likely intimately mixed and therefore the higher desorption energies found in this study should be preferred when modelling noble gas desorption;
Fractionation levels achieved in this study are just 40% and cannot explain the two orders of magnitude fractionation found in 67P (compared to solar noble gas abundances). We postulate ‘sweating ice’, that is, the diffusion of more volatile species through bulk ice and their subsequent desorption, as an alternative mechanism to fractionate noble gases in 67P;
From ROSINA data it was only possible to determine associations for argon, which is embedded in CO2 and H2O in roughly equal amounts (albeit with large uncertainties). The laboratory experiments cannot reproduce such a distribution of Ar in the ice.
Ice films that consist of multiple components display different desorption behaviour than those consisting of two components. This underlines that experiments on realistic cometary ice analogues are vital to further improve our understanding of comet outgassing. Additionally, long-term isothermal experiments are of high priority to understand the depletion and fractionation of volatiles in cometary or interstellar icy material.
Acknowledgements
The authors thank the anonymous referee for their helpful comments. N.F.W.L. and K.A.K. acknowledge support from the Swiss National Science Foundation (SNSF) Ambizione grant 193453 and NCCR PlanetS. Work by M.R., N.H., and D.R.M. was funded by the Canton of Bern and the Swiss National Science Foundation (SNSF; 200020_207312). S.F.W. acknowledges the financial support of the SNSF Eccellenza Professorial Fellowship (PCEFP2_181150). We gratefully acknowledge the work of the many engineers, technicians and scientists involved in the Rosetta mission and in the ROSINA (Rosetta Orbiter Spectrometer for Ion and Neutral Analysis) instrument in particular. Without their contributions, ROSINA would not have produced such outstanding results. Rosetta is an European Space Agency (ESA) mission with contributions from its member states and the National Aeronautics and Space Administration (NASA).
Appendix A Overview of experiments
Table A.1 gives an overview of the experiments conducted and their composition.
Overview mixture compositions.
Appendix B Correction factor
Due to the issues mentioned in Section 2, a correction factor had to be applied to the data. For this purpose, calibration experiments have been performed to investigate this correction factor. Figure B.1 shows how the fragmentation patterns (which for atoms are dominated by singly and doubly ionised species) of the noble gas isotopes of neon, argon, krypton, and xenon vary with the total measured current of the QMS, which acts as a proxy for the chamber pressure. In all cases, a plateau is reached at higher currents, but at low currents, the fragmentation pattern deviates significantly. Our experimental data are corrected for these low current deviations.
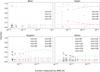 |
Fig. B.1 Fraction of the noble gases as a function of the total current measured with the QMS for the relevant mass channels in the chamber. We note that not all mass channels corresponding to a noble gas have been measured. The fractions derived from the NIST database have been indicated with dashed lines in the plots. |
Appendix C Fractionation
Figure C.1 displays the same data as shown in Fig. 3, but for Kr/Ar (purple) and Xe/Ar (orange) plotted against the temperature of the ice on the x-axis.
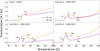 |
Fig. C.1 Noble gas ratios of Kr/Ar (solid purple line) and Xe/Ar (dashed orange line) versus the ice temperature. The peak desorption temperatures of pure phase Ar, Kr, Xe, and CO2 are indicated with crosses. |
References
- Almayrac, M. G., Bekaert, D. V., & Broadley, M. W., et al. 2022, PSJ, 3, 252 [NASA ADS] [Google Scholar]
- Altwegg, K., Balsiger, H., & Fuselier, S. A. 2019, ARA&A, 57, 113 [NASA ADS] [CrossRef] [Google Scholar]
- Asplund, M., Grevesse, N., Sauval, A. J., & Scott, P. 2009, ARA&A, 47, 481 [NASA ADS] [CrossRef] [Google Scholar]
- Ayotte, P., Smith, R. S., Stevenson, K. P., et al. 2001, J. Geophys. Res.: Planets, 106, 33387 [Google Scholar]
- Balsiger, H., Altwegg, K., Bochsler, P., et al. 2007, Space Sci. Rev., 128, 745 [NASA ADS] [CrossRef] [Google Scholar]
- Balsiger, H., Altwegg, K., Bar-Nun, A., et al. 2015, Sci. Adv., 1, e1500377 [NASA ADS] [CrossRef] [Google Scholar]
- Bar-Nun, A., & Owen, T. 1998, Trapping of Gases in Water Ice and Consequences to Comets and the Atmospheres of the Inner Planets, eds. B. Schmitt, C. De Bergh, & M. Festou (Dordrecht: Springer Netherlands), 353 [Google Scholar]
- Bar-Nun, A., Herman, G., Laufer, D., & Rappaport, M. 1985, Icarus, 63, 317 [CrossRef] [Google Scholar]
- Bartlett, P. L., & Stelbovics, A. T. 2002, Phys. Rev. A, 66, 012707 [NASA ADS] [CrossRef] [Google Scholar]
- Blake, D., Allamandola, L., Sandford, S., Hudgins, D., & Freund, F. 1991, Science, 254, 548 [NASA ADS] [CrossRef] [Google Scholar]
- Brown, D., & George, S. 1996, J. Phys. Chem., 100, 15460 [Google Scholar]
- Buffett, B. A. 2000, Annu. Rev. Earth Planet. Sci., 28, 477 [CrossRef] [Google Scholar]
- Burke, D. J., & Brown, W. A. 2010, PCCP, 12, 5947 [NASA ADS] [CrossRef] [Google Scholar]
- Choukroun, M., Vu, T. H., & Fayolle, E. C. 2019, PNAS, 116, 14407 [NASA ADS] [CrossRef] [Google Scholar]
- Combi, M., Shou, Y., Fougere, N., et al. 2020, Icarus, 335, 113421 [NASA ADS] [CrossRef] [Google Scholar]
- Cordero, B., Gómez, V., Platero-Prats, A. E., et al. 2008, Dalton Trans., 2832 [CrossRef] [Google Scholar]
- Davidsson, B. J. R. 2021, MNRAS, 505, 5654 [NASA ADS] [CrossRef] [Google Scholar]
- Davies, J. K., Roush, T. L., Cruikshank, D. P., et al. 1997, Icarus, 127, 238 [NASA ADS] [CrossRef] [Google Scholar]
- Drozdovskaya, M. N., van Dishoeck, E. F., Rubin, M., Jørgensen, J. K., & Altwegg, K. 2019, MNRAS, 490, 50 [Google Scholar]
- Englezos, P. 1993, Ind. Eng. Chem. Res., 32, 1251 [CrossRef] [Google Scholar]
- Filacchione, G., Raponi, A., Capaccioni, F., et al. 2016, Science, 354, 1563 [Google Scholar]
- Ghesquiere, P., Mineva, T., Talbi, D., et al. 2015, Phys. Chem. Chem. Phys., 17, 11455 [CrossRef] [Google Scholar]
- Ghosh, J., Methikkalam, R. R. J., Bhuin, R. G., et al. 2019, PNAS, 116, 1526 [NASA ADS] [CrossRef] [Google Scholar]
- Guilbert-Lepoutre, A., Rosenberg, E. D., Prialnik, D., & Besse, S. 2016, MNRAS, 462, S146 [NASA ADS] [CrossRef] [Google Scholar]
- Güsten, R., Wiesemeyer, H., Neufeld, D., et al. 2019, Nature, 568, 357 [CrossRef] [Google Scholar]
- Hama, T., & Watanabe, N. 2013, Chem. Rev., 113, 8783 [Google Scholar]
- Hänni, N., Altwegg, K., Combi, M., et al. 2022, Nat. Commun., 13, 1 [Google Scholar]
- Hansen, K. C., Altwegg, K., Berthelier, J.-J., et al. 2016, MNRAS, 462, S491 [Google Scholar]
- Hässig, M., Altwegg, K., Balsiger, H., et al. 2015, Science, 347, aaa0276 [Google Scholar]
- He, J., & Vidali, G. 2018, MNRAS, 473, 860 [NASA ADS] [CrossRef] [Google Scholar]
- He, J., Acharyya, K., & Vidali, G. 2016, ApJ, 825, 89 [Google Scholar]
- Herbst, E., & Van Dishoeck, E. F. 2009, ARA&A, 47, 427 [NASA ADS] [CrossRef] [Google Scholar]
- Hudson, R. L., & Moore, M. H. 1993, ApJ, 404, L29 [NASA ADS] [CrossRef] [Google Scholar]
- Jacob, A. M., Menten, K. M., Wyrowski, F., Winkel, B., & Neufeld, D. A. 2020, A&A, 643, A91 [EDP Sciences] [Google Scholar]
- Kawakita, H., Watanabe, J.-i., Ootsubo, T., et al. 2004, ApJ, 601, L191 [NASA ADS] [CrossRef] [Google Scholar]
- Kipfer, K., Ligterink, N., Rubin, M., et al. 2024a, A&A, 686, A102 (Paper I) [NASA ADS] [CrossRef] [EDP Sciences] [Google Scholar]
- Kipfer, K. A., Galli, A., Riedo, A., et al. 2024b, Icarus, 410, 115742 [NASA ADS] [CrossRef] [Google Scholar]
- Klinger, J. 1991, Space Sci. Rev., 56, 99 [CrossRef] [Google Scholar]
- Lammer, H., Scherf, M., Kurokawa, H., et al. 2020, Space Sci. Rev., 216, 1 [CrossRef] [Google Scholar]
- Laufer, D., Kochavi, E., & Bar-Nun, A. 1987, Phys. Rev. B, 36, 9219 [NASA ADS] [CrossRef] [Google Scholar]
- Läuter, M., Kramer, T., Rubin, M., & Altwegg, K. 2020, MNRAS, 498, 3995 [Google Scholar]
- Ligterink, N., & Minissale, M. 2023, A&A, 676, A80 [NASA ADS] [CrossRef] [EDP Sciences] [Google Scholar]
- Livingston, F. E., Smith, J. A., & George, S. M. 2002, J. Phys. Chem. A, 106, 6309 [NASA ADS] [CrossRef] [Google Scholar]
- Lodders, K., Palme, H., & Gail, H.-P. 2009, Solar Syst. (Berlin Heidelberg: Springer-Verlag), 712 [CrossRef] [Google Scholar]
- Lunine, J. I., Coradini, A., Gautier, D., Owen, T. C., & Wuchterl, G. 2004, Jupiter: Planet Satellites Magnetosphere, 1, 19 [NASA ADS] [Google Scholar]
- Marcq, E., Mills, F. P., Parkinson, C. D., & Vandaele, A. C. 2018, Space Sci. Rev., 214, 1 [NASA ADS] [CrossRef] [Google Scholar]
- Marty, B., Avice, G., Sano, Y., et al. 2016, Earth Planet. Sci. Lett., 441, 91 [CrossRef] [Google Scholar]
- Marty, B., Altwegg, K., Balsiger, H., et al. 2017, science, 356, 1069 [NASA ADS] [CrossRef] [Google Scholar]
- Maté, B., Rodríguez-Lazcano, Y., & Herrero, V. J. 2012, PCCP, 14, 10595 [CrossRef] [Google Scholar]
- Minissale, M., Aikawa, Y., Bergin, E., et al. 2022, ACS Earth Space Chem., 6, 597 [NASA ADS] [CrossRef] [Google Scholar]
- Mispelaer, F., Theulé, P., Aouididi, H., et al. 2013, A&A, 555, A13 [NASA ADS] [CrossRef] [EDP Sciences] [Google Scholar]
- Mousis, O., Ronnet, T., Lunine, J., et al. 2018, ApJ, 865, L11 [CrossRef] [Google Scholar]
- Müller, D. R., Altwegg, K., Berthelier, J.-J., et al. 2022, A&A, 662, A69 [NASA ADS] [CrossRef] [EDP Sciences] [Google Scholar]
- Neufeld, D. A., Goto, M., Geballe, T., et al. 2020, ApJ, 894, 37 [CrossRef] [Google Scholar]
- Niemann, H. B., Atreya, S. K., Demick, J., et al. 2010, J. Geophys. Res.: Planets, 115, E12006 [CrossRef] [Google Scholar]
- Ninio Greenberg, A., Laufer, D., & Bar-Nun, A. 2017, MNRAS, 469, S517 [NASA ADS] [CrossRef] [Google Scholar]
- Notesco, G., Kleinfeld, I., Laufer, D., & Bar-Nun, A. 1991, Icarus, 89, 411 [NASA ADS] [CrossRef] [Google Scholar]
- Notesco, G., Bar-Nun, A., & Owen, T. 2003, Icarus, 162, 183 [NASA ADS] [CrossRef] [Google Scholar]
- Okazaki, R., Marty, B., Busemann, H., et al. 2022, Science, 379, eabo0431 [Google Scholar]
- Ott, U. 2002, Rev. Mineral. Geochem., 47, 71 [NASA ADS] [CrossRef] [Google Scholar]
- Ott, U. 2014, Geochemistry, 74, 519 [NASA ADS] [CrossRef] [Google Scholar]
- Owen, T., Bar-Nun, A., & Kleinfeld, I. 1992, Nature, 358, 43 [NASA ADS] [CrossRef] [Google Scholar]
- Owen, T., Mahaffy, P., Niemann, H. B., et al. 1999, Nature, 402, 269 [Google Scholar]
- Owen, T., Mahaffy, P., Niemann, H., Atreya, S., & Wong, M. 2001, ApJ, 553, L77 [NASA ADS] [CrossRef] [Google Scholar]
- Ozima, M., & Podosek, F. A. 2002, Noble Gas Geochemistry (Cambridge University Press) [Google Scholar]
- Parhi, A., & Prialnik, D. 2023, MNRAS, 522, 2081 [NASA ADS] [CrossRef] [Google Scholar]
- Redhead, P. 1962, Vacuum, 12, 203 [NASA ADS] [CrossRef] [Google Scholar]
- Rubin, M., Altwegg, K., Balsiger, H., et al. 2018, Sci. Adv., 4, eaar6297 [NASA ADS] [CrossRef] [Google Scholar]
- Rubin, M., Altwegg, K., Balsiger, H., et al. 2019, MNRAS, 489, 594 [Google Scholar]
- Rubin, M., Altwegg, K., Berthelier, J.-J., et al. 2023, MNRAS, 526, 4209 [NASA ADS] [CrossRef] [Google Scholar]
- Schilke, P., Neufeld, D. A., Müller, H. S., et al. 2014, A&A, 566, A29 [NASA ADS] [CrossRef] [EDP Sciences] [Google Scholar]
- Schneiderman, T. 2022, PhD thesis, Massachusetts Institute of Technology, USA [Google Scholar]
- Sierks, H., Barbieri, C., Lamy, P. L., et al. 2015, Science, 347, aaa1044 [Google Scholar]
- Simon, A., Öberg, K. I., Rajappan, M., & Maksiutenko, P. 2019, ApJ, 883, 21 [NASA ADS] [CrossRef] [Google Scholar]
- Simon, A., Rajappan, M., & Öberg, K. I. 2023, ApJ, 955, 5 [NASA ADS] [CrossRef] [Google Scholar]
- Sivaraman, B., Venkataraman, V., Kalyaan, A., Arora, S., & Ganesh, S. 2015, Adv. Space Res., 56, 2428 [NASA ADS] [CrossRef] [Google Scholar]
- Smith, R. S., May, R. A., & Kay, B. D. 2016, J. Phys. Chem. B, 120, 1979 [Google Scholar]
- Stern, S., Slater, D., Festou, M., et al. 2000, ApJ, 544, L169 [NASA ADS] [CrossRef] [Google Scholar]
- Taylor, M., Altobelli, N., Buratti, B., & Choukroun, M. 2017, Phil. Trans. R. Soc. A, 375, 20160262 [CrossRef] [Google Scholar]
- Van Dishoeck, E. F., Herbst, E., & Neufeld, D. A. 2013, Chem. Rev., 113, 9043 [NASA ADS] [CrossRef] [Google Scholar]
- Wieler, R. 2002, Rev. Mineral. Geochem., 47, 21 [NASA ADS] [CrossRef] [Google Scholar]
- Wieler, R., & Heber, V. 2003, Space Sci. Rev., 106, 197 [NASA ADS] [CrossRef] [Google Scholar]
- Williams, K. D., & Devlin, J. P. 1997, J. Mol. Struct., 416, 277 [NASA ADS] [CrossRef] [Google Scholar]
- Yokochi, R., Marboeuf, U., Quirico, E., & Schmitt, B. 2012, Icarus, 218, 760 [NASA ADS] [CrossRef] [Google Scholar]
All Tables
All Figures
|
Fig. 1 Compilation of the results. Each row corresponds to a noble gas mixture. The desorption trace of the different noble gas:CO2:H2O mixtures are presented in the left column. The data have been corrected for the baseline and the fragmentation factor mentioned in Sect. 2. The integration limits used for further data analysis have been indicated with vertical dashed lines. We note that for neon, only values for T < 120 K have been included, as for higher temperatures the water isotopologues at m/z = 20 are dominant. For argon and krypton, the integration limits had to be adapted to account for the shift in temperature of their low-temperature desorption (noble gas) peak (coloured vertical dashed lines). The desorption behaviour as a function of the temperature of the different ices, normalised to the total amount of desorbing material is presented in the middle column. The integration limits have been indicated. The fractions of noble gas desorbing in the respective temperature regimes are shown in the right column. The integration limits are indicated in the plots of the other columns. |
| In the text | |
|
Fig. 2 Noble gas fractions releasing in the respective temperature regimes with respect to the total noble gas percentage (left), CO2 percentage (middle), and the H2O percentage (right) in the mixture. The integration limits are the same as in Fig. 1. |
| In the text | |
|
Fig. 3 Fractionation of noble gases during warming of the ice. The peak desorption temperatures of the pure phase desorption event of Ar, Kr, Xe, and CO2 are, where relevant, indicated. |
| In the text | |
|
Fig. 4 ROSINA measurements of argon, water, and carbon dioxide at comet 67P. The top row shows the argon densities measured at the location of Rosetta modified by the cometocentric distance squared on the y-axis (modified density). Panel a shows the modified CO2 density on the x-axis, multiplied by a fitted correlation factor (6.2 × 10⁻⁵) by which the CO2 density can be multiplied to obtain the measured argon density within 71% accuracy (1−σ corresponding to a multiplication and division by the 1.71 Stdev factor). Panel b shows the same for H2O and panel c for a linear combination of H2O and CO2. Panels d–f show the reconstructed densities based on these correlation factors for the three time periods investigated (cf. Balsiger et al. 2015; Rubin et al. 2018). For more details see the main text. |
| In the text | |
|
Fig. 5 Trapping efficiencies of noble gases in water plotted against the H2O:noble gas ratio (left column) and the ice thickness in mono-layer (right column). Data are taken from this study (green squares), Schneiderman (2022, purple circles), and Simon et al. (2023, orange triangles). |
| In the text | |
|
Fig. 6 Comparison of noble gas ratios in different sources and experiments. Data points are taken from the following sources: solar: average of Lodders et al. (2009) and Asplund et al. (2009); 67P: Rubin et al. (2018); Titan: Niemann et al. (2010); Earth, Mars: Ozima & Podosek (2002); laboratory experiments: Bar-Nun & Owen (1998); Almayrac et al. (2022). The blue square labelled “L24” indicates the maximum fractionation values found in this work, assuming a solar abundance starting point. |
| In the text | |
|
Fig. B.1 Fraction of the noble gases as a function of the total current measured with the QMS for the relevant mass channels in the chamber. We note that not all mass channels corresponding to a noble gas have been measured. The fractions derived from the NIST database have been indicated with dashed lines in the plots. |
| In the text | |
|
Fig. C.1 Noble gas ratios of Kr/Ar (solid purple line) and Xe/Ar (dashed orange line) versus the ice temperature. The peak desorption temperatures of pure phase Ar, Kr, Xe, and CO2 are indicated with crosses. |
| In the text | |
Current usage metrics show cumulative count of Article Views (full-text article views including HTML views, PDF and ePub downloads, according to the available data) and Abstracts Views on Vision4Press platform.
Data correspond to usage on the plateform after 2015. The current usage metrics is available 48-96 hours after online publication and is updated daily on week days.
Initial download of the metrics may take a while.