Fig. 6
Download original image
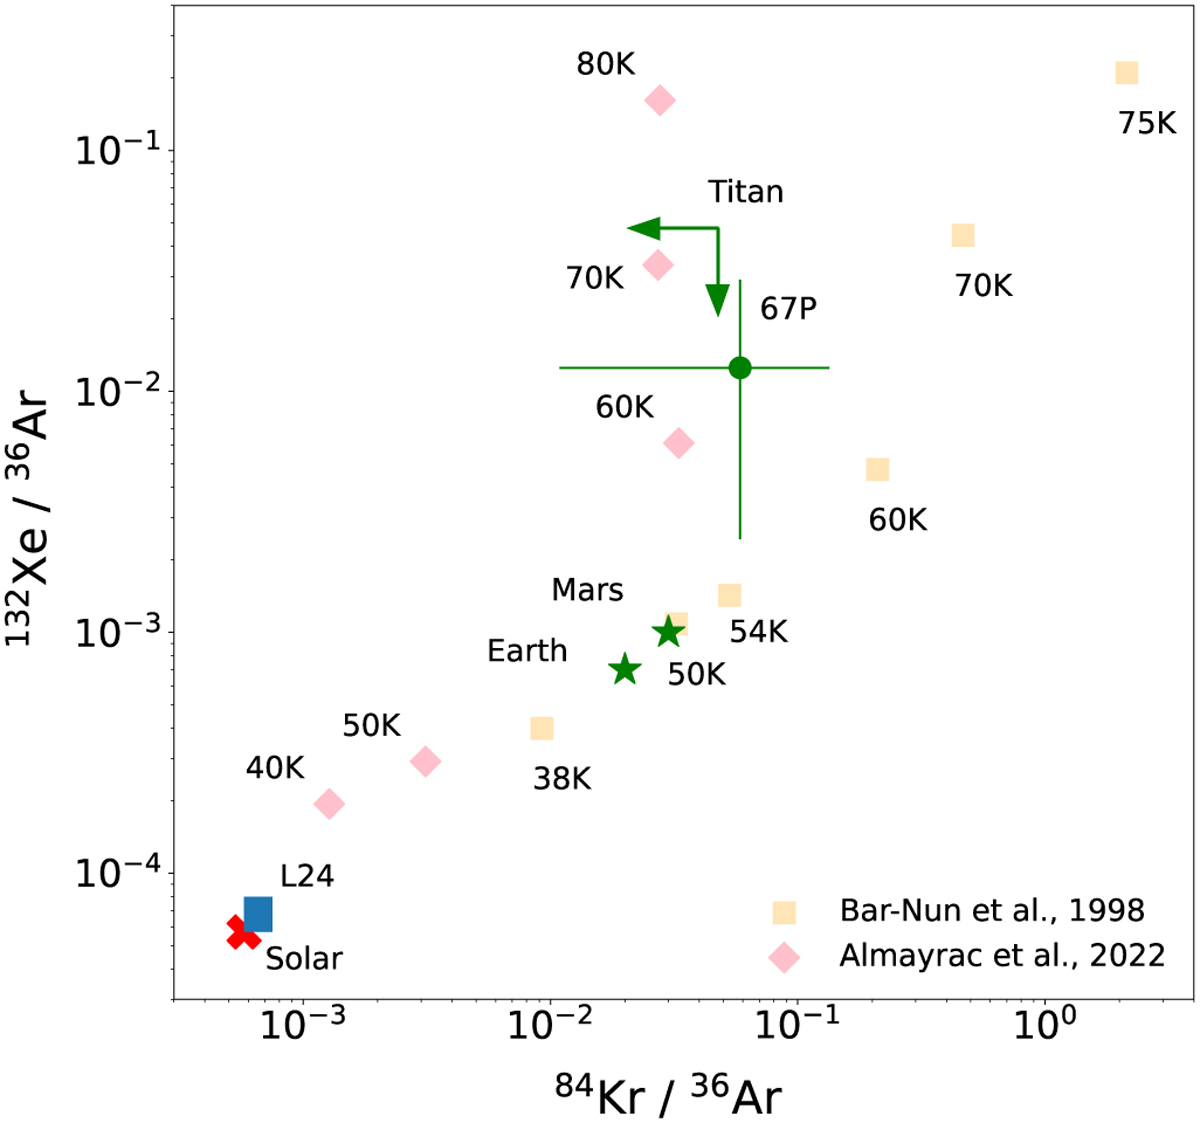
Comparison of noble gas ratios in different sources and experiments. Data points are taken from the following sources: solar: average of Lodders et al. (2009) and Asplund et al. (2009); 67P: Rubin et al. (2018); Titan: Niemann et al. (2010); Earth, Mars: Ozima & Podosek (2002); laboratory experiments: Bar-Nun & Owen (1998); Almayrac et al. (2022). The blue square labelled “L24” indicates the maximum fractionation values found in this work, assuming a solar abundance starting point.
Current usage metrics show cumulative count of Article Views (full-text article views including HTML views, PDF and ePub downloads, according to the available data) and Abstracts Views on Vision4Press platform.
Data correspond to usage on the plateform after 2015. The current usage metrics is available 48-96 hours after online publication and is updated daily on week days.
Initial download of the metrics may take a while.