Fig. 1
Download original image
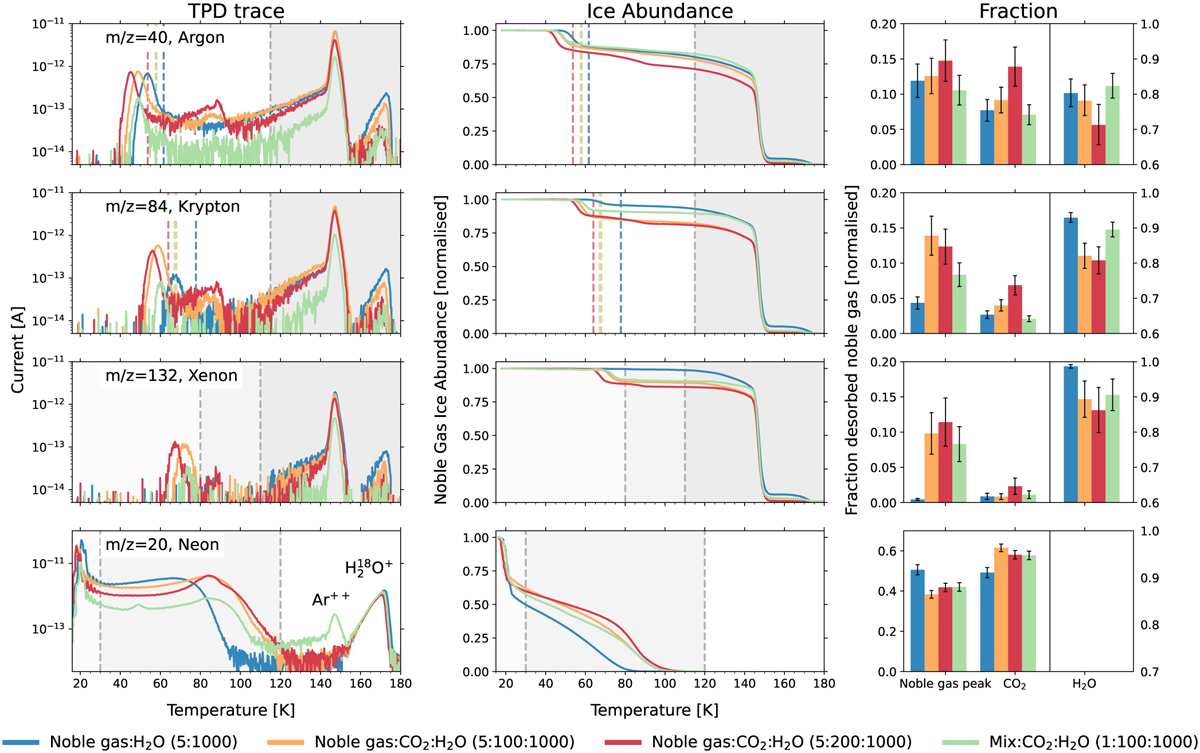
Compilation of the results. Each row corresponds to a noble gas mixture. The desorption trace of the different noble gas:CO2:H2O mixtures are presented in the left column. The data have been corrected for the baseline and the fragmentation factor mentioned in Sect. 2. The integration limits used for further data analysis have been indicated with vertical dashed lines. We note that for neon, only values for T < 120 K have been included, as for higher temperatures the water isotopologues at m/z = 20 are dominant. For argon and krypton, the integration limits had to be adapted to account for the shift in temperature of their low-temperature desorption (noble gas) peak (coloured vertical dashed lines). The desorption behaviour as a function of the temperature of the different ices, normalised to the total amount of desorbing material is presented in the middle column. The integration limits have been indicated. The fractions of noble gas desorbing in the respective temperature regimes are shown in the right column. The integration limits are indicated in the plots of the other columns.
Current usage metrics show cumulative count of Article Views (full-text article views including HTML views, PDF and ePub downloads, according to the available data) and Abstracts Views on Vision4Press platform.
Data correspond to usage on the plateform after 2015. The current usage metrics is available 48-96 hours after online publication and is updated daily on week days.
Initial download of the metrics may take a while.