Fig. 5.
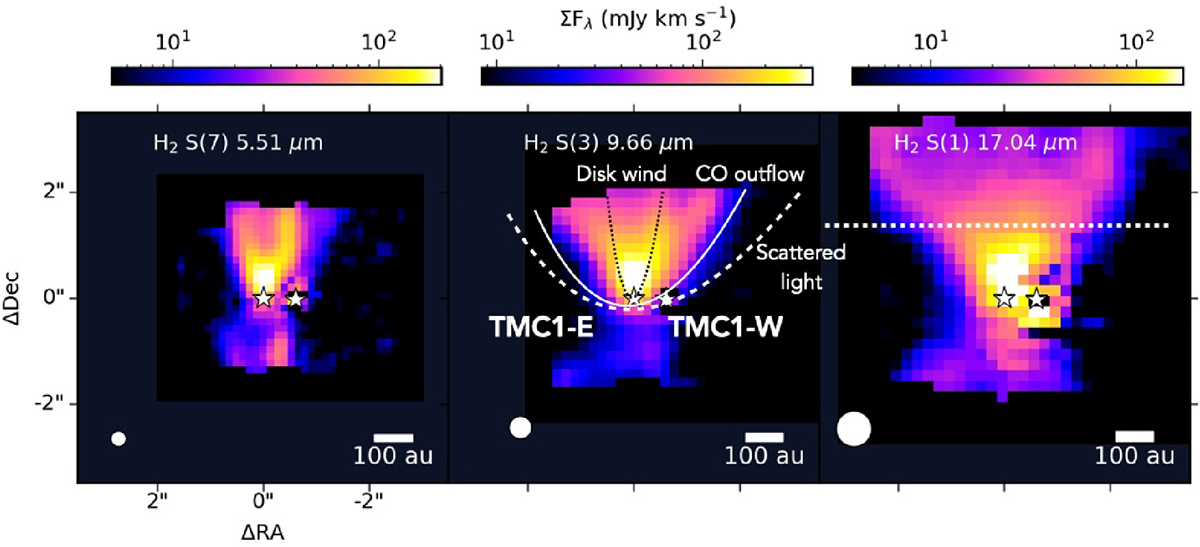
Download original image
Three pure rotational transitions of H2 from left to right: S(7) at 5.51 μm, S(3) at 9.66 μm, and S(1) at 17.04 μm. Integrated emission maps are created from the cubes after subtracting the local continuum. The positions of the protostars measured from the line-free region at 5 μm are shown with white stars. Maps are centered on the position of the TMC1-W source. The horizontal dotted line in the right panel indicates the cut for which different H2 0–0 S bands are shown in Fig. 6. The physical components of the system are illustrated in the middle panel. The disk wind is indicated based on H2 S(7), CO outflow is based on the ALMA observations, and scattered light on the HST 1.6 μm image in Fig. 8. Bottom-left corners: MIRI-MRS empirical FWHM of PSF (Law et al. 2023) indicated as a white circle.
Current usage metrics show cumulative count of Article Views (full-text article views including HTML views, PDF and ePub downloads, according to the available data) and Abstracts Views on Vision4Press platform.
Data correspond to usage on the plateform after 2015. The current usage metrics is available 48-96 hours after online publication and is updated daily on week days.
Initial download of the metrics may take a while.