Fig. 3.
Download original image
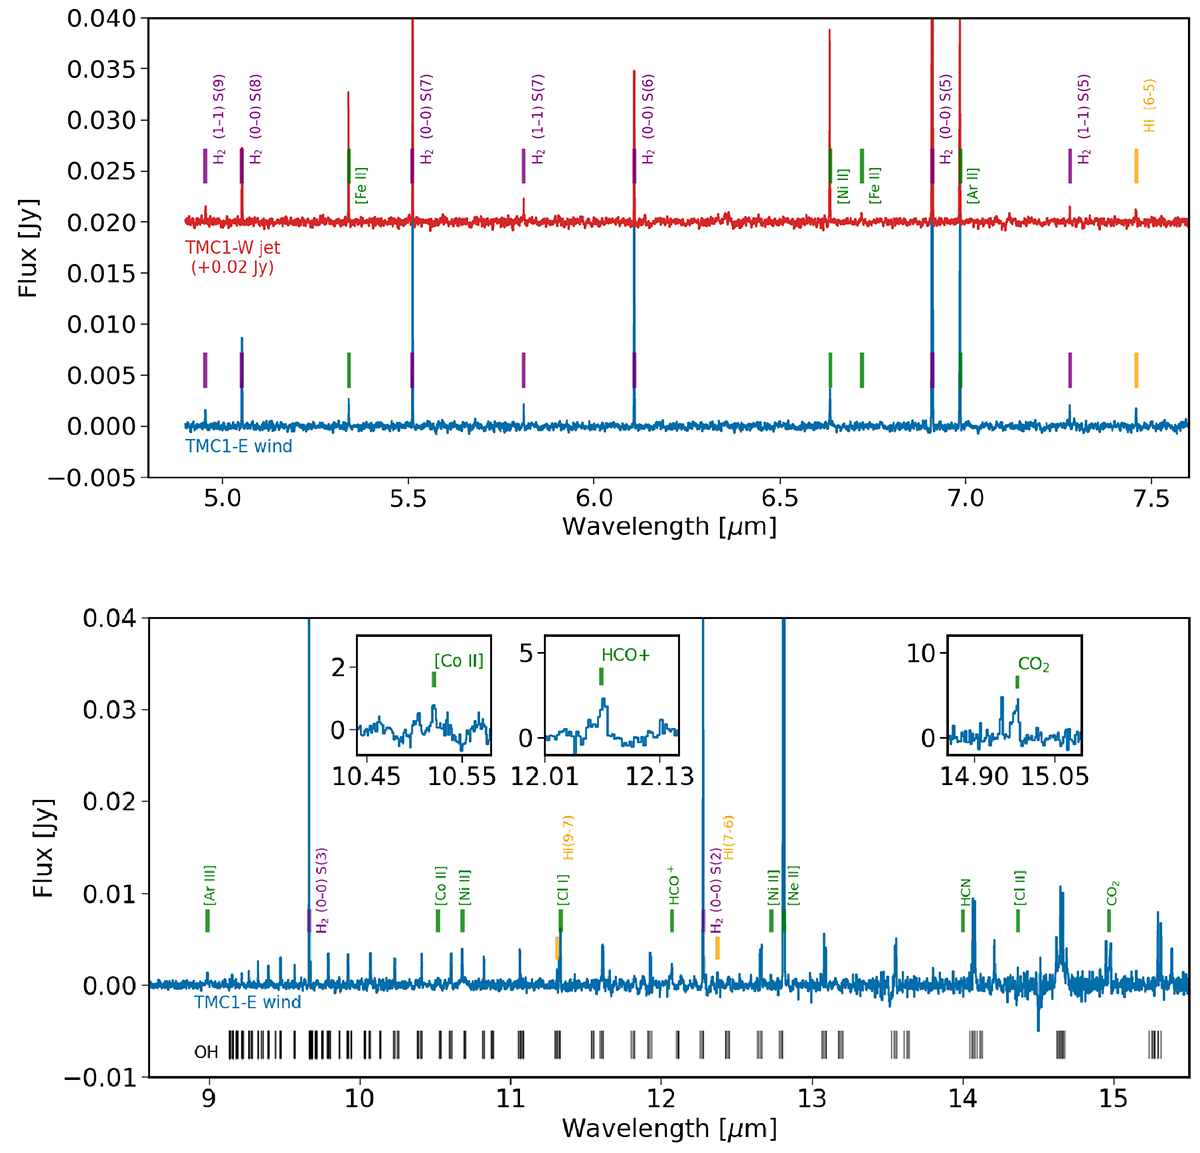
MIRI-MRS spectra from the outflow positions. Spectra were continuum subtracted using a spline fit to line-free regions. The H2 transitions are shown in purple, the hydrogen recombination line in yellow, and fine structure atomic lines in green. Top: TMC1-W jet (red) and TMC1-E wind (blue). Bottom: TMC1-E wind spectra. OH catalog emission line positions are shown as black markers (Yousefi et al. 2018; Tabone et al. 2021). Insets: [Co II] 10.521 μm, HCO+ 12.069 μm, and CO2 14.98 μm lines identified in the spectra. Flux in the insets converted to mJy.
Current usage metrics show cumulative count of Article Views (full-text article views including HTML views, PDF and ePub downloads, according to the available data) and Abstracts Views on Vision4Press platform.
Data correspond to usage on the plateform after 2015. The current usage metrics is available 48-96 hours after online publication and is updated daily on week days.
Initial download of the metrics may take a while.