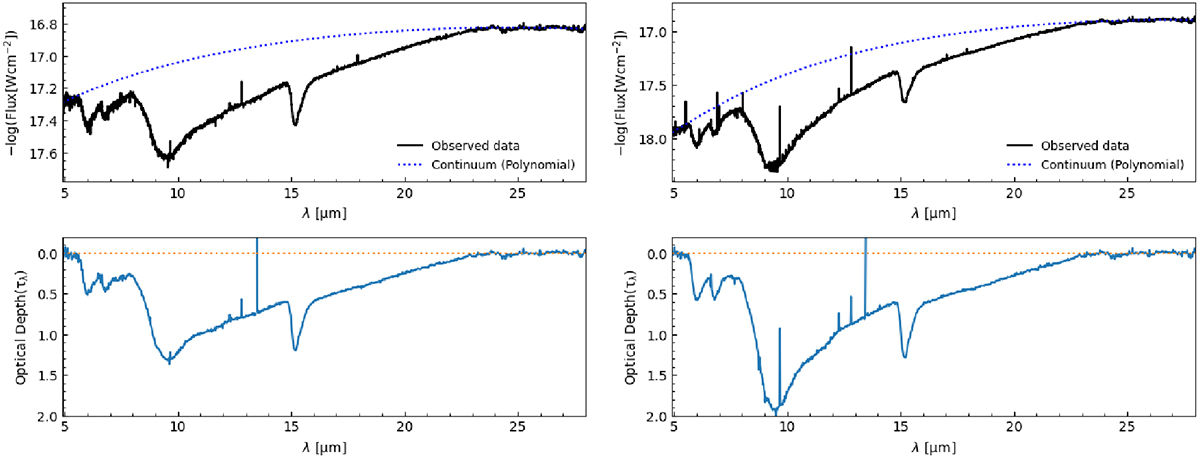
Fig. A.1.
Download original image
Spectra extracted from 2 x PSF FWHM on the continuum position (top) of TMC1-W (top-left) and TMC1-E (top-right). The dashed blue line represents a polynomial fit to the continuum. optical depth as a function of wavelength resulting from dividing the polynomial fit with the observed continuum (bottom). The orange dashed line represents τ = 0. The range of extincition is calculated using optical depth value at the silicate feature following the equations: AV = τ9.7 × 18.5, and AV = τ9.7 × 9, representing the correlation found in diffuse ISM and galactic centre dense clouds, respectively (McClure 2009; Weingartner & Draine 2001; Chiar et al. 2007; Boogert et al. 2000).
Current usage metrics show cumulative count of Article Views (full-text article views including HTML views, PDF and ePub downloads, according to the available data) and Abstracts Views on Vision4Press platform.
Data correspond to usage on the plateform after 2015. The current usage metrics is available 48-96 hours after online publication and is updated daily on week days.
Initial download of the metrics may take a while.