Fig. 1.
Download original image
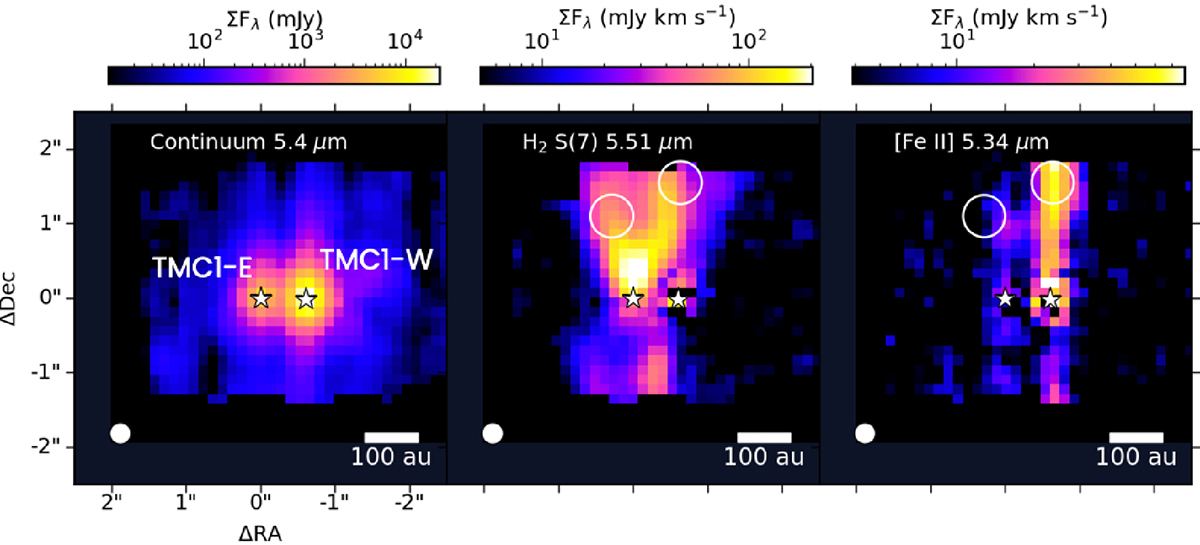
Continuum emission at 5.4 μm obtained from line-free spectral channels in Channel 1 (left). Center: integrated emission of H2 0–0 S(7) line at 5.51 μm in colorscale. Right: integrated emission of [Fe II] line at 5.34 μm in color scale. Stars mark the MIR peak continuum position of the protostars. White circles show regions from which the spectra at the outflow positions were obtained, with diameters corresponding to two times the MIRI-MRS point-spread function (PSF) at 5.5 μm. In the bottom-left corners, MIRI-MRS empirical FWHM of PSF (Law et al. 2023) is indicated as a white circle.
Current usage metrics show cumulative count of Article Views (full-text article views including HTML views, PDF and ePub downloads, according to the available data) and Abstracts Views on Vision4Press platform.
Data correspond to usage on the plateform after 2015. The current usage metrics is available 48-96 hours after online publication and is updated daily on week days.
Initial download of the metrics may take a while.