| Issue |
A&A
Volume 687, July 2024
|
|
|---|---|---|
| Article Number | A97 | |
| Number of page(s) | 12 | |
| Section | Interstellar and circumstellar matter | |
| DOI | https://doi.org/10.1051/0004-6361/202348820 | |
| Published online | 02 July 2024 | |
Excitation mechanisms of C II optical permitted lines in ionized nebulae
1
Instituto de Astrofísica de Canarias,
E-38205 La
Laguna,
Tenerife,
Spain
e-mail: ereyes@iac.es
2
Departamento de Astrofísica, Universidad de La Laguna,
E-38206
La Laguna,
Tenerife,
Spain
3
Astronomisches Rechen-Institut, Zentrum für Astronomie der Universität Heidelberg,
Mönchhofstraße 12–14,
69120
Heidelberg,
Germany
4
Instituto de Astronomía, Universidad Nacional Autónoma de México,
A.P. 70-264, 04510 México, D.F.,
México,
Mexico
5
Center for Astrophysics and Space Science, New York University,
Abu Dhabi,
UAE
Received:
1
December
2023
Accepted:
28
April
2024
Context. Carbon is the fourth most abundant element in the universe and its distribution is critical to understanding stellar evolution and nucleosynthesis. In optical studies of ionized nebulae, the only way to determine the C/H abundance is by using faint C II recombination lines (RLs). However, these lines give systematically higher abundances than their collisionally excited counterparts, observable at ultraviolet (UV) wavelengths. Therefore, a proper understanding of the excitation mechanisms of the faint permitted lines is crucial for addressing this long-standing abundance discrepancy (AD) problem.
Aims. In this study, we investigate the excitation mechanisms of C II lines λλ3918, 3920, 4267, 5342, 6151, 6462, 7231, 7236, 7237, and 9903.
Methods. We use the DEep Spectra of Ionized REgions Database (DESIRED) that contains spectra of H II regions, planetary nebulae and other objects to analyze the fluorescence contributions to these lines and the accuracy of the atomic recombination data used to model the C+ ion.
Results. We find that C II λλ4267, 5342, 6151, 6462, and 9903 arise exclusively from recombinations with no fluorescent contributions. In addition, the recombination theory for these lines is consistent with the observations. Our findings show that the AD problem for C2+ is not due to fluorescence in the widely used C II lines or errors in their atomic parameters, but to other phenomena such as temperature variations or chemical inhomogeneities. On the other hand, C II λλ3918, 3920, 6578, 7231, 7236, 7237 have important fluorescent contributions, which are inadvisable for tracing the C2+ abundances. We also discuss the effects of possible inconsistencies in the atomic effective recombination coefficients of C II λλ6578, 7231, 7236, and 7237.
Key words: methods: numerical / techniques: spectroscopic / ISM: abundances / HII regions / planetary nebulae: general
© The Authors 2024
 Open Access article, published by EDP Sciences, under the terms of the Creative Commons Attribution License (https://creativecommons.org/licenses/by/4.0), which permits unrestricted use, distribution, and reproduction in any medium, provided the original work is properly cited.
This article is published in open access under the Subscribe to Open model. Subscribe to A&A to support open access publication.
1 Introduction
Deep spectra of bright photoionized nebulae are rich in emission lines that allow us to derive their physical conditions and chemical composition. For this reason, detailed knowledge of the atomic processes that give rise to these lines is required. In the first spectroscopic works, some of the brightest lines were associated to the existence of an exotic element, unknown on earth (Huggins & Miller 1864) named nebulium (Huggins 1898). Some years later, however, Bowen (1927) showed that the unidentified bright emission lines arise from electric dipole-forbidden transitions from O+, N+, and O2+ ions.
Forbidden lines are produced by magnetic dipole and/or electric quadrupole interactions between metastable states, typically as a result of collisional excitation (Bowen 1928), and are being named collisional excited lines (CELs) in such case. Permitted transitions are also common in the nebular spectra, with the H I and He I lines being the brightest examples. Many of these lines arise from recombinations of free electrons and are consequently known as recombination lines (hereafter RLs). Permitted lines from heavy elements can also be found (Bowen & Wyse 1939), although they can be up to four orders of magnitude weaker than their forbidden counterparts (García-Rojas & Esteban 2007).
Nonetheless, not all the forbidden lines originate from col-lisional excitation, nor are all the permitted lines recombination lines. For example, [N I] λλ5l98, 5200 or many [Fe II] lines in the blue range of the optical spectrum can be produced by continuum pumping fluorescent excitation (Rodríguez 1999; Ferland et al. 2012). The interpretation of these lines in terms of col-lisional excitation would lead to wrong conclusions about the physical conditions and chemical composition of nebulae. Similarly, fluorescent starlight and/or resonance excitation can also give rise to permitted lines (Bowen 1935; Seaton 1968), which could lead to an overestimation of the heavy element abundances (relative to hydrogen) when these lines are interpreted as RLs.
In fact, since the pioneering work by Bowen & Wyse (1939) and Wyse (1942), it has been known that the heavy element abundances (relative to hydrogen) derived from optical permitted lines are systematically higher than those obtained from forbidden lines (see e.g. Liu 2006; García-Rojas & Esteban 2007, and references therein), which defines the well known abundance discrepancy (AD) problem. Since this discrepancy can have important implications for understanding the chemical evolution of the universe (Peimbert et al. 2017; García-Rojas et al. 2019; Maiolino & Mannucci 2019), it becomes essential to analyze the excitation mechanisms of permitted lines in order to resolve this problem.
Escalante et al. (2012) demonstrated that the majority of observed intensities from the f and g states of C II , N I, N II , O I , and O II in the ionized region of the low-excitation planetary nebula IC 418 could be explained by the available recombination rates currently available. They also found that fluorescence significantly contributed to the excitation of most lines of the s, p, and d states in C II , as well as some p and d states of O II . A similar study that focused on the N II spectrum of the Orion Nebula was conducted by Escalante & Morisset (2005). However, there has been no attempt in the literature to generalize results regarding the excitation mechanisms of permitted lines constrained by a large observational sample. This is crucial because the influence of fluorescence on different lines depends on the particular characteristics of the spectral energy distribution (SED) of the ionizing spectrum. Extrapolating conclusions about excitation mechanisms of permitted lines from a study designed for a specific object or a small sample may not be appropriate.
The C II permitted lines are a key piece for addressing the AD problem since many of them are accessible at optical wavelengths. In Fig. 1, we show the C II – Grotrian diagram (Grotrian et al. 1928) of the optical permitted electronic transitions (adapted from Moore & Merrill 1968). Given the ground state configuration 2p 2P, high-L energy levels (e.g., 2F, 2G), will have very low probabilities of being excited by fluorescence (Grandi 1976), whereas 2S, 2D terms can be directly populated through UV continuum photon pumping (Grandi 1976; Escalante et al. 2012), specially the 4s 2S, 3d 2D states, and potentially excited by ~638 Å and ~687 Å photons, respectively.
Although the probability of direct fluorescent excitation between high-L levels and the ground state can be rather low, cascade interconnections with higher levels could propagate the fluorescence to levels that would otherwise be only populated by recombination. This is the case for the 3p 2P level that gives rise to the C II λ6578 line and is interconnected to the 4s 2S and 3d 2D states via C II λλ3918, 20, λλ7231, 36, 37 emission lines. Although unlikely, as radiative d → f transitions are rather weak due to their increase in orbital angular momentum, the same principle could apply to other lines considered as RLs, such as C II λ4267. Given the importance of this line, it is necessary to observe and test for the presence of any unforeseen fluorescent effects in a global context.
Schematically, a C II radiative recombination process is represented by:
 (1)
(1)
where the left side represents the capture of a free electron by the C2+ ion, leaving as a result a C+ ion and the emission of permitted lines of total energy hv. In the case of a fluorescent excitation process:
 (2)
(2)
where the left side represents the excitation of a C+ atom by a photon of energy hv0, that gives rise to an excited *C+ ion that will eventually decay to its ground state through a cascade of permitted transitions. This implies that recombination lines will depend on the number of C2+ ions available, whereas those lines produced by fluorescence will depend on the available C+ ions. On the other hand, we should note that the C2+/C+ abundance fraction depends on the ionization parameter of the gas, U, and will be correlated with other ionic indicators such as O2+/O+. Therefore, this allows us to observationally establish the relative importance of fluorescent excitation by comparing the line intensity ratio of the C II permitted lines with the degree of ionization of the plasma.
In this work, we analyze the excitation mechanisms of several optical C II permitted lines using the DEep Spectra of Ionized REgions Database (DESiRED, Méndez-Delgado et al. 2023a). This allows us to determine the importance of fluorescence excitation on some commonly observed C II lines, by comparing different ionized objects such as H II regions, planetary nebulae (PNe), photoionized Herbig-Haro objects (HHs) and Ring Nebulae (RNe). Furthermore, we test the theoretical predictions of the effective recombination coefficients of Pequignot et al. (1991) and Davey et al. (2000), the most widely used to model the C II lines and derive the C2+/H+ abundances.
This paper is organized as follows: in Sect. 2 we describe the observational sample used in this study; in Sect. 3 we give details on the methodology we have followed. The results on the different C II transitions that are the subject of our study are presented in Sect. 4. Some discussion on the implications of our findings concerning the abundance discrepancy problem is presented in Sect. 5. Finally our conclusions are summarized in Sect. 6.
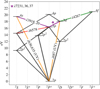 |
Fig. 1 Grotrian diagram showing the permitted electronic transitions of the C II ion energy levels (adapted from Moore & Merrill 1968). In green we show the transition causing the C II 14267 line where the main excitation mechanism is recombination; purple lines show the transitions behind the C II λλ3918, 3920, and λλ7231, 7236, 7237 lines (these last ones marked with a purple star) that are likely to be excited by photon pumping from the continuum (orange transitions). The line we most focus on this project is shown in red. Its corresponding upper level can be seen to be interconnected to the emission of the C II λλ3918, 3920, λλ7231, 7236, 7237 lines, potentially excited by fluorescence. The values shown on the vertical axis represent the energy level separation from the ground level 2p. In grey are shown alternative deexcitation transitions that lead to populating the ground level 2p. |
Observatories and spectrographs used to obtain the analysed spectra.
Electronic configurations and energy levels of the different C II transitions analysed in this work.
2 Observational sample
In order to study the effect of fluorescence on the faint C II permitted lines, we use the DESIRED observational sample (Méndez-Delgado et al. 2023a). This database comprises intermediate-to-high spectral resolution (R ~ 3000 to ~33 000) long-slit or echelle spectra compiled from the literature of about 190 Galactic and extragalactic H II regions as well as Galactic PNe, photoionized Herbig–Haro (HH) objects, and ring nebulae around very massive young stars. As the observations were designed to detect very faint emission lines (most of them were obtained with large-aperture − 8–10 m - telescopes), this collection of nebular spectra contains tens or even hundreds of emission lines for each individual object, including multiple faint permitted lines of C, N, O, and Ne. A summary of the different spectrographs used to obtain the spectra contained in this database is shown in Table 1.
We hereafter consider all the spectra from the DESIRED sample that present more than two measured optical permitted C II lines. The list of objects is presented in Table A.1. In total, we use 31 spectra of Galactic PNe, 21 of Galactic H II regions, 13 of extragalactic H II regions, and 4 of HH objects. More details on the observations referred to in this paper can be found in Méndez-Delgado et al. (2023a), where information on the spectral resolution, wavelength coverage, and the instrument with which each spectra was taken is provided. The lines considered in this work and their configuration – taken from the Atomic Line List v3.00b4 (van Hoof 2018) – are shown in Table 2 and plotted in Fig. 1.
3 Methodology
In order to directly analyze the excitation mechanisms of the various transitions shown in Table 2, we proceed to compare the different line intensity ratios with the degree of ionization as traced by the parameter P (Pilyugin 2001), which is defined as follows:
![$P = {{I([{\rm{OIII}}]\lambda \lambda 4959 + 5007)} \over {I([{\rm{OIII}}]\lambda \lambda 4959 + 5007) + I([{\rm{OII}}]\lambda \lambda 3726 + 3729)}}.$](/articles/aa/full_html/2024/07/aa48820-23/aa48820-23-eq3.png) (3)
(3)
Interestingly, our sample extends over the full range of ion-ization degree, from P ≃ 0 up to P ≃ 1. We are aware that this parameter is slightly sensitive to both electron density and temperature, however, we have utilized the model sample from BOND (Vale Asari et al. 2016) to confirm the good correlation between P and the degree of ionization (given by O2+/O). Additionally, it is a more easily observable ratio than e.g. He II /He I, which is not observable in most H II regions, or He I /H I which can be affected by uncorrected He I stellar absorptions. Given the high spectral resolution of some observations reported by DESIRED, some multiplets could actually be resolved into their different component lines. This is the case for instance for the 3p 2Po–4s 2S, 3d 2D-4f 2Fo, 3p 2Po-3d 2D multiplets. In order to establish an auto-consistent comparison throughout the whole data sample, we have summed up the intensities of the different components to simulate a blend of the multiplet lines.
As mentioned in Sect. 1, the intensity of a line is proportional to the density of emitting ions. If we compare two recombination lines, the intensity of each line will be proportional to the C2+ density multiplied by the electron density (ne) and the electron temperature (Te) at a power close to –1. Therefore, the line intensity ratio can be expected to be fixed by the atomic recombination probability ratios.
On the other hand, if one line is excited by recombination while the other arises mostly from fluorescence, the line intensity ratio will depend on the C2+/C+ abundance ratio. Therefore, the line intensity ratio is expected to correlate with P, although the correlation can become more complex as some hard-to-know factors such as the effective temperature of the ionizing source or the optical depth may also play a significant role. The most complex case will arise when comparisons are made with two lines arising from fluorescent excitation. This analysis could for instance reveal the prevalence of one fluorescence channel with respect to another as a result of differences in their physical conditions or to their more direct interconnection.
In order to compare the observed line intensity ratios with theoretical predictions, we tested the effective recombination coefficients of Pequignot et al. (1991) and Davey et al. (2000). Briefly, Pequignot et al. (1991) calculated the total and effective radiative C II recombination coefficients by considering an electron temperature that ranges from ~5000 K to ~20 000 K for a low-density (optically thin) plasma. On the other hand, Davey et al. (2000) considered the effective recombination coefficients for C II transitions for a temperature that ranges from 5000 K to 20 000 K and at a constant electron density of 104 cm–3. They obtained bound-bound and bound-free radiative estimates that incorporate both radiative and dielec-tronic recombination effects. In addition, they also include the effects of electronic collisions which can induce excited states.
4 Results from our analysis
In this section, we show the different C II line intensity ratios as function of P. In all figures we use different markers in order to distinguish line intensity ratios from Galactic and extra-galactic H II regions, PNe, RNe, and HHs. We also consider two color bands with the theoretical predictions of Pequignot et al. (1991) and Davey et al. (2000) covering the range from 4000 to 15 000 K at a density of 103 cm–3. The code PYNEB v1.1.16 Python package (Luridiana et al. 2015) was used to calculate these line intensity ratios. These color bands allow us to distinguish whether the observed dispersion may be due to temperature variations or to fluorescence effects. In all cases we adopt the theoretical ratios predicted under case B for the C II levels. Note, however, that those lines arising from levels of 2Fo,2G terms are case-independent.
We begin by analyzing the 2Fo-2G and 2D-2Fo transitions since in principle they are the least likely transitions to be excited through continuum pumping. Their intensities will be subsequently compared to the C II λ4267 line, since its observed intensity is by far the most frequently used to estimate the abundance ratio of C2+/H+ (Peimbert et al. 1995; Esteban et al. 2005, 2014; Skillman et al. 2020). Afterwards, we will analyze the 2Po-2D and 2Po-2S transitions and their relationship to the C II λ4267 line. Continuum pumping via fluorescent excitation is likely to contribute greatly to the 2S and 2D levels. Finally, we will focus on the excitation mechanism of the C II λ6578 line that arises from the 2S-2Po transition and which can be contaminated through secondary fluorescent channels.
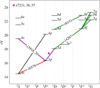 |
Fig. 2 Grotrian diagram showing permitted electronic transitions between the energy levels of the C II ion (adopted from Grandi 1976). In green we show the transitions that generate the C II λ4267, λ5342, λ6151, λ6462, and λ9903 recombination lines; in purple we show the transitions causing the C II λλ3918, 3920, λλ7231, 7236, 7237 lines that are likely excited by photon pumping from the continuum. The line that focus our attention is shown in red. Its upper source level is interconnected with the emission of the C II λλ3918, 3920, λλ7231, 7236, 7237 lines. The values in eV on the vertical axis represent the energy level separations from the ground level. Notice that the 4f–7g, 4f–6g, and 4f–5g transitions shown in green give rise to the C II λ5342, λ6462, and λ9903 lines, respectively, and subsequently to the emission of the λ4267 line. |
4.1 C II 2Fo-2G and 2D-2Fo transitions: λλ5342, 6462, 9903, and λλ4267, 6151
Direct excitation from the ground state to the 2G or 2Fo levels are strongly forbidden given that ΔL = 3 and ΔL = 2, respectively. Therefore, in order to get important continuum pumping contribution to the intensity of lines such as C II λλ4267, 6151, 5342, 6462, 9903 (see Fig. 2), an interconnection via a fluorescent channel is required. Such channel could be due to a metastable intermediate level that promotes self-absorption or to cascade-decays from upper levels via continuum pumping excitation. In the case of transitions arising from the 2G levels, the last scenario would require decaying through two intermediate levels in order to preserve ΔL = 1. As the aforementioned lines arise from very high excited levels with energies close to the ionization threshold, this process appears rather unlikely.
In Fig. 3, we show the line intensity ratios I(C II λ5342)/ I(C II λ4267, I(C II λ6151)/I(C II λ4267), I(C II λ6462)/ I(C II λ4267), and I(C II λ9903)/I(C II λ4267) as a function of P. The panels are ordered according to the energy level that gives rise to the line that appears as numerator. The top panel always corresponds to the highest energy level (e.g., C II λ5342: 23.27 eV). It should be noted that among the lines considered, C II λ4267 is the line that arises from the lowest energy level in Fig. 1 (20.95 eV). in all cases, Fig. 3 shows rather constant line intensity ratios with respect to P values. The observed values and their dispersion are shown in Table 3.
A quick glance at Fig. 3 reveals that the data follows the expected trend for lines produced by recombination. Furthermore, Table 3 reveals good consistency with the theoretical predictions for these transitions from both Pequignot et al. (1991) and Davey et al. (2000). The two outliers shown in the bottom panel of Fig. 3 are HH 204 (Méndez-Delgado et al. 2021b) and M 16 (García-Rojas et al. 2006). In the first case, it is explained by the partial blend that occurs between the C II λ4267 emission from HH 204 and the nebular emission from M 42. In the case of M 16, García-Rojas et al. (2006) report the presence of telluric absorption bands that affect the C II λ9903 line, which explains the observed behaviour.
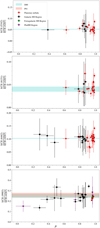 |
Fig. 3 Intensity ratios of recombination lines. From top to bottom: I(C II λ5342)/I(C II λ4267), I(C II λ6151)/I(C II λ4267), I(C II λ6462/ I(C II λ4267), and I(C II λ9903)/I(C II λ4267) ratios of all analyzed regions: galactic PNe (red circles), galactic H II regions (black diamonds), extragalactic H II regions (green squares), and photoionized Herbig-Haro objects (purple stars) as a function of the degree of ion-ization P. The red band shows the theoretical ratio expected for nebular conditions consisting of a temperature in the range 4000–15 000 K and a density 103 cm−3 assuming the atomic data of Pequignot et al. (1991) (P91, only available for C II 4267 and 9903) while the blue band shows the theoretical ratio expected when adopting the atomic data of Davey et al. (2000) (D00). |
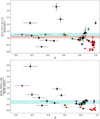 |
Fig. 4 I(C II λ7231+36+37)/I (C II λ4267) ratio (top panel) and I(C II λ3918+20)/I(C II λ4267) ratio (bottom panel) of all analyzed regions with respect to the degree of ionization P. Symbols and color bands are the same as in Fig. 3. Notice that Pequignot et al. (1991) do not include computations for the C II λλ3918, 3920 lines. |
4.2 C II 2Po-2D and 2Po-2S transitions: λ7231+36+37 and λ3918+20
In addition to recombination processes, the C II 2D and 2S levels can be populated through continuum pumping fluorescence channels that connect to the ground level, as indicated in Fig. 2. These levels give rise to the following lines λ3918+20 (3p 2Po-4s 2S) and λ7231+36+37 (3p 2Po-3d 2D), commonly observed in deep optical spectra. By comparing the line intensity ratio of these lines with λ4267 (or any other recombination line, see Sect. 4.1) it is possible to determine the fraction due to fluorescence.
In Fig. 4, we show the observed I(C II λ7231+36+37)/ I(C II λ4267) and I(C II λ3918+20)/I(C II λ4267) line intensity ratios. Unlike what is shown in Fig. 3, these line intensity ratios show a trend with the ionization degree of the gas, as represented by P. This means that a fraction of the emission of C II λ3918+20 and λ7231+36+37 is proportional to the ionic density of C+ rather than C2+, indicating a general contribution from fluorescence. In Fig. 4, ƒ(C II λ3918+20)/ƒ(C II λ4267) line intensity ratio shows a rather clear trend with respect to P. This seems to indicate that recombination in C II λ7231+36+37 could be more important than for C II λ3918+20, although it may be not the dominant excitation mechanism. It seems that for some PNe with the highest degree of ionization, where recombination dominates over fluorescence as the C+/C2+ is minimum, the line ratios saturate to a minimum value. The wide dispersion shown in these figures is due to the dependence of fluorescence on both the optical depth and the effective temperature of the ionizing source. These parameters on the other hand are expected to display a wide range of values among H II regions, PNe and HHs.
It is interesting to note in the top panel of Fig. 4 that a significant fraction of objects show I(C II λ7231+36+37)/ I(C II λ4267) values below the recombination predictions of the atomic models of both Pequignot et al. (1991) and Davey et al. (2000), assuming case B and gas temperatures between 4000 and 15 000 K. This could be due to different factors: (i) the adopted effective recombination coefficients underestimate the recombination emissivity of C II λ4267, (ii) the gas temperature is much lower than 4000 K, (iii) disturbance on the characteristics of the atomic levels (broadening, lifetime, etc) due to fluorescence that would change the coefficients of all those high excited states when solving their level populations equations (Nemer et al. 2019), (iv) when the population of C+/C2+ is low enough, the 687 Å photon pumping from ground level to the 3d 2D level is negligible, practically reaching “case A” optical conditions for this C II transition or (v) the adopted effective recombination coefficients overestimate the recombination emissivity of C II λ7231+36+37.
The results of Sect. 4.1 discard the first scenario since Fig. 3 shows an excellent agreement between the predicted values of C II λ4267 with respect to the other lines that are produced by pure recombination. The second scenario is discarded by the fact that even under the extremely low temperature conditions of ~500 K the prediction is λ7231+36+37/λ4267 ~ 0.9.
Since fluorescence is a radiation-related process, a theoretical model that includes radiation transport is needed to explore hypotheses (iii) and (iv). We use the code Cloudy (Ferland et al. 2017) to simulate the Orion Nebula, the H II region known in the greatest detail. The central source is taken from Kurucz stellar atmosphere atlas (Kurucz 1991) with Teff = 39600 K which depicts the detailed SED of an OVI star as the ionizing source of the nebula with a surface flux of hydrogen-ionizing photons of 1013 cm–2 s–1. The model is defined with constant gas pressure, particle density 104 cm–3, and Orion Nebula abundances and grains. We use the atomic data from Chianti database (Landi et al. 2012) which include 158 energy levels for the C+ ion. For more details please refer to Cloudy test suite orion_hii_open. We predict the intensity of the C II λ3918+20, λ4267, λ6578, λ7231+36+37, and λ9903 lines, and calculate their ratios obtaining the results shown in Table 4. In this table we also compare the predicted ratios with the observed values obtained by Esteban et al. (2004) and the recombination predictions from Davey et al. (2000).
From Table 4, it is clear that by considering radiation transport in the photoionization model, we can get values both above and below the recombination predictions. However, the ratios predicted by the model differ significantly from the observed values, except for the case of the I(C II λ9903)/I(C II λ4267) line ratio, which involves two lines purely excited by recombination (see Sect. 4.1). This highlights the difficulty of properly modeling the line fluxes when fluorescent excitation plays an important role. Creating a detailed model for each of the studied regions here is beyond the scope of this article. Such models would require comprehensive information about the effective temperature of the ionizing sources, which is not available in many cases. It is important to mention that effect (iii) is difficult to differentiate from (iv). In practical terms, continuum pumping from the ground level to the 3d 2D level is a fluorescent effect inherently related to the optical depth of C+.
The previous discussion shows that the observed trends in Fig. 4, which includes the presence of some points below the theoretical predictions of recombination, is an effect of fluorescence. However, we cannot rule out the possibility of having some overestimation of the recombination emissivity due to the effective recombination coefficients of C II λ7231+36+37 as mentioned in (v). Overestimation in the effective recombination coefficients related to lines C II λ7231+36+37 could cause an underestimation of the derived fluorescent contribution to these same lines.
Observed line intensity ratios from the C II 2Fo-2G and 2D-2Fo transitions that are compared to theoretical predictions where the temperature covers the range 4000–15 000 K.
C II line ratios obtained from a photoionization models simulating Orion’s dust and chemical abundances, the observed values from Esteban et al. (2004), and the predicted values from recombination by Davey et al. (2000).
4.3 C II 2S-2Po transition: λ6578
We will now focus on analyzing the excitation mechanism of the 3p2Po level that gives rise to the C II λ6578 line by decaying to the 3s 2S level. The 3p 2Po level does not have a direct continuum pumping channel from the ground level. However, the transitions 3p2Po-4s2S and 3p 2Po-3d2S, that give rise to the C II λ3918+20 and λ7231+36+37 lines could propagate the fluorescent effects to the 3p 2Po level. If recombination could dominate over fluorescence in exciting C II λ6578 line, at least for nebulae within a certain range of degree of ionization, this line might turn out a good tracer of C2+ abundance.
Figure 5 shows the I(C II λ6578)/I(C II λ4267) line intensity ratio distribution with respect to P. This line ratio clearly shows a trend with P, indicating a significant fluorescent contribution to the excitation of C II λ6578 in at least several nebulae. Additionally, there is a notable inconsistency between the theoretical values predicted by the atomic parameters of Pequignot et al. (1991) and those of Davey et al. (2000), which are connected with the same trend found in Sect. 4.2 for C II λ7231+36+37.
At this point, we can draw two immediate conclusions: i) the dominant excitation mechanism of the C II λ6578 line is not recombination, but continuum fluorescence in most cases; ii) using the theoretical recombination predictions for an optically thick nebula for this line seem inadequate.
As it has been shown that fluorescence is in most cases a key mechanism for accounting for the intensity of the C II λ6578 line, we now aim to investigate the dominant channel populating the 3p 2Po level. We first focus on cascade decays related with C II λλ3918, 3920 lines that populate this level. The uppermost panel of Fig. 6 shows that for most objects the I(C II λ6578)/I(C II λ3918+20) ratio remains relatively constant, except for a small sample of highly-excited PNe where values larger than 10 are reached. This behavior seems to indicate that for most ionized regions the C II λ6578 emission primarily results from cascade decays via C II λλ3918, 3920 line emission. It is worth noting that two PNe (NGC 2440 and M 2-36) fall well above the bulk of the objects in the y-axis. Therefore, the large dispersion of the I(C II λ6578)/I(C II λ3918+20) ratio in PNe prevents us from being conclusive for these objects concerning the prevalence of cascade decays via the C II λλ3918, 3920 lines for populating the upper level of the C II λ6578 line. It should be noted that the data set for C II λλ3918, 3920 lines is smaller due to their location in the bluest region of the optical spectrum and have rather faint intensities prior to the reddening correction, making their measurements challenging. Finally, we should also mention that the theoretical recombination predictions from Davey et al. (2000) are out of the range of the observed I(C II λ6578)/ I(C II λ3918+20) values. We could not compare with predictions from Pequignot et al. (1991) as the authors did not make calculations of the C II λλ3918, 3920 lines.
The other channel that can populate the 3p 2Po level is the cascade decay of the transition that gives rise to the C II λλ7231, 7236, 7237 lines, in which fluorescence competes with recombination for becoming the main excitation mechanism. interestingly, it has been estimated by Grandi (1976) that in the Orion Nebula the contribution of either process is around 50%. Similarly to what has been done before, we now examine the I(C II λ6578)/I(C II λ7231+36+37) line ratio in relation to the ionization degree. in the lower panel of Fig. 6, we present the resulting line ratio versus P. In this figure, we observe a possible dependence on P, contrary to what has been found with the I(C II λ6578)/I(C II λ3918+20) ratio, which seems to indicate that the primary fluorescence channel is the same as for the C II λλ3918, 3920 lines.
A potential test to assess the impact of fluorescence via the C II λλ3918, 3920 channel for the nebulae of our sample is to subtract the intensity of these lines from the C II λ6578 line and inspect the behavior of the I(C II λ6578)-I(C II λ3918+20)/ I(C II λ4267) ratio by comparing with what was obtained in Fig. 5. Figure 7 shows this ratio as a function of P for all the regions in which the spectral lines involved were measured. We have also included the theoretical ratio expected for the same nebular conditions as in the previous cases (blue band), assuming the atomic data of D00. It is quite clear from this figure that for certain regions (mostly Galactic H II regions due to the limited data available for the other type of regions), the fluorescence contribution of the channel that populates the upper level of the C II λλ3918, 3920 lines seems to have been eliminated, indicating that for these regions this channel is the dominant one. This is evident when one observes that the line intensity ratio with respect to C II λ4267, a recombination line (see Sect. 4.1), is nearly flat, independent of P. Therefore, for H II regions, the primary fluorescence channel populating the 3p 2Po level, from which the C II λ6578 line originates, appears to be that of the transitions that generate the C II λλ3918, 3920 lines. However, in the case of PNe, a more detailed analysis that could focus on each individual object is required, which lies however beyond the scope of current paper. Depending on the object, the fluorescence could originate from different channels and its contribution may not always be significant. In some cases, the predominant source of fluorescence may arise from the channel that causes the C II λλ7231, 7236, 7237 lines.
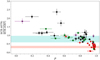 |
Fig. 5 I(C II λ6578)/I(C II λ4267) ratio of all analyzed regions with respect to the degree of ionization P. Symbols and color bands are the same as in Fig. 3. |
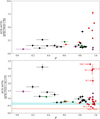 |
Fig. 6 I(C II λ6578)/I(C II λ3918+20) ratio (top panel) and I(C II λ6578)/I(C II λ7231+36+37) ratio (bottom panel) for all analyzed regions with respect to the degree of ionization. Symbols and color-bands are the same as in Fig. 3. |
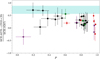 |
Fig. 7 I(C II λ6578)-I(C II λ3918+20)/I(C II λ4267) ratio for all observed regions with respect to the degree of ionization P. Symbols and colorbands are the same as in Fig. 3. The blue band shows the theoretical ratios expected when adopting the atomic data of D00. Note that Pequignot et al. (1991) did not carry out calculations of C II λ3918+20. |
5 Discussion
It is well known that the C2+/H+ ionic abundances inferred from the C II permitted lines are systematically higher than those derived from their collisionally excited counterparts: [C III] λ1907, C III] λ1909, when the “direct method” (Aller 1984; Osterbrock 1988; Dinerstein 1990) is adopted (Torres-Peimbert et al. 1980; Walter et al. 1992; Peimbert et al. 1995; Esteban et al. 1998). To explain this inconsistency, some authors suggested that a fluorescent contribution to the excitation of the C II permitted lines could explain at least part of the problem (Seaton 1968). In the same vein, errors in the atomic parameters have also been invoked to explain this phenomenon (Rodríguez & García-Rojas 2010).
Our results from Sect. 4.1 provide the observational evidence to rule out that the cause of the abundance discrepancy for the C2+ ion, totally or partially, is due to fluorescence and/or errors in the atomic parameters of the permitted C II lines λλ4267, 5342, 6151, 6462, and 9903. Figure 3 and Table 3 show excellent agreement between the observations and the predictions of the atomic models of Pequignot et al. (1991) and Davey et al. (2000) for the aforementioned lines under the hypothesis of pure recombination. Furthermore, despite coming from different levels of the 2Fo-2G and 2D-2Fo transitions are insensitive to the ionization state of the gas, contrary to what should be observed if part of the emission of these lines comes from the fluorescent excitation of C+. In fact, when high quality data is used to determine the C2+/H+ abundance with the aforementioned lines, a good consistency is always found (García-Rojas et al. 2013). These findings show that the C2+ abundance discrepancy has its origin in a physical phenomenon.
Another observational evidence that reinforces that the origin of the C2+ abundance discrepancy due to internal physical complexities of the ionized nebulae is that the C/O abundances, derived with both optical RLs and UV-CELs, vary from region to region and are consistent with each other (Torres-Peimbert et al. 1980; Esteban et al. 2005, 2014; Wang & Liu 2007; Delgado-Inglada & Rodriguez 2014; Berg et al. 2016; Izotov et al. 2023). The fact that C/O abundances from H II regions and planetary nebulae, derived both with optical RLs and UV-CELs are consistent, could suggest that the abundance discrepancies of C2+ and O2+ are originated by the presence of temperature inhomogeneities and/or by the presence of metal-rich gas clumps.
An inhomogeneous temperature structure in the volume where C2+ and O2+ coexist can induce a systematic underestimation in the ionic abundances obtained with CELs, while those derived from RLs would not be affected (Peimbert 1967; Peimbert & Costero 1969; Stasinska 1980; Kingdon & Ferland 1995; García-Rojas & Esteban 2007; Cameron et al. 2023; Méndez-Delgado et al. 2023b). Since [O III] and [C III] UV-CELs arise from atomic levels situated at similar energies, the temperature bias in both ions is rather similar and should therefore cancel out in the ionic abundance ratio C2+/O2+ ∝ C/O. On the other hand, if there are chemical inhomogeneities, as some authors have proposed to explain the AD problem, especially in the case of PNe (Torres-Peimbert et al. 1990; Liu et al. 2000; Tsamis et al. 2004; Yuan et al. 2011; Gómez-Llanos & Morisset 2020; García-Rojas et al. 2022), most of the RL emissions will arise from metal-rich volumes as they would have a lower temperature. If these chemical inhomogeneities preserve the proportion of C and O (as in the case of H-deficient clumps), the C/O values obtained from RLs and CELs will be consistent, as is observed.
The recent observational evidence presented by Méndez-Delgado et al. (2023b) favors the presence of temperature inho-mogeneities as the cause of the AD problem in H II regions, as was originally proposed by Peimbert (1967). However, these authors show (see the Fig. 10 from the ArXiv version) that this mechanism does not act in the same way in PNe. In these objects, the abundance discrepancy might be caused mainly by the presence of chemical inhomogeneities (Torres-Peimbert et al. 1990; Liu et al. 2000; Yuan et al. 2011; García-Rojas et al. 2022). However, as shown by Richer et al. (2022), the presence of chemical inhomogeneities does not imply that temperature inho-mogeneities are absent. The former phenomenon could in fact cause the latter (Zhang et al. 2007). The new generation of pho-toionization models ought to consider these complexities, as is currently being proposed by Jin et al. (2023) and Marconi et al. (2024).
The analysis carried out in Sect. 4.2 emphasizes the importance of testing all theoretical models with dedicated observations. Although the excitation mechanisms of the C II λλ3918, 3920, 7231, 7236, 7237 lines had been previously analyzed in individual nebular regions (Grandi 1975; Escalante et al. 2012), our results, which are based on a general sample of ionized nebulae, reveal that the fraction of excitation attributed to recombination in the case of the C II λλ7231, 7236, 7237 multiplet could be overestimated when one solely uses the atomic recombination parameters from Pequignot et al. (1991) and Davey et al. (2000) to predict the recombination contribution to the observed line fluxes under the assumption of an optically thick nebula. This can furthermore generate important errors in interpretation of photoionization models not only for the aforementioned lines but for all those lines that arise from the C II 3d 2D level as well as those that arise from interconnection levels such as C II λ6578.
The case of the C II λ6578 line is particularly interesting due to its proximity to the Hα line, and has been detected in a large number of objects. If this line was a pure recombination line, it could turn out being a useful tool in any study related to the AD problem. In fact, Richer et al. (2017) presented high spectral resolution spectroscopic observations of the C II λ6578 line over 83 lines of sight across a sample of 76 PNe. These authors calculated a set of photoionization models with central stars (assumed to be a blackbody) that span the temperature range 40 000–150 000 K in order to test the contribution of fluorescence to the emissivity of the C II λ6578 line. They concluded that fluorescence may contribute to a significant fraction of the total emissivity of this line, especially in models that assume a low-temperature for the central star (see their Fig. 7, top row), but fluorescence never dominates the integrated surface brightness of the C II line. These kind of models depend on several assumptions on the effective temperatures of the ionizing stars as well as the accuracy of the effective recombination coefficients. As we show in Sects. 4.2 and 4.3, this is not straightforward as the fluorescence dominates the C II λ6578 excitation thorough cascade decays that give rise to the C II λ3918+20 lines. This unfortunate situation, however, complicates the use of the C II λ6578 line when evaluating the recombination processes that regulate the C2+ ion.
Electronic configurations and dominant mechanism of the C II transitions analysed in this work.
6 Conclusions
In this work, we have analyzed the excitation mechanisms of the permitted C II lines λλ3918, 3920, 4267, 5342, 6151, 6462, 7231, 7236, 7237, and 9903, widely detected on deep spectra in the spectral range around 3100–10 400 Å. We use the DESIRED database (Méndez-Delgado et al. 2023a), which contains many of the deepest spectra of photoionized regions of the literature (see Table. A.1 for references of the spectra), including H II regions, PNe, and photoionized Herbig-Haro objects with a wide range of different physical and ionization conditions. Our main results on the excitation mechanisms of these lines can be summarized in Table 5.
Our methodology is robust and straightforward since it is observationally-based and only uses the initial hypothesis that the emissivity of fluorescent permitted C II lines will be proportional to the C+ abundance, whereas those arising from recombinations will depend on the C2+ abundance. The weak dependence of the emissivity of the C II permitted lines on the physical conditions (Te, ne) allow us to directly address their excitation mechanisms and the accuracy of the atomic models from Pequignot et al. (1991) and Davey et al. (2000), the most widely used to infer C2+/H+ abundances and photoionization modeling.
We show that C II λλ4267, 5342, 6151, 6462, and 9903 are produced by pure recombination. We also show that the recombination theory from Pequignot et al. (1991) and Davey et al. (2000) for these lines is essentially correct. This implies that the long-standing abundance discrepancy problem between the C2+/H+ abundances derived with the aforementioned lines and their UV collisionally excited counterparts ([C III] λ1907 and C III] λ1909) is produced by a physical phenomenon other than fluorescence or errors in atomic recombination coefficients.
On the other hand, we find that C II λλ3918, 3920 lines are excited mainly by fluorescence, while C II λλ7231, 7236, 7237 lines have important contributions from both fluorescence and recombinations. We leave open the possibility of having some overestimation of the recombination emissivity of the C II λλ7231, 7236, 7237 lines by both the atomic parameters of Pequignot et al. (1991) and Davey et al. (2000), which can induce systematic errors in the photoionization modeling of these lines. Photoionization models with detailed information about the ionizing stars of a broad sample of nebulae will shed light on this possibility. Finally, we demonstrate that the main excitation mechanism of C II λ6578 is continuum fluorescence in most cases.
Acknowledgements
J.E.M.-D. and K.K. gratefully acknowledges funding from the Deutsche Forschungsgemeinschaft (DFG, German Research Foundation) in the form of an Emmy Noether Research Group (grant number KR4598/2-1, PI Kreckel) and the European Research Council’s starting grant ERC StG-101077573 (“ISM-METALS”). J.G.-R. acknowledges financial support from the Canarian Agency for Research, Innovation and Information Society (ACIISI), of the Canary Islands Government, and the European Regional Development Fund (ERDF), under grant with reference ProID2021010074, and from grant P/308614 financed by funds transferred from the Spanish Ministry of Science, Innovation and Universities, charged to the General State Budgets and with funds transferred from the General Budgets of the Autonomous Community of the Canary Islands by the MCIU. J.G.-R. also acknowledges funds from the Spanish Ministry of Science and Innovation (MICINN) through the Spanish State Research Agency, under Severo Ochoa Centers of Excellence Program 2020– 2023 (CEX2019-000920-S). We acknowledge support from the Agencia Estatal de Investigación del Ministerio de Ciencia e Innovación (AEI- MCINN) under grant Espectroscopía de campo integral de regiones H II locales. Modelos para el estudio de regiones H II extragalácticas with reference 10.13039/501100011033.
Appendix A Spectra in the DESIRED database with detection of at least two permitted C II lines
Extinction–corrected I(λ)/I(Hβ) (in units of I(Hβ) = 100.0) of C II lines detected in the spectra of the DESIRED database.
References
- Aller, L. H. 1984, Physics of Thermal Gaseous Nebulae [Google Scholar]
- Berg, D. A., Skillman, E. D., Henry, R. B. C., Erb, D. K., & Carigi, L. 2016, ApJ, 827, 126 [NASA ADS] [CrossRef] [Google Scholar]
- Bowen, I. S. 1927, Nature, 120, 473 [NASA ADS] [CrossRef] [Google Scholar]
- Bowen, I. S. 1928, ApJ, 67, 1 [Google Scholar]
- Bowen, I. S. 1935, ApJ, 81, 1 [NASA ADS] [CrossRef] [Google Scholar]
- Bowen, I. S., & Wyse, A. B. 1939, Lick Observatory Bull., 495, 1 [NASA ADS] [Google Scholar]
- Cameron, A. J., Katz, H., & Rey, M. P. 2023, MNRAS, 522, L89 [NASA ADS] [CrossRef] [Google Scholar]
- Corradi, R. L. M., García-Rojas, J., Jones, D., & Rodríguez-Gil, P. 2015, ApJ, 803, 99 [NASA ADS] [CrossRef] [Google Scholar]
- Davey, A. R., Storey, P. J., & Kisielius, R. 2000, A&AS, 142, 85 [NASA ADS] [CrossRef] [EDP Sciences] [Google Scholar]
- Delgado-Inglada, G., & Rodríguez, M. 2014, ApJ, 784, 173 [NASA ADS] [CrossRef] [Google Scholar]
- Delgado-Inglada, G., Mesa-Delgado, A., García-Rojas, J., Rodríguez, M., & Esteban, C. 2016, MNRAS, 456, 3855 [NASA ADS] [CrossRef] [Google Scholar]
- Dinerstein, H. L. 1990, in Astrophysics and Space Science Library, 161, The Interstellar Medium in Galaxies, eds. J. Thronson, A. Harley, & J. M. Shull, 257 [NASA ADS] [CrossRef] [Google Scholar]
- Domínguez-Guzmán, G., Rodríguez, M., García-Rojas, J., Esteban, C., & Toribio San Cipriano, L. 2022, MNRAS, 517, 4497 [CrossRef] [Google Scholar]
- Escalante, V., & Morisset, C. 2005, MNRAS, 361, 813 [NASA ADS] [CrossRef] [Google Scholar]
- Escalante, V., Morisset, C., & Georgiev, L. 2012, MNRAS, 426, 2318 [NASA ADS] [CrossRef] [Google Scholar]
- Espíritu, J. N. & Peimbert, A. 2021, MNRAS, 508, 2668 [CrossRef] [Google Scholar]
- Esteban, C., & García-Rojas, J. 2018, MNRAS, 478, 2315 [NASA ADS] [CrossRef] [Google Scholar]
- Esteban, C., Peimbert, M., Torres-Peimbert, S., & Escalante, V. 1998, MNRAS, 295, 401 [NASA ADS] [CrossRef] [Google Scholar]
- Esteban, C., Peimbert, M., García-Rojas, J., et al. 2004, MNRAS, 355, 229 [NASA ADS] [CrossRef] [Google Scholar]
- Esteban, C., García-Rojas, J., Peimbert, M., et al. 2005, ApJ, 618, L95 [NASA ADS] [CrossRef] [Google Scholar]
- Esteban, C., Bresolin, F., Peimbert, M., et al. 2009, ApJ, 700, 654 [NASA ADS] [CrossRef] [Google Scholar]
- Esteban, C., Carigi, L., Copetti, M. V. F., et al. 2013, MNRAS, 433, 382 [NASA ADS] [CrossRef] [Google Scholar]
- Esteban, C., García-Rojas, J., Carigi, L., et al. 2014, MNRAS, 443, 624 [NASA ADS] [CrossRef] [Google Scholar]
- Esteban, C., Bresolin, F., García-Rojas, J., & Toribio San Cipriano, L. 2020, MNRAS, 491, 2137 [NASA ADS] [Google Scholar]
- Ferland, G. J., Henney, W. J., O’Dell, C. R., et al. 2012, ApJ, 757, 79 [NASA ADS] [CrossRef] [Google Scholar]
- Ferland, G. J., Chatzikos, M., Guzmán, F., et al. 2017, Rev. Mexicana Astron. Astrofis., 53, 385 [Google Scholar]
- García-Rojas, J., & Esteban, C. 2007, ApJ, 670, 457 [CrossRef] [Google Scholar]
- García-Rojas, J., Esteban, C., Peimbert, M., et al. 2004, ApJS, 153, 501 [CrossRef] [Google Scholar]
- García-Rojas, J., Esteban, C., Peimbert, A., et al. 2005, MNRAS, 362, 301 [CrossRef] [Google Scholar]
- García-Rojas, J., Esteban, C., Peimbert, M., et al. 2006, MNRAS, 368, 253 [CrossRef] [Google Scholar]
- García-Rojas, J., Esteban, C., Peimbert, A., et al. 2007, Rev. Mexicana Astron. Astrofis., 43, 3 [Google Scholar]
- García-Rojas, J., Peña, M., Morisset, C., Mesa-Delgado, A., & Ruiz, M. T. 2012, A&A, 538, A54 [NASA ADS] [CrossRef] [EDP Sciences] [Google Scholar]
- García-Rojas, J., Peña, M., Morisset, C., et al. 2013, A&A, 558, A122 [NASA ADS] [CrossRef] [EDP Sciences] [Google Scholar]
- García-Rojas, J., Madonna, S., Luridiana, V., et al. 2015, MNRAS, 452, 2606 [CrossRef] [Google Scholar]
- García-Rojas, J., Delgado-Inglada, G., García-Hernández, D. A., et al. 2018, MNRAS, 473, 4476 [CrossRef] [Google Scholar]
- García-Rojas, J., Wesson, R., Boffin, H. M. J., et al. 2019, ArXiv e-prints, [arXiv: 1904.06763] [Google Scholar]
- García-Rojas, J., Morisset, C., Jones, D., et al. 2022, MNRAS, 510, 5444 [CrossRef] [Google Scholar]
- Gómez-Llanos, V., & Morisset, C. 2020, MNRAS, 497, 3363 [CrossRef] [Google Scholar]
- Grandi, S. A. 1975, ApJ, 196, 465 [NASA ADS] [CrossRef] [Google Scholar]
- Grandi, S. A. 1976, ApJ, 206, 658 [NASA ADS] [CrossRef] [Google Scholar]
- Grotrian, W., Born, M., & Franck, J. 1928, Graphische Darstellung der Spektren von Atomen und Ionen mit Ein, Zwei und Drei Valenzelektronen: Erster Teil, Struktur der Materie in Einzeldarstellungen (Springer Berlin Heidelberg) [Google Scholar]
- Huggins, M. L. 1898, ApJ, 8, 54 [NASA ADS] [CrossRef] [Google Scholar]
- Huggins, W., & Miller, W. A. 1864, Philos. Trans. Roy. Soc. Lond. Ser. I, 154, 437 [Google Scholar]
- Izotov, Y. I., Schaerer, D., Worseck, G., et al. 2023, MNRAS, 522, 1228 [NASA ADS] [CrossRef] [Google Scholar]
- Jin, Y., Sutherland, R., Kewley, L. J., & Nicholls, D. C. 2023, ApJ, 958, 179 [NASA ADS] [CrossRef] [Google Scholar]
- Jones, D., Wesson, R., García-Rojas, J., Corradi, R. L. M., & Boffin, H. M. J. 2016, MNRAS, 455, 3263 [NASA ADS] [CrossRef] [Google Scholar]
- Kingdon, J. B., & Ferland, G. J. 1995, ApJ, 450, 691 [NASA ADS] [CrossRef] [Google Scholar]
- Kurucz, R. L. 1991, in Precision Photometry: Astrophysics of the Galaxy, eds. A. G. D. Philip, A. R. Upgren, & K. A. Janes, 27 [Google Scholar]
- Landi, E., Del Zanna, G., Young, P. R., Dere, K. P., & Mason, H. E. 2012, ApJ, 744, 99 [Google Scholar]
- Liu, X.-w. 2006, in Planetary Nebulae in our Galaxy and Beyond, 234, eds. M. J. Barlow, & R. H. Méndez, 219 [NASA ADS] [Google Scholar]
- Liu, X. W., Storey, P. J., Barlow, M. J., et al. 2000, MNRAS, 312, 585 [NASA ADS] [CrossRef] [Google Scholar]
- López-Sánchez, Á. R., Esteban, C., García-Rojas, J., Peimbert, M., & Rodríguez, M. 2007, ApJ, 656, 168 [CrossRef] [Google Scholar]
- Luridiana, V., Morisset, C., & Shaw, R. A. 2015, A&A, 573, A42 [NASA ADS] [CrossRef] [EDP Sciences] [Google Scholar]
- Madonna, S., García-Rojas, J., Sterling, N. C., et al. 2017, MNRAS, 471, 1341 [CrossRef] [Google Scholar]
- Maiolino, R., & Mannucci, F. 2019, A&A Rev., 27, 3 [NASA ADS] [CrossRef] [Google Scholar]
- Marconi, A., Amiri, A., Feltre, A., et al. 2024, A&A, submitted [arXiv:2401.13028] [Google Scholar]
- Méndez-Delgado, J. E., Esteban, C., García-Rojas, J., et al. 2021a, MNRAS, 502, 1703 [CrossRef] [Google Scholar]
- Méndez-Delgado, J. E., Henney, W. J., Esteban, C., et al. 2021b, ApJ, 918, 27 [CrossRef] [Google Scholar]
- Méndez-Delgado, J. E., Esteban, C., García-Rojas, J., & Henney, W. J. 2022, MNRAS, 514, 744 [CrossRef] [Google Scholar]
- Méndez-Delgado, J. E., Esteban, C., García-Rojas, J., et al. 2023a, MNRAS, 523, 2952 [CrossRef] [Google Scholar]
- Méndez-Delgado, J. E., Esteban, C., García-Rojas, J., Kreckel, K., & Peimbert, M. 2023b, Nature, 618, 249 [CrossRef] [Google Scholar]
- Mesa-Delgado, A., Esteban, C., García-Rojas, J., et al. 2009, MNRAS, 395, 855 [NASA ADS] [CrossRef] [Google Scholar]
- Moore, C. E., & Merrill, P. W. 1968, Partial Grotrian Diagrams of Astrophysical Interest [Google Scholar]
- Nemer, A., Sterling, N. C., Raymond, J., et al. 2019, ApJ, 887, L9 [NASA ADS] [CrossRef] [Google Scholar]
- Osterbrock, D. E. 1988, PASP, 100, 412 [NASA ADS] [CrossRef] [Google Scholar]
- Peimbert, M. 1967, ApJ, 150, 825 [NASA ADS] [CrossRef] [Google Scholar]
- Peimbert, A. 2003, ApJ, 584, 735 [NASA ADS] [CrossRef] [Google Scholar]
- Peimbert, M., & Costero, R. 1969, Bol. Observatorios Tonantzintla Tacubaya, 5, 3 [NASA ADS] [Google Scholar]
- Peimbert, M., Torres-Peimbert, S., & Luridiana, V. 1995, Rev. Mexicana Astron. Astrofis., 31, 131 [Google Scholar]
- Peimbert, M., Peimbert, A., & Delgado-Inglada, G. 2017, PASP, 129, 082001 [NASA ADS] [CrossRef] [Google Scholar]
- Pequignot, D., Petitjean, P., & Boisson, C. 1991, A&A, 251, 680 [NASA ADS] [Google Scholar]
- Pilyugin, L. S. 2001, A&A, 369, 594 [NASA ADS] [CrossRef] [EDP Sciences] [Google Scholar]
- Richer, M. G., Suárez, G., López, J. A., & García Díaz, M. T. 2017, AJ, 153, 140 [NASA ADS] [CrossRef] [Google Scholar]
- Richer, M. G., Arrieta, A., Arias, L., et al. 2022, AJ, 164, 243 [NASA ADS] [CrossRef] [Google Scholar]
- Rodríguez, M. 1999, A&A, 348, 222 [NASA ADS] [Google Scholar]
- Rodríguez, M. & García-Rojas, J. 2010, ApJ, 708, 1551 [CrossRef] [Google Scholar]
- Seaton, M. J. 1968, MNRAS, 139, 129 [NASA ADS] [CrossRef] [Google Scholar]
- Sharpee, B., Williams, R., Baldwin, J. A., & van Hoof, P. A. M. 2003, ApJS, 149, 157 [NASA ADS] [CrossRef] [Google Scholar]
- Sharpee, B., Zhang, Y., Williams, R., et al. 2007, ApJ, 659, 1265 [NASA ADS] [CrossRef] [Google Scholar]
- Skillman, E. D., Berg, D. A., Pogge, R. W., et al. 2020, ApJ, 894, 138 [NASA ADS] [CrossRef] [Google Scholar]
- Sowicka, P., Jones, D., Corradi, R. L. M., et al. 2017, MNRAS, 471, 3529 [NASA ADS] [CrossRef] [Google Scholar]
- Stasinska, G. 1980, A&A, 85, 359 [NASA ADS] [Google Scholar]
- Torres-Peimbert, S., Peimbert, M., & Daltabuit, E. 1980, ApJ, 238, 133 [NASA ADS] [CrossRef] [Google Scholar]
- Torres-Peimbert, S., Peimbert, M., & Pena, M. 1990, A&A, 233, 540 [NASA ADS] [Google Scholar]
- Tsamis, Y. G., Barlow, M. J., Liu, X. W., Storey, P. J., & Danziger, I. J. 2004, MNRAS, 353, 953 [NASA ADS] [CrossRef] [Google Scholar]
- Vale Asari, N., Stasinska, G., Morisset, C., & Cid Fernandes, R. 2016, MNRAS, 460, 1739 [NASA ADS] [CrossRef] [Google Scholar]
- van Hoof, P. A. M. 2018, Galaxies, 6, 63 [NASA ADS] [CrossRef] [Google Scholar]
- Walter, D. K., Dufour, R. J., & Hester, J. J. 1992, ApJ, 397, 196 [NASA ADS] [CrossRef] [Google Scholar]
- Wang, W., & Liu, X. W. 2007, MNRAS, 381, 669 [Google Scholar]
- Wyse, A. B. 1942, ApJ, 95, 356 [NASA ADS] [CrossRef] [Google Scholar]
- Yuan, H. B., Liu, X. W., Péquignot, D., et al. 2011, MNRAS, 411, 1035 [NASA ADS] [CrossRef] [Google Scholar]
- Zhang, Y., Ercolano, B., & Liu, X. W. 2007, A&A, 464, 631 [NASA ADS] [CrossRef] [EDP Sciences] [Google Scholar]
All Tables
Electronic configurations and energy levels of the different C II transitions analysed in this work.
Observed line intensity ratios from the C II 2Fo-2G and 2D-2Fo transitions that are compared to theoretical predictions where the temperature covers the range 4000–15 000 K.
C II line ratios obtained from a photoionization models simulating Orion’s dust and chemical abundances, the observed values from Esteban et al. (2004), and the predicted values from recombination by Davey et al. (2000).
Electronic configurations and dominant mechanism of the C II transitions analysed in this work.
Extinction–corrected I(λ)/I(Hβ) (in units of I(Hβ) = 100.0) of C II lines detected in the spectra of the DESIRED database.
All Figures
|
Fig. 1 Grotrian diagram showing the permitted electronic transitions of the C II ion energy levels (adapted from Moore & Merrill 1968). In green we show the transition causing the C II 14267 line where the main excitation mechanism is recombination; purple lines show the transitions behind the C II λλ3918, 3920, and λλ7231, 7236, 7237 lines (these last ones marked with a purple star) that are likely to be excited by photon pumping from the continuum (orange transitions). The line we most focus on this project is shown in red. Its corresponding upper level can be seen to be interconnected to the emission of the C II λλ3918, 3920, λλ7231, 7236, 7237 lines, potentially excited by fluorescence. The values shown on the vertical axis represent the energy level separation from the ground level 2p. In grey are shown alternative deexcitation transitions that lead to populating the ground level 2p. |
| In the text | |
|
Fig. 2 Grotrian diagram showing permitted electronic transitions between the energy levels of the C II ion (adopted from Grandi 1976). In green we show the transitions that generate the C II λ4267, λ5342, λ6151, λ6462, and λ9903 recombination lines; in purple we show the transitions causing the C II λλ3918, 3920, λλ7231, 7236, 7237 lines that are likely excited by photon pumping from the continuum. The line that focus our attention is shown in red. Its upper source level is interconnected with the emission of the C II λλ3918, 3920, λλ7231, 7236, 7237 lines. The values in eV on the vertical axis represent the energy level separations from the ground level. Notice that the 4f–7g, 4f–6g, and 4f–5g transitions shown in green give rise to the C II λ5342, λ6462, and λ9903 lines, respectively, and subsequently to the emission of the λ4267 line. |
| In the text | |
|
Fig. 3 Intensity ratios of recombination lines. From top to bottom: I(C II λ5342)/I(C II λ4267), I(C II λ6151)/I(C II λ4267), I(C II λ6462/ I(C II λ4267), and I(C II λ9903)/I(C II λ4267) ratios of all analyzed regions: galactic PNe (red circles), galactic H II regions (black diamonds), extragalactic H II regions (green squares), and photoionized Herbig-Haro objects (purple stars) as a function of the degree of ion-ization P. The red band shows the theoretical ratio expected for nebular conditions consisting of a temperature in the range 4000–15 000 K and a density 103 cm−3 assuming the atomic data of Pequignot et al. (1991) (P91, only available for C II 4267 and 9903) while the blue band shows the theoretical ratio expected when adopting the atomic data of Davey et al. (2000) (D00). |
| In the text | |
|
Fig. 4 I(C II λ7231+36+37)/I (C II λ4267) ratio (top panel) and I(C II λ3918+20)/I(C II λ4267) ratio (bottom panel) of all analyzed regions with respect to the degree of ionization P. Symbols and color bands are the same as in Fig. 3. Notice that Pequignot et al. (1991) do not include computations for the C II λλ3918, 3920 lines. |
| In the text | |
|
Fig. 5 I(C II λ6578)/I(C II λ4267) ratio of all analyzed regions with respect to the degree of ionization P. Symbols and color bands are the same as in Fig. 3. |
| In the text | |
|
Fig. 6 I(C II λ6578)/I(C II λ3918+20) ratio (top panel) and I(C II λ6578)/I(C II λ7231+36+37) ratio (bottom panel) for all analyzed regions with respect to the degree of ionization. Symbols and color-bands are the same as in Fig. 3. |
| In the text | |
|
Fig. 7 I(C II λ6578)-I(C II λ3918+20)/I(C II λ4267) ratio for all observed regions with respect to the degree of ionization P. Symbols and colorbands are the same as in Fig. 3. The blue band shows the theoretical ratios expected when adopting the atomic data of D00. Note that Pequignot et al. (1991) did not carry out calculations of C II λ3918+20. |
| In the text | |
Current usage metrics show cumulative count of Article Views (full-text article views including HTML views, PDF and ePub downloads, according to the available data) and Abstracts Views on Vision4Press platform.
Data correspond to usage on the plateform after 2015. The current usage metrics is available 48-96 hours after online publication and is updated daily on week days.
Initial download of the metrics may take a while.