Open Access
Fig. 4
Download original image
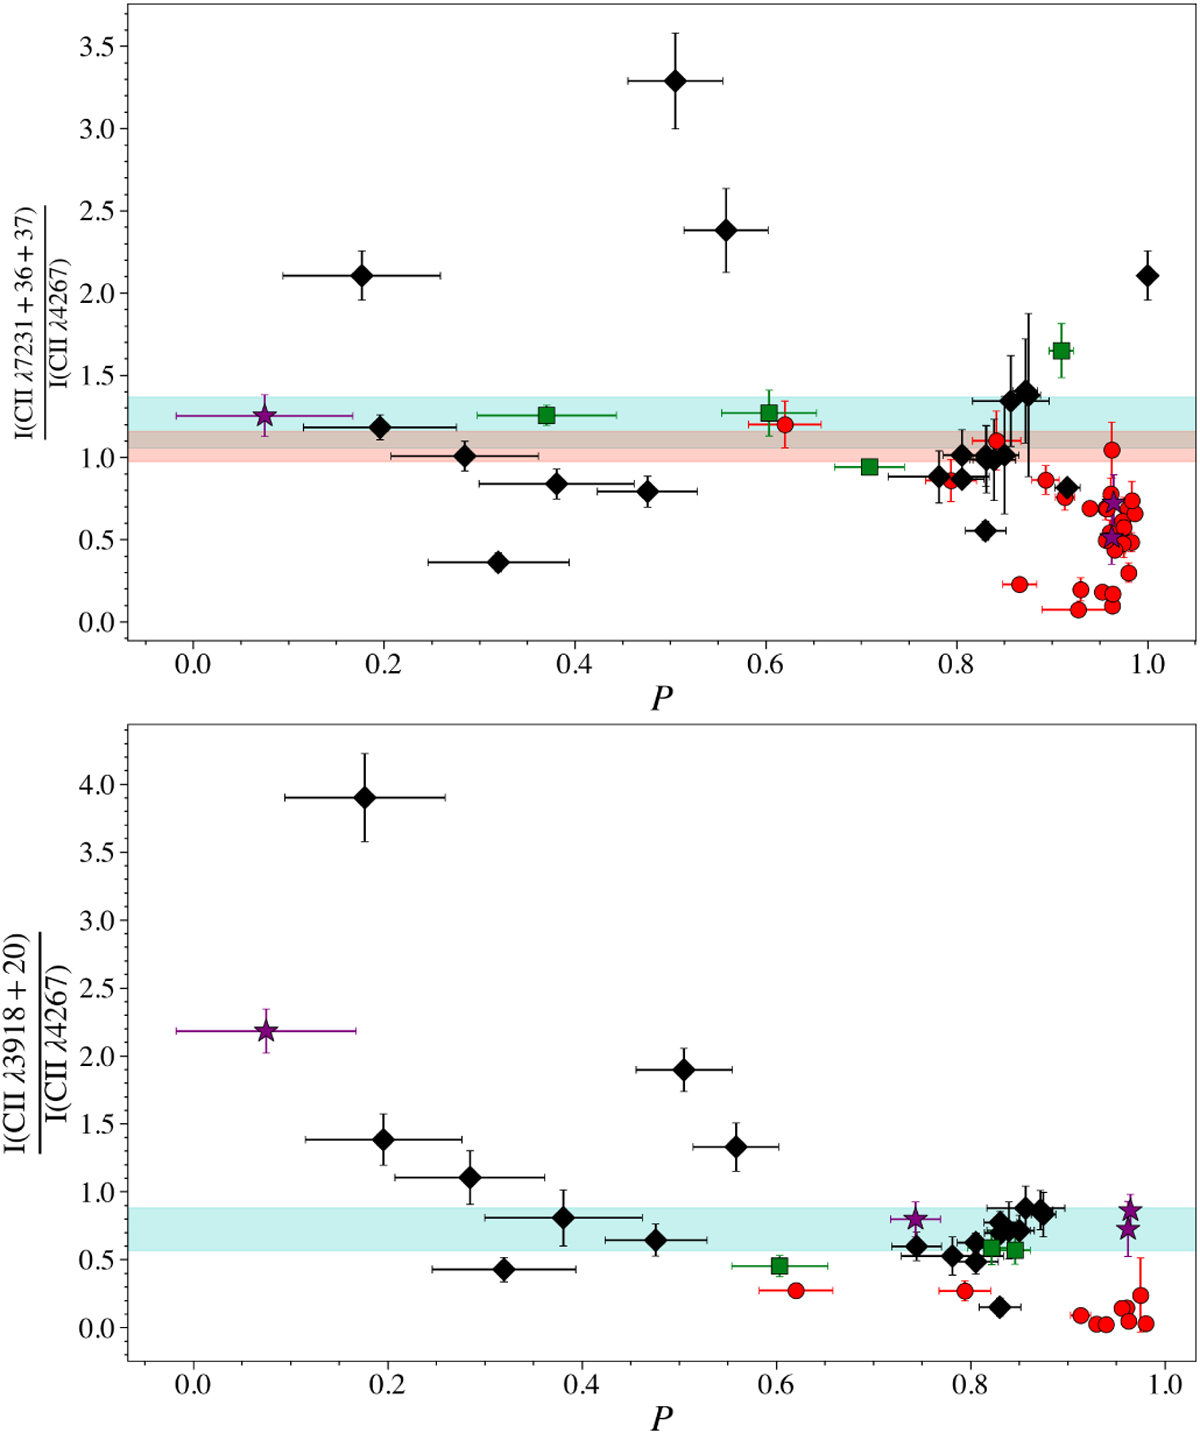
I(C II λ7231+36+37)/I (C II λ4267) ratio (top panel) and I(C II λ3918+20)/I(C II λ4267) ratio (bottom panel) of all analyzed regions with respect to the degree of ionization P. Symbols and color bands are the same as in Fig. 3. Notice that Pequignot et al. (1991) do not include computations for the C II λλ3918, 3920 lines.
Current usage metrics show cumulative count of Article Views (full-text article views including HTML views, PDF and ePub downloads, according to the available data) and Abstracts Views on Vision4Press platform.
Data correspond to usage on the plateform after 2015. The current usage metrics is available 48-96 hours after online publication and is updated daily on week days.
Initial download of the metrics may take a while.