Fig. 3
Download original image
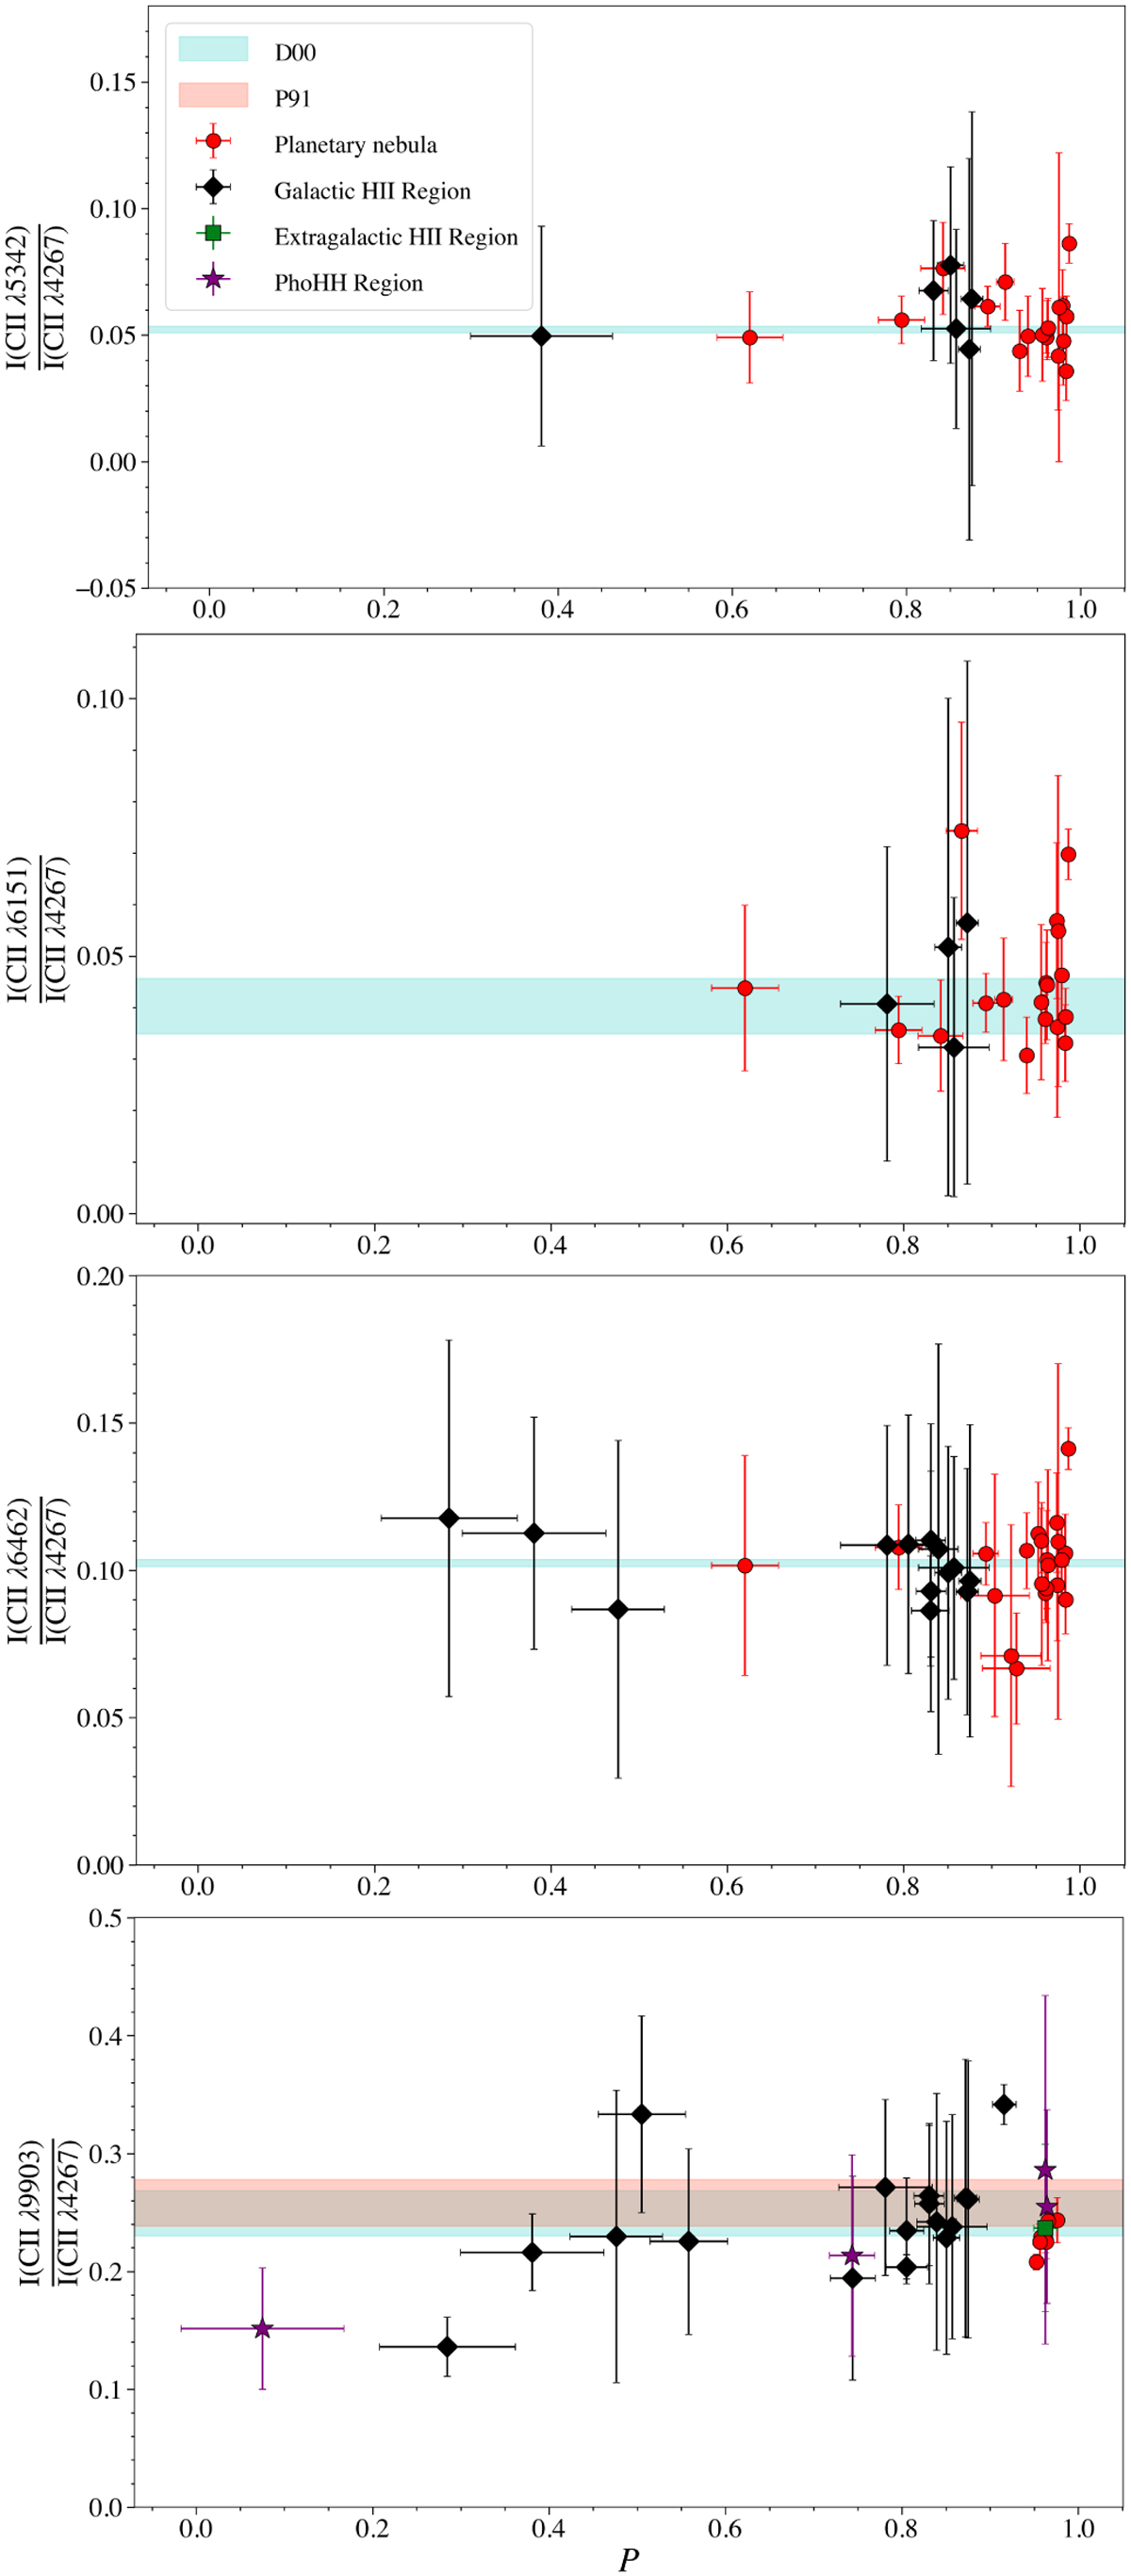
Intensity ratios of recombination lines. From top to bottom: I(C II λ5342)/I(C II λ4267), I(C II λ6151)/I(C II λ4267), I(C II λ6462/ I(C II λ4267), and I(C II λ9903)/I(C II λ4267) ratios of all analyzed regions: galactic PNe (red circles), galactic H II regions (black diamonds), extragalactic H II regions (green squares), and photoionized Herbig-Haro objects (purple stars) as a function of the degree of ion-ization P. The red band shows the theoretical ratio expected for nebular conditions consisting of a temperature in the range 4000–15 000 K and a density 103 cm−3 assuming the atomic data of Pequignot et al. (1991) (P91, only available for C II 4267 and 9903) while the blue band shows the theoretical ratio expected when adopting the atomic data of Davey et al. (2000) (D00).
Current usage metrics show cumulative count of Article Views (full-text article views including HTML views, PDF and ePub downloads, according to the available data) and Abstracts Views on Vision4Press platform.
Data correspond to usage on the plateform after 2015. The current usage metrics is available 48-96 hours after online publication and is updated daily on week days.
Initial download of the metrics may take a while.