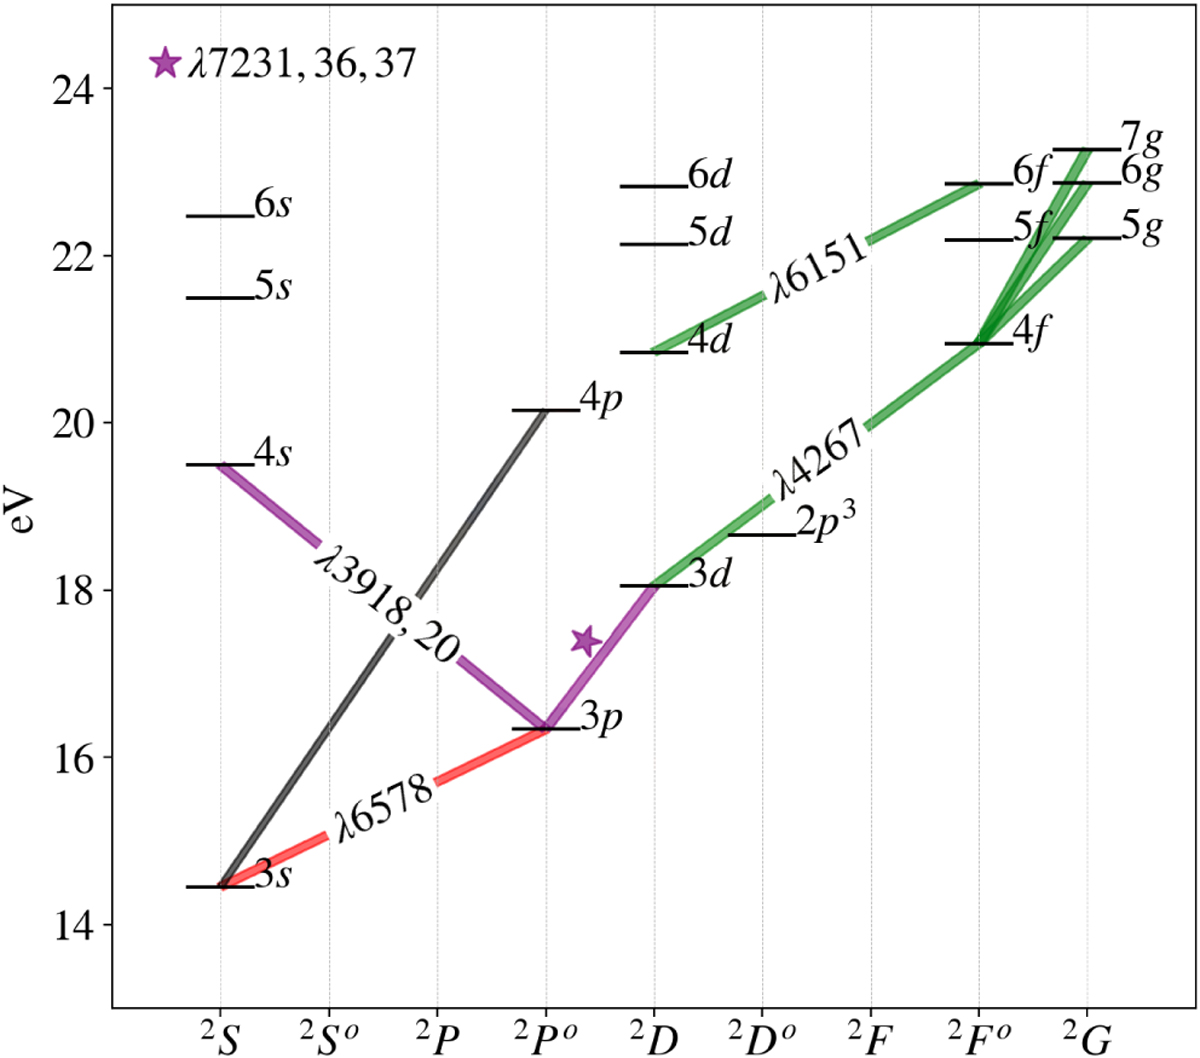
Fig. 2
Download original image
Grotrian diagram showing permitted electronic transitions between the energy levels of the C II ion (adopted from Grandi 1976). In green we show the transitions that generate the C II λ4267, λ5342, λ6151, λ6462, and λ9903 recombination lines; in purple we show the transitions causing the C II λλ3918, 3920, λλ7231, 7236, 7237 lines that are likely excited by photon pumping from the continuum. The line that focus our attention is shown in red. Its upper source level is interconnected with the emission of the C II λλ3918, 3920, λλ7231, 7236, 7237 lines. The values in eV on the vertical axis represent the energy level separations from the ground level. Notice that the 4f–7g, 4f–6g, and 4f–5g transitions shown in green give rise to the C II λ5342, λ6462, and λ9903 lines, respectively, and subsequently to the emission of the λ4267 line.
Current usage metrics show cumulative count of Article Views (full-text article views including HTML views, PDF and ePub downloads, according to the available data) and Abstracts Views on Vision4Press platform.
Data correspond to usage on the plateform after 2015. The current usage metrics is available 48-96 hours after online publication and is updated daily on week days.
Initial download of the metrics may take a while.