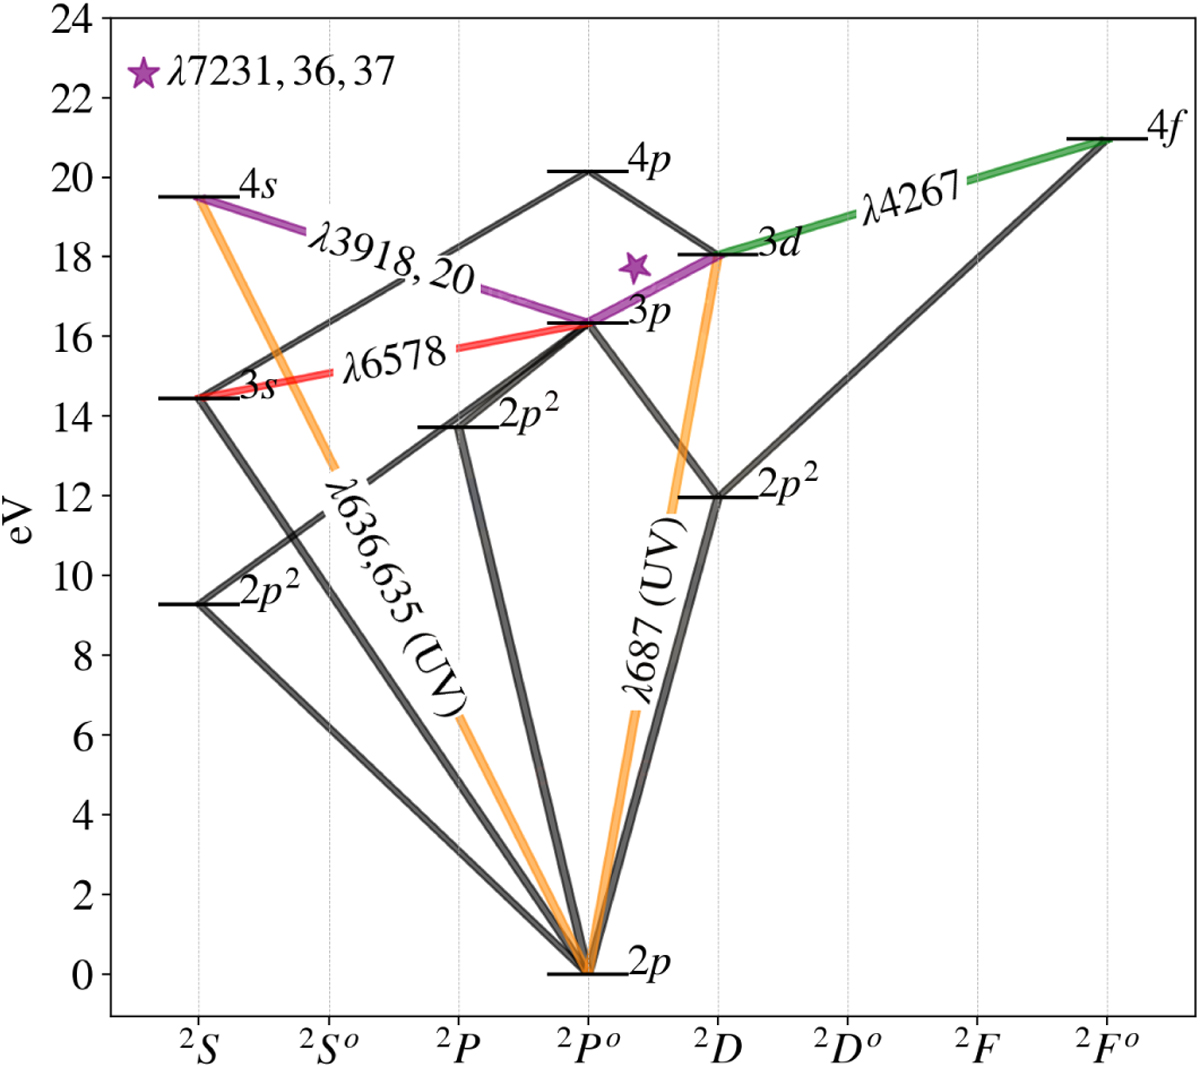
Fig. 1
Download original image
Grotrian diagram showing the permitted electronic transitions of the C II ion energy levels (adapted from Moore & Merrill 1968). In green we show the transition causing the C II 14267 line where the main excitation mechanism is recombination; purple lines show the transitions behind the C II λλ3918, 3920, and λλ7231, 7236, 7237 lines (these last ones marked with a purple star) that are likely to be excited by photon pumping from the continuum (orange transitions). The line we most focus on this project is shown in red. Its corresponding upper level can be seen to be interconnected to the emission of the C II λλ3918, 3920, λλ7231, 7236, 7237 lines, potentially excited by fluorescence. The values shown on the vertical axis represent the energy level separation from the ground level 2p. In grey are shown alternative deexcitation transitions that lead to populating the ground level 2p.
Current usage metrics show cumulative count of Article Views (full-text article views including HTML views, PDF and ePub downloads, according to the available data) and Abstracts Views on Vision4Press platform.
Data correspond to usage on the plateform after 2015. The current usage metrics is available 48-96 hours after online publication and is updated daily on week days.
Initial download of the metrics may take a while.