Fig. 7
Download original image
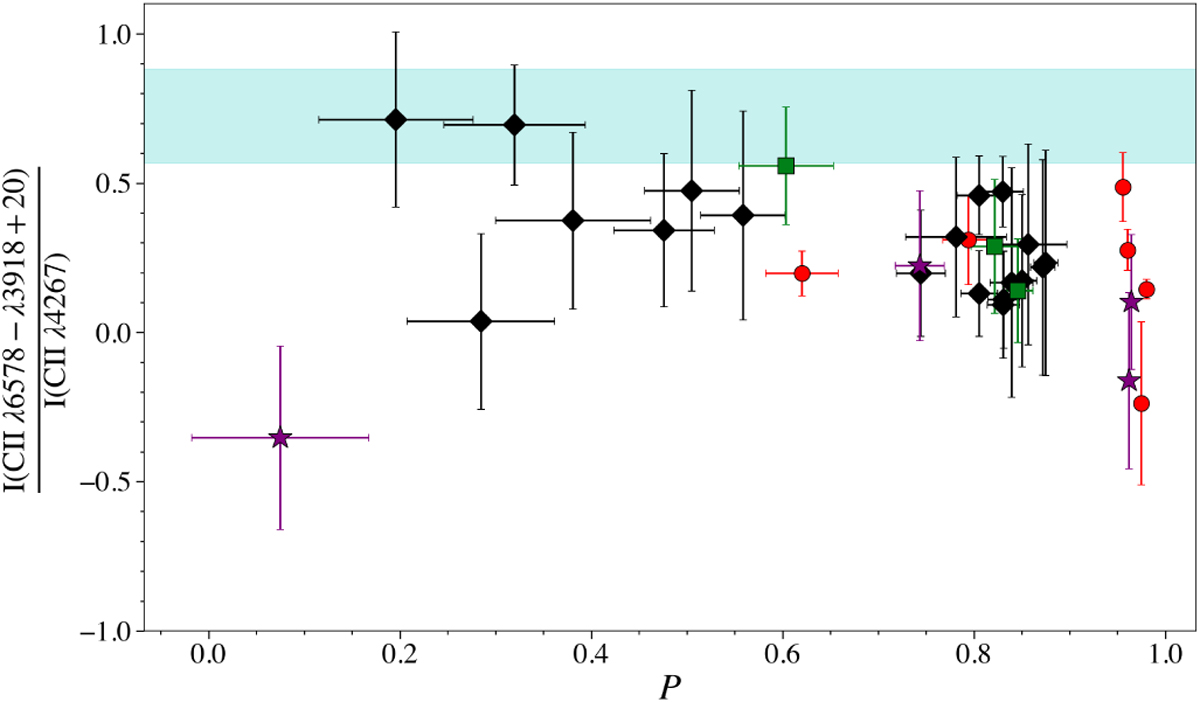
I(C II λ6578)-I(C II λ3918+20)/I(C II λ4267) ratio for all observed regions with respect to the degree of ionization P. Symbols and colorbands are the same as in Fig. 3. The blue band shows the theoretical ratios expected when adopting the atomic data of D00. Note that Pequignot et al. (1991) did not carry out calculations of C II λ3918+20.
Current usage metrics show cumulative count of Article Views (full-text article views including HTML views, PDF and ePub downloads, according to the available data) and Abstracts Views on Vision4Press platform.
Data correspond to usage on the plateform after 2015. The current usage metrics is available 48-96 hours after online publication and is updated daily on week days.
Initial download of the metrics may take a while.